SOP-42Q-MES0107 Operation Dashboard
42Q Home > Reporting > Operations Dashboard
Contents
- 1 Introduction
- 2 Displaying a Dashboard
- 3 Default Dashboards
- 4 Creating and Configuring Dashboards
- 5 Global Widgets
- 5.1 Yield
- 5.2 Throughput
- 5.3 Cycle Time
- 5.4 Cycle Time by Product
- 5.5 Output Reports
- 5.6 Output by Process
- 5.7 Product Family Reports
- 5.8 Work in Progress Reports (WIP)
- 5.9 Top Defect
- 5.10 Shop Order Reports
- 5.11 CMMS
- 5.12 OEE
Introduction
42Q Operation Dashboard is a tool that provides a quick look into various aspects of factory operations, allowing users to identify problems on the production floor by providing a global vision of a plant’s performance and capacity. Condenses productivity reports gathered from MESWeb into more than 30 standard widgets that can be accessed remotely from Android tablets or viewed on large screens situated on the shop floor.
The screen data is refreshed according to predefined parameters of 1 - 60-minute intervals and displayed in widgets of three different categories: Global, Product Family, and Top.
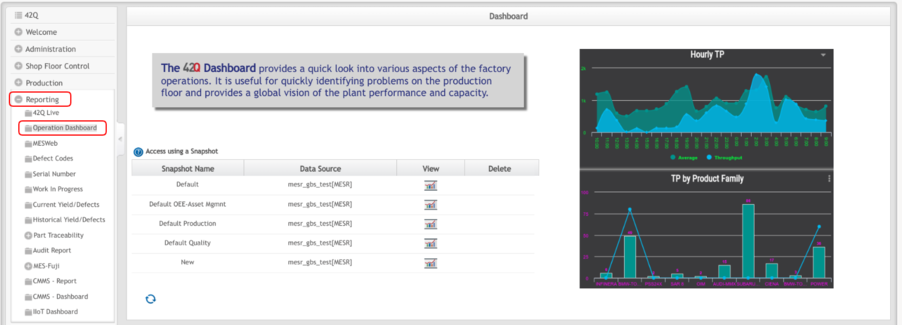
To access Operation Dashboard via the 42Q portal in the reporting module go to: Reporting > Operation Dashboard.
Figure 1: Operation Dashboard
As the image above shows, users are able to choose from the different elements on the screen; Charts are displayed on the right side of the screen; (The Charts appear at random, so they might or not look like the ones in the picture).
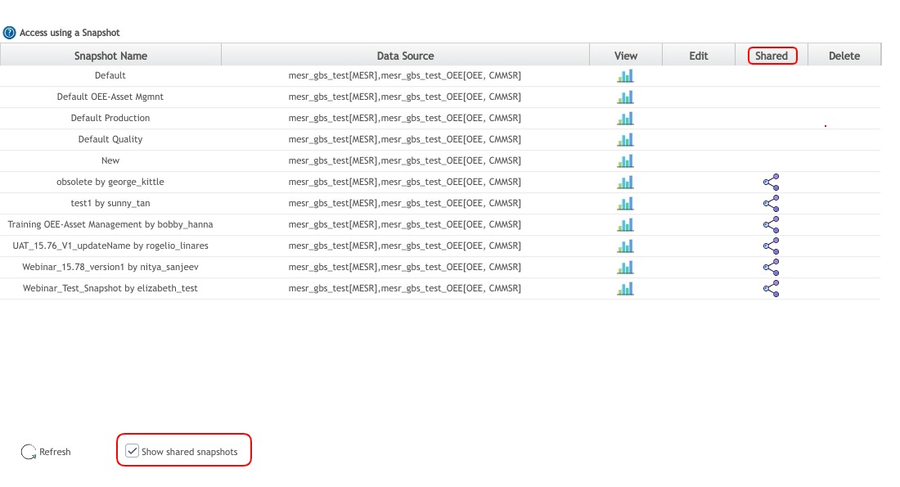
The Snapshot list shows a selected report configuration, the Refresh button to update the snapshot list, and the Show share snapshots that will allow users to hide the shared snapshots that are displayed by default.
Displaying a Dashboard
If the user has not configured a new snapshot yet, then the following Snapshot options would appear:
- Default
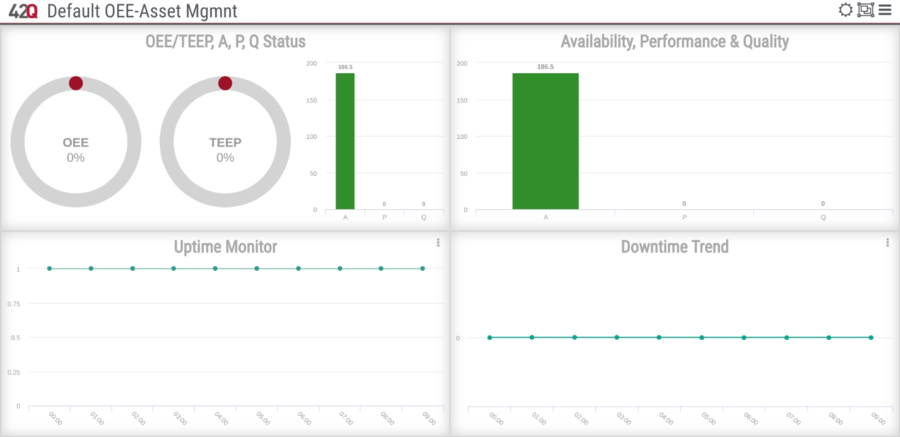
- Default OEE-Asset Mgmnt
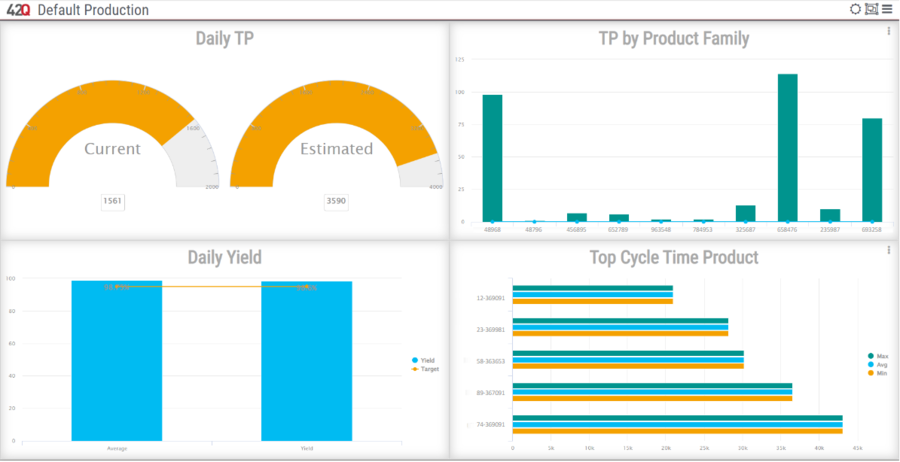
- Default Production
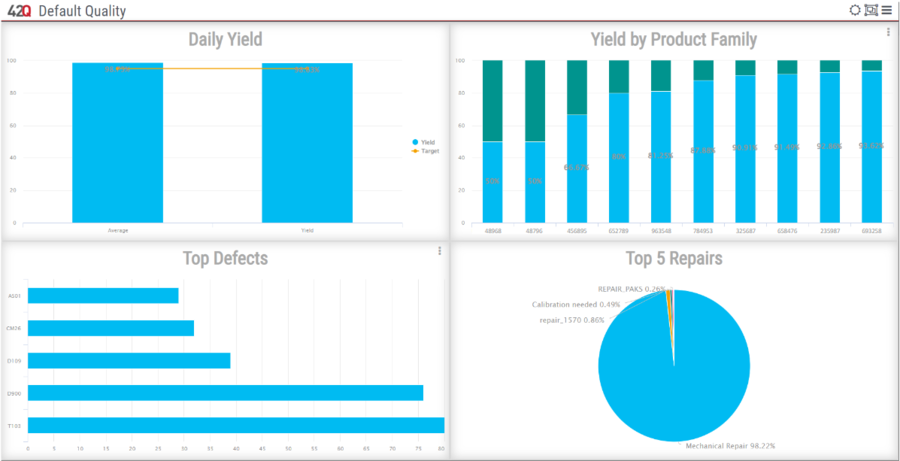
- Default Quality
- New
Each Snapshot’s Data Source is individual; that column depends on the Data Source settings from MESWeb Central, in order to display any of those Snapshots, the user must click on the View icon.
Data Resource
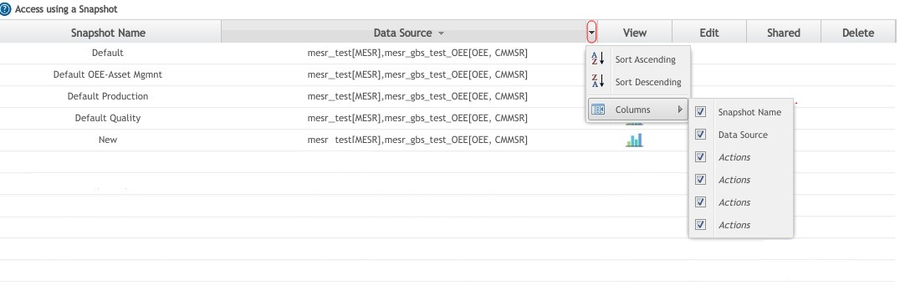
All data sources available to the current user are accessible. Data sources are displayed in brackets in the Data Source column (see figure, below).
Figure 2: Data Sources Available to Current User
To change the data that displays on the screen, right-click the Data Source drop-down menu and uncheck the data you wish to remove (see figure, below).
Figure 3: Change Screen Display
View
Once the view is selected, users are directed to a work page. Use the icons across the top right menu bar to select and arrange widgets onto the tiles and design the layout.
Figure 4: Snapshot View Icon
Edit
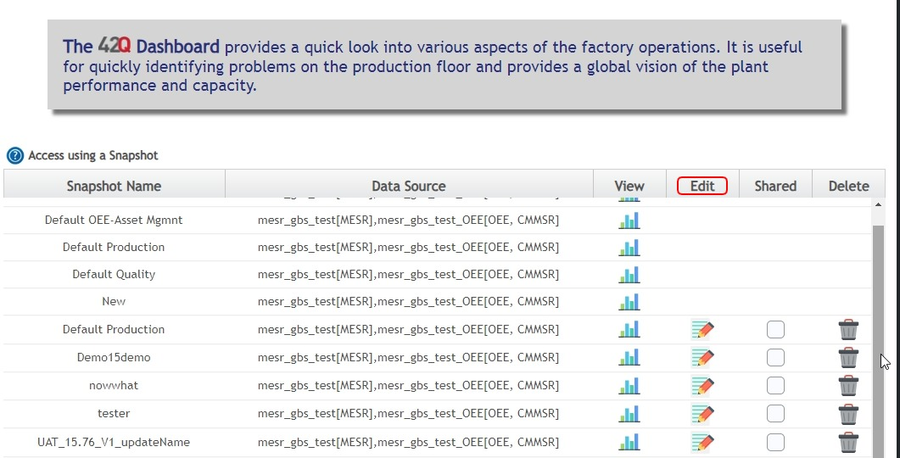
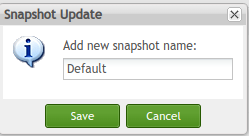
Users can click the Edit icon, to rename or edit a snapshot name. Once the new snapshot name is updated, save the changes (See the figure below).
Figure 5: Edit
Figure 6: Snapshot Update
Users created snapshots will appear on the snapshot list in order to enable sharing. All users inside the community will have access to this dashboard with the behavior of the default ones. Users are required to uncheck the Show shared snapshots box to hide the shared snapshots, however by default they are displayed.
Figure 7: Shared
Delete
Users can click on the trash can icon, to delete a particular snapshot. When a snapshot is deleted or unshared by the owner, an error message will be displayed on the current dashboard and stop refreshing.
Figure 8: Delete
Figure 9: Error message
Note: Dashboard Configuration is fully explained later at Global Configuration.
Default Dashboards
Default Snapshot
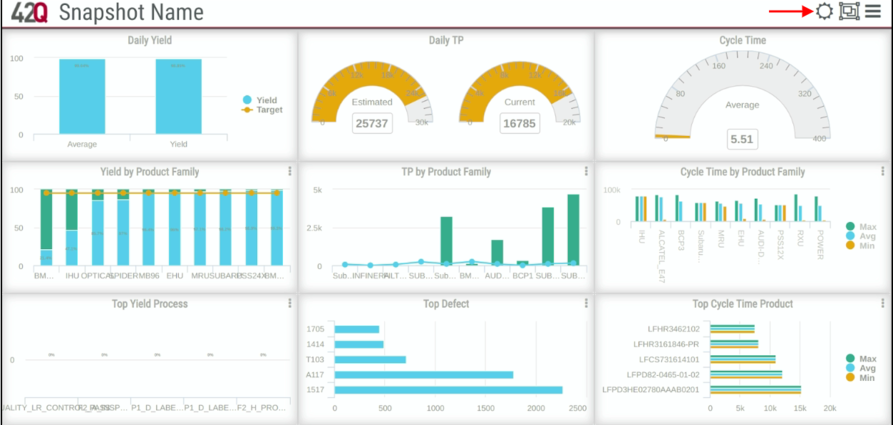
When the user clicks on the View icon of the Default Snapshot it directs users to the Dashboard Screen, which displays predefined widgets with the selected information.
Figure 5: Default Operations Dashboard with Day theme
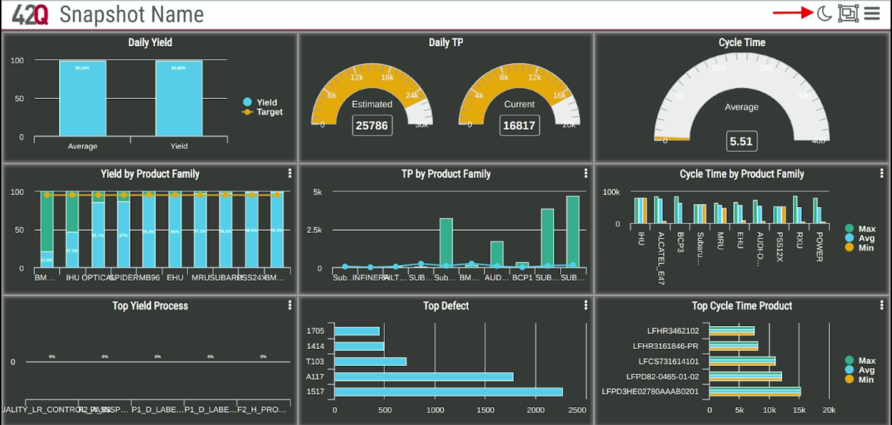
Note: Snapshots can be displayed either with a night or day theme, this can be changed by clicking on the Sun or Moon icon at the top right of the screen.
Figure 6: Default Operation Dashboard with the Night theme
Default OEE - Asset Management
Prerequisites
Before parameters can be selected, assets and production lines must have expected target values assigned to them in Target Maintenance. (Shop Floor Control > Configuration > Target Maintenance). For more information, please refer to the SOP Target Maintenance.
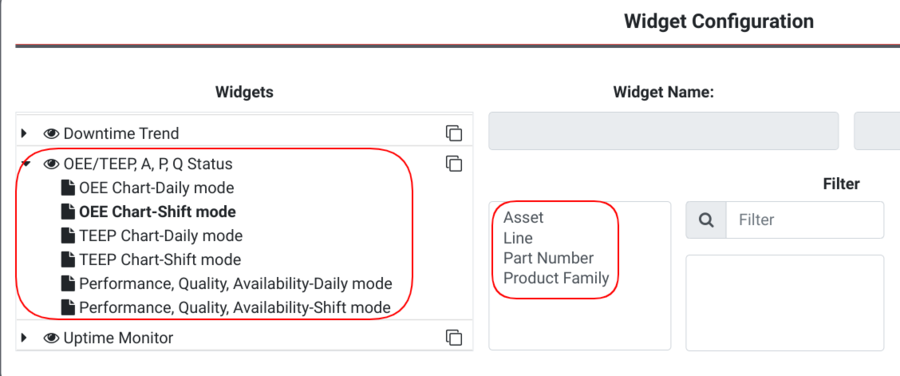
Filter/select the Data to be included on the widget’s report from the following categories:
Figure 7: OEE Widget filters
- Assets: View data collected from an individual asset (machine) on the shop floor. Select the asset to be added to the dashboard by scrolling through the drop-down menu or entering the Asset name into the search bar.
Note: Assets are configured in Shop Floor Control > Configuration > CMMS Asset > Asset. For more information, please refer to the SOP CMMS Asset.
- Lines: View data according to an individual manufacturing line. Select the line to be added to the dashboard by scrolling the drop-down menu or entering the Production Line identifier into the search bar.
Note: Manufacturing Lines are configured in the Manufacturing Line portlet, for more information, please refer to the SOP MFG Line Maintenance.
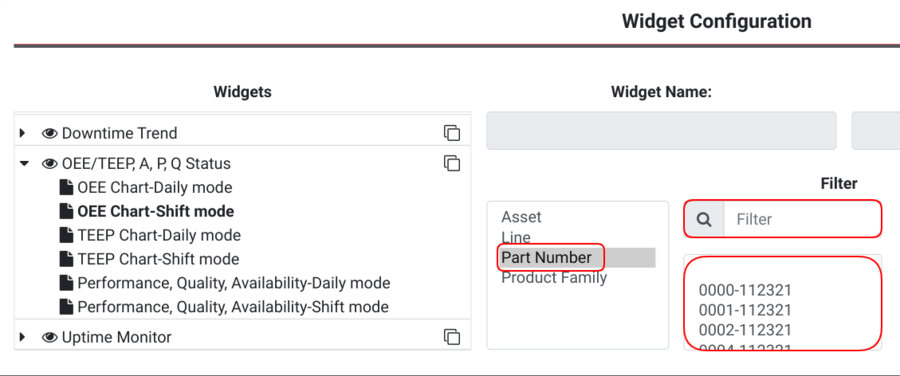
- Part Number: View data according to a product’s Part Number. Select the part number to be added to the dashboard by scrolling the drop-down menu or entering the Part Number in the search menu.
Figure 8: Part Number Filter
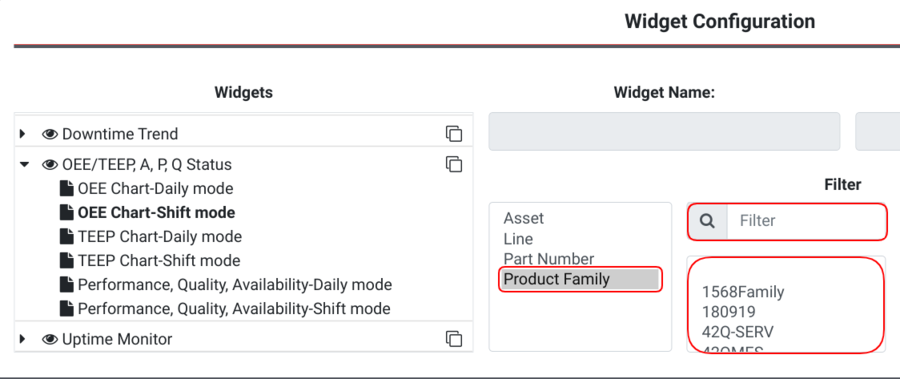
- Part Family: View an entire family of Part Numbers. Select the Part Family to be added to the dashboard by scrolling the drop-down menu or entering the Part Family in the search menu.
Figure 9: Product Family filter
Default OEE - Standard Packages (OEE Widget)
OEE (Overall Equipment Effectiveness) widgets to the Operations Dashboard provide a near real-time (or other time dimensions) view of different kinds of efficiency and productivity metrics and KPIs.
With one quick glance at 42Q Dashboards in shop floor screens/monitors, operations management and staff can have answers to broader questions and rapidly take actions to troubleshoot and neutralize problems: How well are my assets working? How are my lines moving? What is causing quality, delays, or downtimes? What time of the day do problems occur more frequently? Where?
42Q provides core OEE widgets within the Operations Dashboard tool. Each Widget's feature and configuration details are outlined below.
Contains the following widgets:
- OEE/TEEP, A, P, Q Status
- Availability, Performance, Quality
- Uptime Monitor
- Downtime Trend
Figure 10: Default OEE-Asset Mgmnt
Default Production
Contains the following widgets:
- Daily Throughput
- Throughput by Product Family
- Daily Yield
- Top Cycle Time Product
Figure 11: Default Production
Default Quality Snapshot
Contains the following widgets:
- Daily Yield
- Yield by Product Family
- Top Defects
- Top 5 Repairs
Figure 12: Default Quality
Creating and Configuring Dashboards
Operations Dashboard allows users to configure which widgets to display, the refresh interval, and the length of data to gather for the widget. By default, the Daily Yield widget reports: Operation Dashboard yield by hours and Operation Dashboard yield by day, showing average results from the past 6 days.
Note: Users may configure the previously mentioned reports to display results anywhere between 1 and 14 days. Target value average statistics can be configured in the same way.
- Select the configuration menu bars
- The following screen displays.
The configuration page is comprised of two parts: Widget and Global configuration options.
Figure 13: Operation Dashboard Configuration Menu
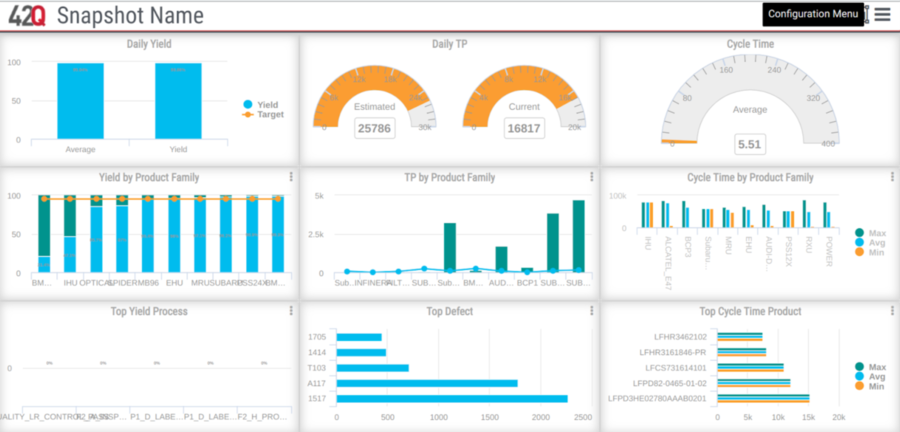
Note: There are some Widget configurations that have to be done from the MesWeb Central (Administration > MesWeb Central > Administrator icon > Dashboard configuration)
To configure the dashboard, access the Configuration menu:
Figure 14: Configuration Options
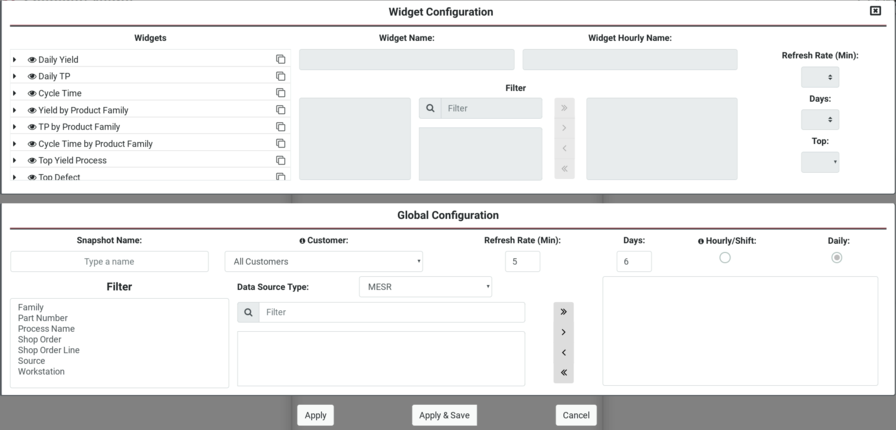
Widget Configurations are applied to individual widgets, whereas Global Configurations are applied to the entire dashboard.
New Snapshot
The New Snapshot directs users to a blank 6x6 grid screen where they can select which statistical widgets to display, organize them and adjust their size in the layout screen, based on their individual reporting needs. All customers in the database are available for selection.
Figure 15: Blank grid screen for New snapshot creation
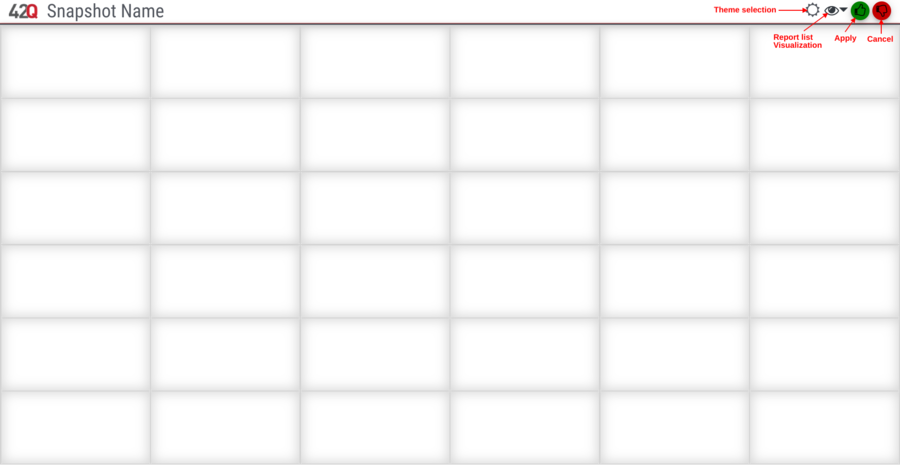
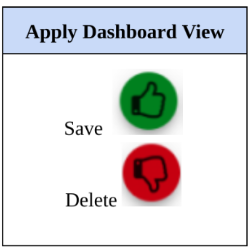
Icons that appear at the top right of the snapshot screen include the Theme selection (day and night), Report list visualization, Apply, and Cancel; those last two icons work to either apply or discard the performed changes on the Snapshot.
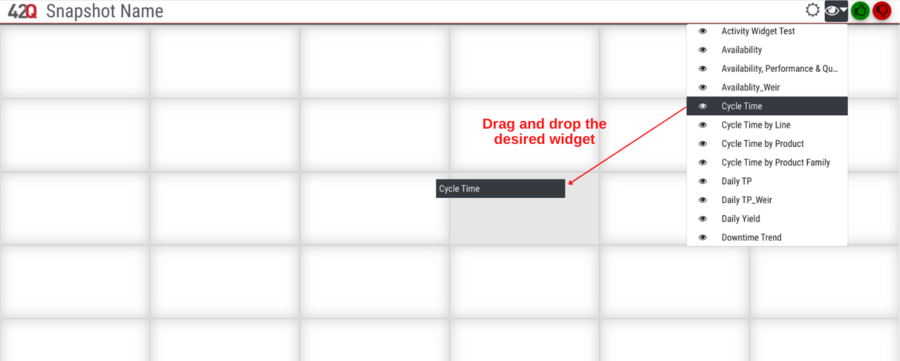
To add a report to the layout follow the next steps:
- Open the Reports drop-down list by selecting the Eye icon at the top right of the screen.
- Then, add the desired reports to the grid, either by:
- Selecting the Eye icon on the left side of the report’s name
- Or by dragging the report’s name directly from the list and dropping it on the grid.
Once the report is placed there, it disappears from the list of available reports to select.
Figure 16: Reports list
When a report is added to the grid, it would appear the size of one of the divisions of the screen along with three icons:
- Move Layout: This icon allows users to move the layout around the grid and place it where desired by clicking on it and holding the click while moving it.
- Expand Layout: Users are able to adjust the layout’s displayable size by holding the click on the icon and dragging it out until achieving the desired size.
Note: This option only allows for expanding the layout size; however, if a size reduction is required, the report must be deleted and added again to expand it to the desired size.
- Delete Layout: Once this option is clicked on the layout disappears, and returns to be available in the Reports list.
A Snapshot cannot be saved with blank spaces on the grid, whether there are only one or several widgets to be displayed, the entire space should be occupied by the Apply button to allow the user to save it. If this snapshot is just being created, the screen would update to display the actually selected widget with the user’s selected arrangement.
Note: Customized snapshots are managed and visible only at the user level. They cannot be shared with others; Typically, users have access to several Data Sources of different types (MESR, CMMSR, etc) that are selected automatically by the system, based on predefined permissions. The new snapshot display screen offers three options to the users:
- Change theme.
- Organize Layout: Returns the user to the Snapshot creation grid screen to allow modifications.
- Configuration Menu.
Deleting a Snapshot
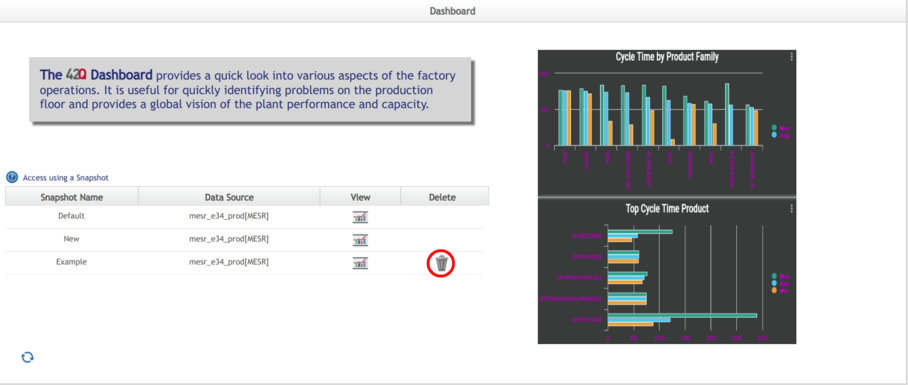
If a Widget configuration isApplied and saved, the snapshot name would be added to the list at the Operation Dashboard Welcome screen; To delete a snapshot from the list user must perform two steps:
- Select the Trash can icon under the Delete Snapshot for the chosen snapshot.
- Select the Refresh button to reload the Snapshot list. The deleted snapshot will no longer be displayed.
Figure 17: Snapshot List - Delete a Snapshot
Widget configuration
Users are able to configure the widgets filters or Refresh Rates from the Snapshot window. Widgets not selected for the current layout are designated by a covered eye icon.
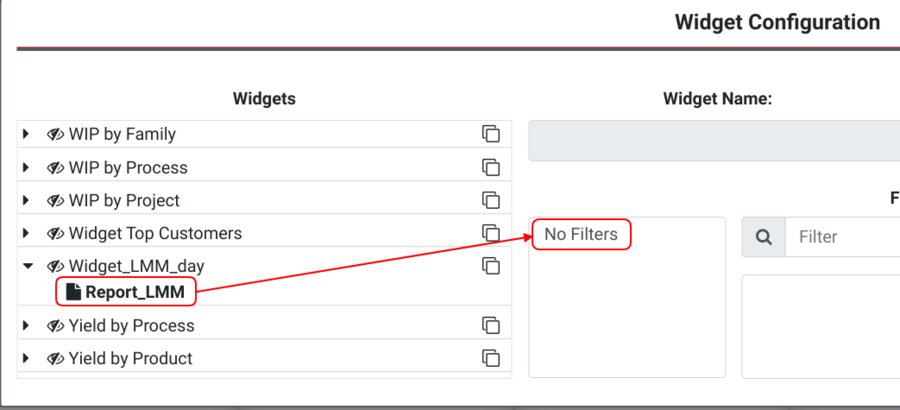
This section of the configuration menu allows users to apply filters to widgets individually. There is a list of all existing widgets that can be configured.
Note that a widget is a view that can contain one or multiple reports. Filters are applied to each report, and they can be different for each widget.
Figure 18: Widget Configuration

Configure Individual Widgets
Each widget may contain multiple reports. Filtered data is applied to each report. To select data for the widget:
- Expand the widget name.
- Select the report.
To select individual or multiple data that will be added to the reports:
- Choose a filter category to display the available data.
- Then, use the Arrow GUIs to indicate the system in which data needs to be filtered affecting the widget.
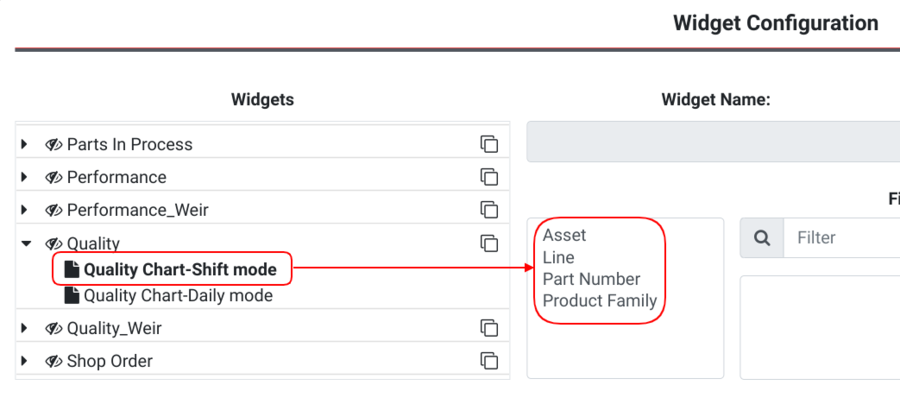
Note: Users must consider that each widget has its own filter list, as shown in the examples below.
Figure 19: Add Filtered Data to Reports

Figure 20: Example 1: Different filters according to a selected widget.
Figure 21: Example 2: Different filters according to a selected widget.
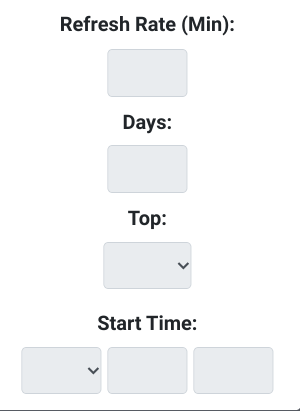
- The Refresh Rate defines how often data is refreshed from the database.
- Days option applies only to those widgets that have an option to display data for the number of days passed.
- The top option applies to the number of items the users want to be displayed in the chart, users can select from the top 5 or top 10.
Figure 22: Widget Configuration - Refresh Rate / Top
Clone a Widget
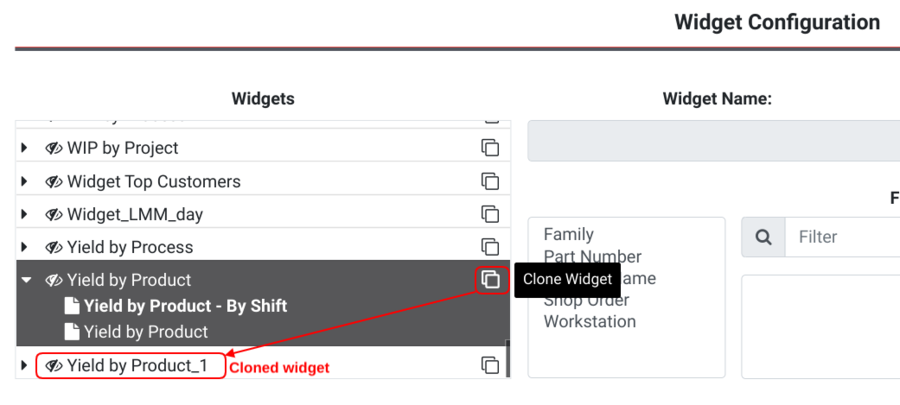
Users may clone a widget by selecting the clone icon adjacent to the selected widget.
The Clone option allows users to create multiple widgets with different filters applied. For example, a user might clone the Top 5 Problems widget and configure one to display problems for Line 1 and the second to display problems for Line 2, thereby allowing plants to view the activity from both lines side by side.
Figure 23: Clone a Widget
- Select one report.
- Then select the Clone Widget icon.
- Locate the cloned widget to configure data filters.
- Once the configuration is complete, select Apply, Apply & Save or Cancel.
- Apply will only make the changes visible temporarily.
- Apply & Save will make the changes visible but will also save them in the Snapshot.
- Cancel will cancel any change done and will close the configuration window.
Note: The widgets are alphabetically ordered, so, when cloning a widget, the new widget will be located in the list according to that alphabetical order.
Global Configuration
The global configuration screen applies data to an entire dashboard. The global configuration applies to any/all individual widget(s) with no data assigned in the Widget Configuration.
Note: Although global configuration applies to all widgets, the global filters will be applied only if the filter exist in the widget.
Figure 24: Global Configuration
For the Global Configuration follow the steps below:
- Input a name in the Snapshot name field. This is the name that will appear at the Snapshot list and at the top of the Widget displayed view.
- Select a customer from the drop-down list; in the case of MES data, a specific customer can be selected, so Dashboard will display data for that customer only. Note: This doesn’t apply to OEE data.
- Select the Hourly/Shift (Hourly for MES / Shift for OEE) or Daily radio button to determine the frequency of the report. Note: For OEE, Hourly will display data for the last shift, while Daily will display data for the current day (00:00 to current time).
- By hour: Displays the data from the past 60 minutes (for MES data).
- By day: Displays data from 00:00 to the current time (for MES data).
- Select the Refresh Rate and Days to determine how often to refresh data from the database, and how many days of data (in a 6 to 14 days range) to display on those reports that it is applicable. Note: This configuration will be applied to all widgets on the Dashboard.
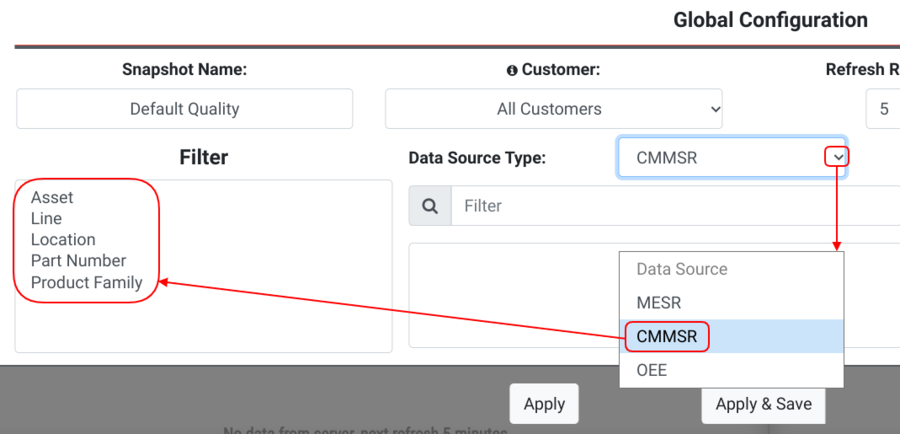
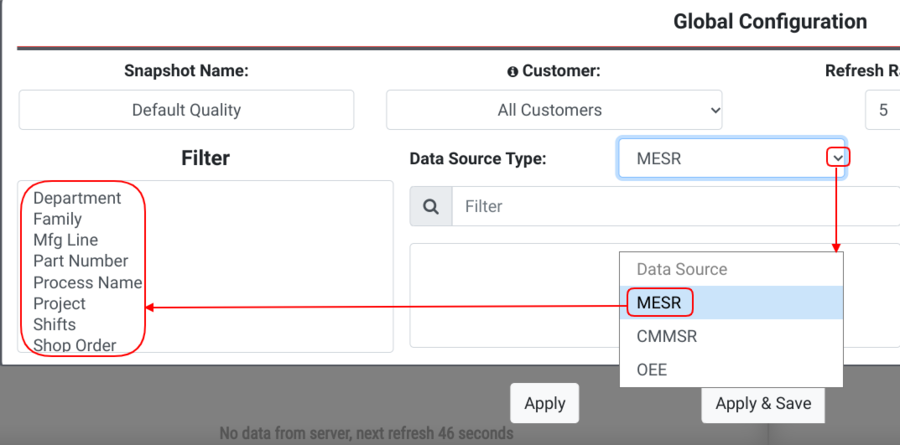
- Select a Data Source Type from the drop-down menu. Note: Available data sources depend on the MesWeb Central configuration established for the community where the user was logged-in which can include none, one, or several options to select from MESR and CMMRS (for OEE widgets).
- CMMRS: Contains OEEdata captured with OEE Data Collection and APIs. Parameters for OEE widgets are outlined above.
Figure 25: CMMRS Data Types
- MESR: Data source is used to configure MES101 widgets. MESR contains data displayed through MES101 widgets. Administrators can create unique dashboards to investigate the root cause of problems by selecting specific parameters.
Figure 26: MESR Data Types
The following are the available data types for MESR:
- Department
- Family
- Mfg Line
- Part Number
- Part Family
- Process Name (See How To Use Flex Fields to View Test Data in Operation Dashboard).
- Project
- Shifts
- Shop Order (Plants can utilize the 42Q Shop Order placeholder to connect a Work Order from the Oracle system).
- Shop Order Line
- Unit Status
- WIP Department
- WIP Family
- WIP Part Number
- WIP Process
- WIP Project
- WIP Workstation
- Workstation (Workstations are described here and configured on the Serial Number page: (Reporting > Serial Number).
To add to the dashboard any of the available data types in MESR or CMMRS:
- Select a data type in the filter. The available data will appear in the right side box.
- Then, select data by scrolling the drop-down menu or entering the data in the search bar.
- Select Apply, Apply & Save to complete the action or Cancel to quit.
- Apply: Changes are saved locally, in the user’s current window.
- Apply & Save: Changes are saved as a Snapshot, and listed on the main Operation Dashboard page.
- Cancel: Changes are deleted; the system then directs the user to the main Operation Dashboard page.
The Saved Snapshots will be listed on the portlet and will also be visible at the top of the Dashboard.
Figure 27: Data Type selection
Note: Consider that a global configuration affects an entire dashboard, so, the data type selected will be applied only if it is included originally in the widgets of the dashboard to be modified.
Global Widgets
Global widgets provide plant-level information regarding Yield, Throughput (TP), and Cycle Time. Reports shown are based on the Customer selected in the Settings window.
Yield
Daily Yield/Hourly Yield
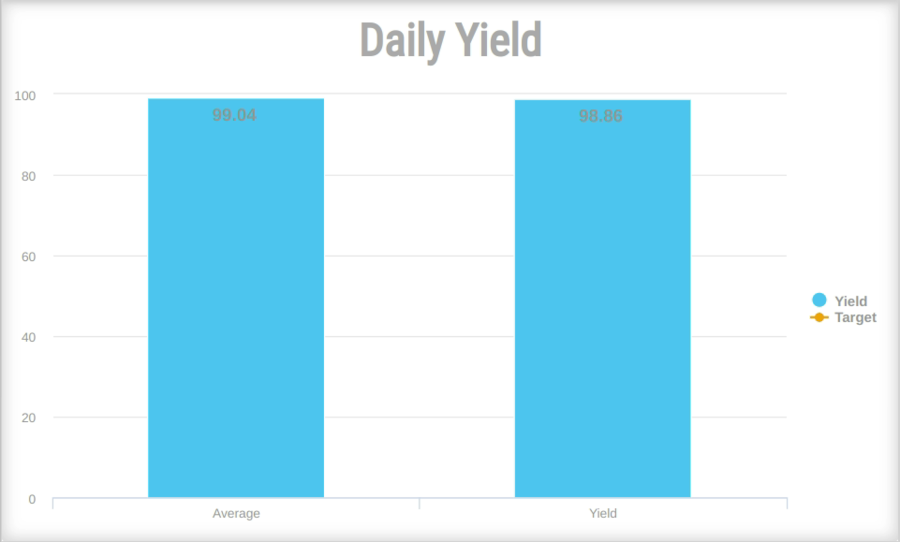
Daily Yield/Hourly Yield reports compare the current yield value against the average value of the last number(n) of days. Established target values are also displayed. Daily Yield is getting the information from Operation Dashboard yield by day report. It is getting the yield from the selected customer from the current day at 00:00 to the current hour.
Formulas used for Daily Yield
For the Daily Yield, the calculation is done based on the total processed units, passed units and failed units. The formula to calculate Yield is:
Yield = (Passed_Units / Total_Processed_Units) * 100
If we have
Total Units = 10
Passed Units = 8
Failed Units = 2
Applying the formula we got:
Yield = (8 / 10) * 100 = 0.8 * 100 = 80
Yield = 80%
For the “Yield“ calculation on this particular report, we based it on the total units passed on the current day. The “Average” calculation is based on the average of the past “n” days yield.
The number of days (“n” value used before) used in this report is selected by the user from 6 to 14 days.
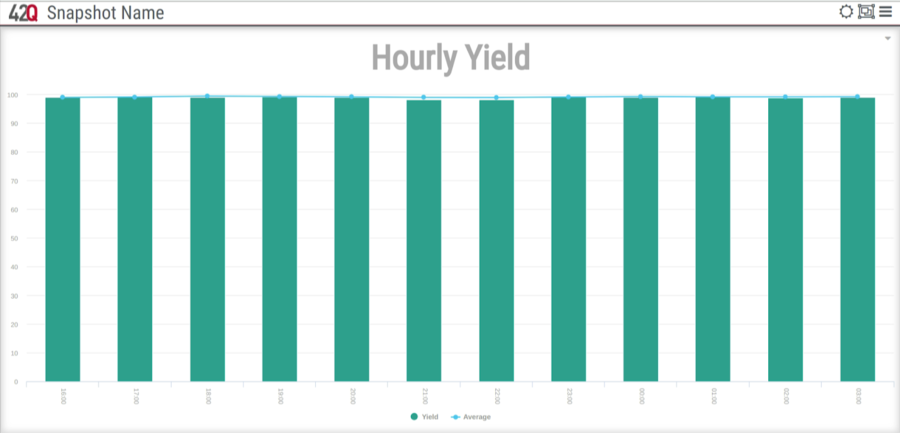
Hour mode displays yield and average yield values by the hour. Users can select whether to see the last 12 or 24 hours.
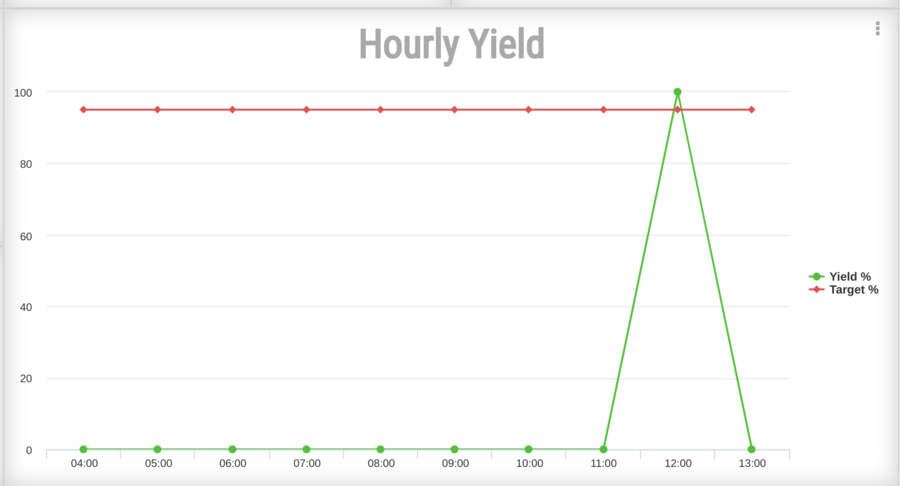
Hourly Yield is getting the information from “Operation_Dashboard_yield_by_hours” report. This report shows a chart with two sets of series, one is line series and the other is the bar series, they are showing the following information as follows: e.g. Current hour: 4:11 am
Figure 29: Hourly Yield
Formulas used for Hourly Yield
The Hourly Yield report is calculating the “Yield” and the “Average” values as follows:
Yield
The yield is calculated for every hour from the current date to 24 hours before as follows:
If the current hour is 16:53, the “Yield” is calculated from 16:00 to 16:53 for the first value.
Example
The second Yield value is calculated from 15:00 to 15:59:59.
The third Yield value is calculated from 14:00 to 14:59:59
… and so on until completed with the last values:
Example
The 23rd value is calculated from 18:00 to 18:59:59.
The 24th value is calculated from 17:00 to 17:59:59.
Average
If the current hour is 16:53, the “Average” is calculated from 16:00 to 16:53 average for the past “n” days for the first value.
The second Yield value is calculated from 15:00 to 15:59:59 average for the past “n” days.
The third Yield value is calculated from 14:00 to 14:59:59 for average the past “n” days.
… and so on until completed with the last values:
The 23rd value is calculated from 18:00 to 18:59:59 average for the past “n” days.
The 24th value is calculated from 17:00 to 17:59:59 average for the past “n” days.
The number of days (“n” value used before) used in this report is selected by the user from 6 to 14 days.
Top Yield Process
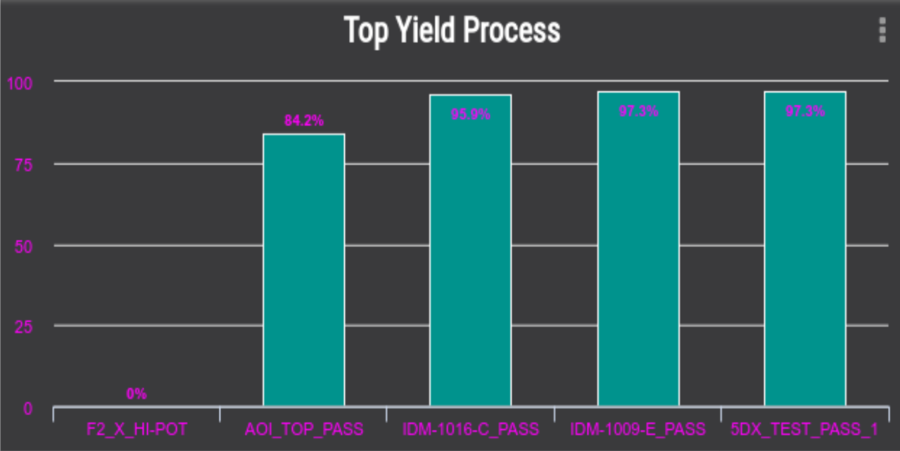
This report displays the top five processes with the lowest yield % making it easier for users to identify processes with problems.
Figure 30: Top Yield Process
By selecting the menu at the top right corner users can select which of the 5 processes to display or hide.
Formulas Used for Top Yield Process
This calculation is showing the top 5 lowest yield processes at the plant. The values are calculated with the following formula:
Yield = (Passed_Units / Total_Processed_Units) * 100
The information is grouped by the process and only for the first pass.
Yield by Product Family
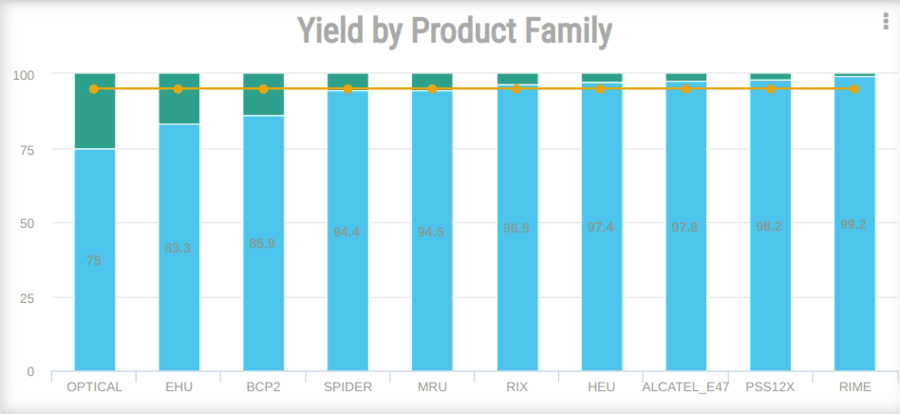
The Yield for the Product Family report displays the % of yield for the filtered Product Family. The report can display further information by selecting a Product Family from the graph.
Figure 31: Yield by Product Family
- Select a Product Family from the report to load the Yield by Product report.
Formulas used for Yield by Product Family
This calculation is based on the Yield for all the units grouped by family. The formula to calculate Yield is:
Yield = ( Passed_Units / Total_Processed_Units ) * 100
This calculation may be filtered by day or by the hour, by day it is calculating the yield from 00:00 to 23:59 of the current day; if the filter is by hour, it is taking the current hour Yield, e.g. if it is 15:35 the calculation will be from 14:35 to 15:35.
Yield by Process
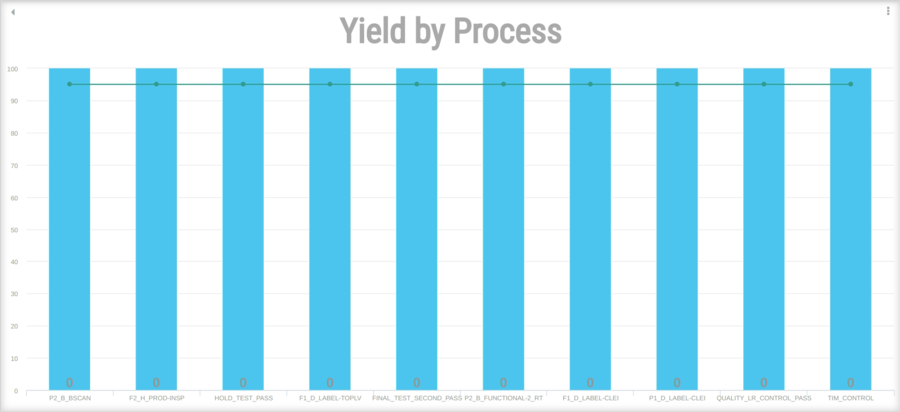
The Yield by Process report displays a graph for the Product selected in the previous level of the report. As with the previous report, the user can filter which data to display and whether to display the Top 10 or Top 5.
Figure 32: Yield by Process
Yield By Product
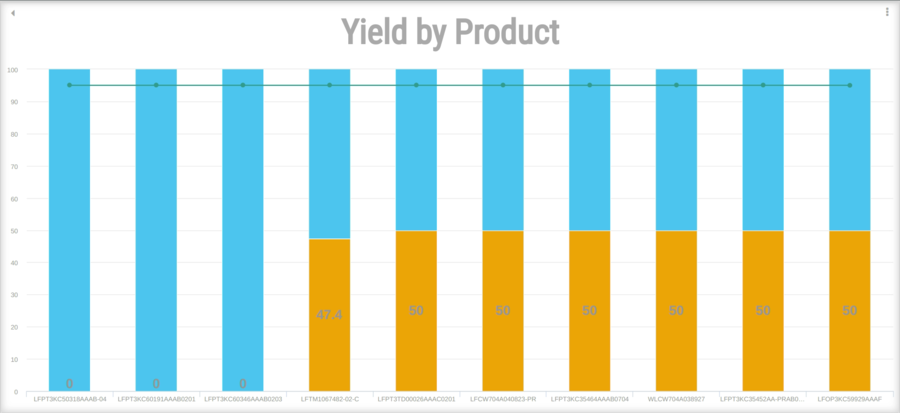
The Yield by Product report displays information about the Top 10 or Top 5 (depending on the selection in the Filter pop-up window) products for the selected Part Family based on yield.
Figure 33: Yield by Product
From here, the user can select the back arrow to return to the Yield by Product Family report.
The user can also filter this report by Top 10 or Top 5 and choose which Products to display (Refer to Figure 12). As with the previous report, the user can also see the Yield by Process for a Product but selecting a Product from the graph.
The formula used for Yield by Product
This calculation is based on the count of units passed to unit status 30 grouped by family, if the filter is selected as “day” it will take from 00:00:00 to 23:59:59.999 from the current day; if the filter is selected as “hour” it is taking the current hour TP, e.g. if it is 15:35 the calculation will be from 14:35 to 15:35.
Throughput
Daily Throughput/ Hourly Throughput
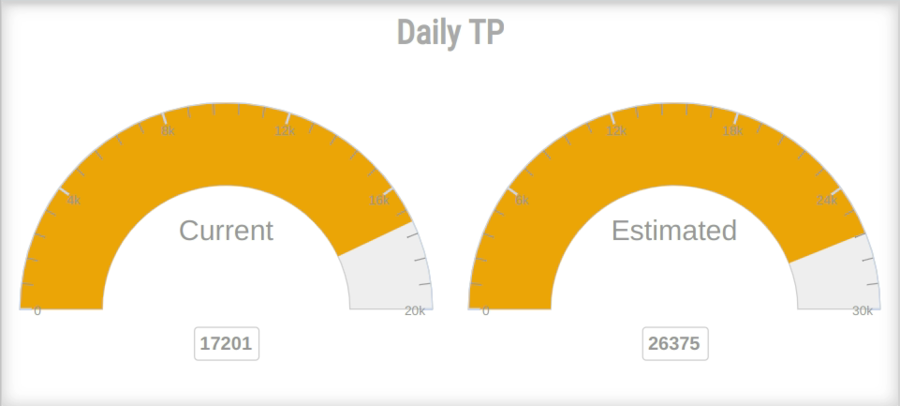
The Daily Throughput report displays the current throughput in the first chart and provides an estimated value to reach by the end of the day on the second chart. The estimated values are based on the current TP/hours worked.
Daily TP: This report is getting the information from “Operation_Dashboard_General_TP_Daily” report. It is getting the throughput from the selected customer from the current day at 00:00 to the current hour, it shows the current throughput and also generates an average of the estimated units which will be completed by the end of the day.
Figure 34: Daily Throughput
Formulas used for Daily Throughput
The “Current TP” calculation is based on the count of units passed to unit status 30 from 00:00:00 to 23:59:59.999 from the current day.
The “Estimated TP” calculation is based on the (Current_Day_TP * 23) / Current_Hour
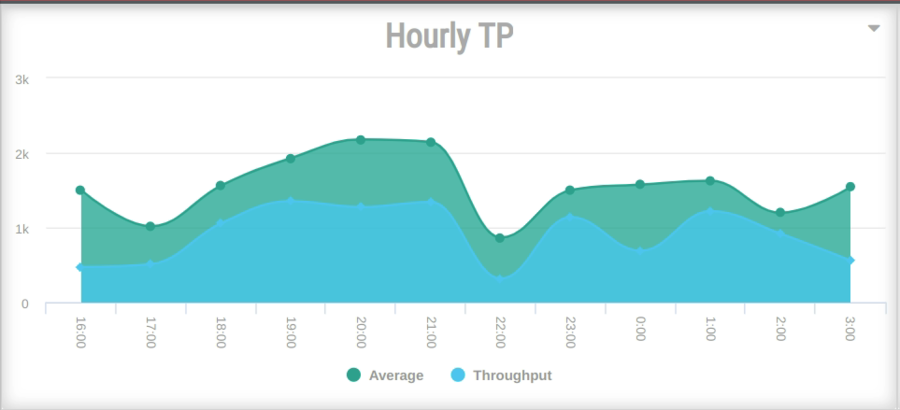
Hourly TP: This report is getting the information from “Operation_Dashboard_General_TP_Hourly” report and shows a chart with two sets of series, one is line series and other is bar series, they are showing the next information.
Users can select whether the report displays data from the last 12 or 24 hours.
Figure 35: Hourly Throughput
Formulas used for Hourly Throughput
The “Current TP” calculation is based on the count of units passed to unit status 30 from 00:00:00 to 23:59:59.999 from the current hour based on 24 hours before the current hour.
The “Average TP” calculation is based on the average of the TP of the previous “n” days for the current hour to 24 hours before the calculated hour by hour:
If the current hour is 16:52, the Current TP will calculate the average TP from 16:00 to 16:59 of the previous “n” days for the first value.
For the second value, it will calculate the average TP from 15:00 to 15:59 of the previous “n” days. And so on until the calculation reaches 24 hours.
Throughput By Line
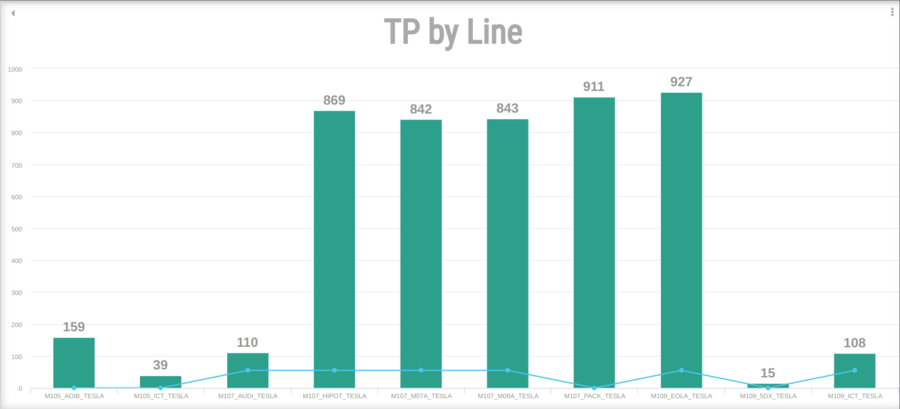
The TP by Line report displays the TP for the Line of the selected Product. As with the previous report, the user can set which products to display and sort them by either the Top 10 or the Top 5 using the 3 dot menu.
Figure 36: TP by Line
To return to the previous report, select the arrow in the top left corner.
Throughput by Product Family
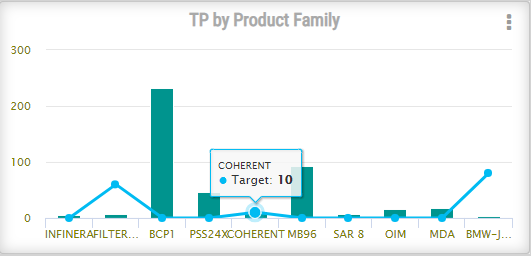
The Throughput by Product Family displays a report for either the Top 10 or Top 5 Product Families (Refer to Filtering Product Family Reports) based on their TP.
- To access the TP by Product Family settings window, select the menu icon on the top right corner of the report.
Figure 37: TP by Product Family
- Select a Product Family from the report to load the TP by Product report.
Formulas used for TP by Product Family
This calculation is based on the count of units passed to unit status 30 grouped by family, if the filter is selected as “day” it will take from 00:00:00 to 23:59:59.999 from the current day; if the filter is selected as “hour” it is taking the current hour TP e.g. if it is 15:35 the calculation will be from 14:35 to 15:35.
Throughput by Product
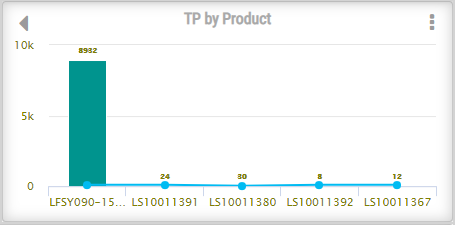
The TP by Product report displays the TP for the Products of the selected Product Family. As with the previous report, the user can set which products to display and sort them by either the Top 10 or the Top 5.
Figure 38: TP by Product
The user can either select the arrow in the top left corner to return to TP by Product Family report or select a Product to load the TP by Line report.
Cycle Time
Cycle Time Widget
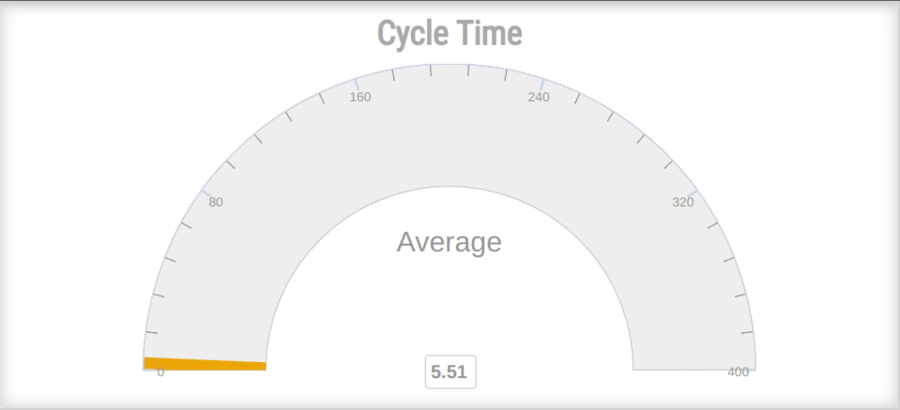
Cycle Time represents the average time to build a single unit on the shop floor. Cycle Time is charted by day or by hour, depending on whether By Day or By Hour is chosen in the Dashboard configuration menu.
This report is defined as the total time from the beginning to the end of the process of a unit. (status 20 to 30) This report shows the general average cycle time for the selected customer in hours.
Figure 39: Cycle Time
Formulas used for Cycle Time
The cycle time calculation is based on the average of the time it took for every unit to be completed, it is calculated using the following formula:
Cycle_Time = Average ( complete_ts - create_ts )
Where “ts” refers to “timestamp”.
Cycle Time by Product Family
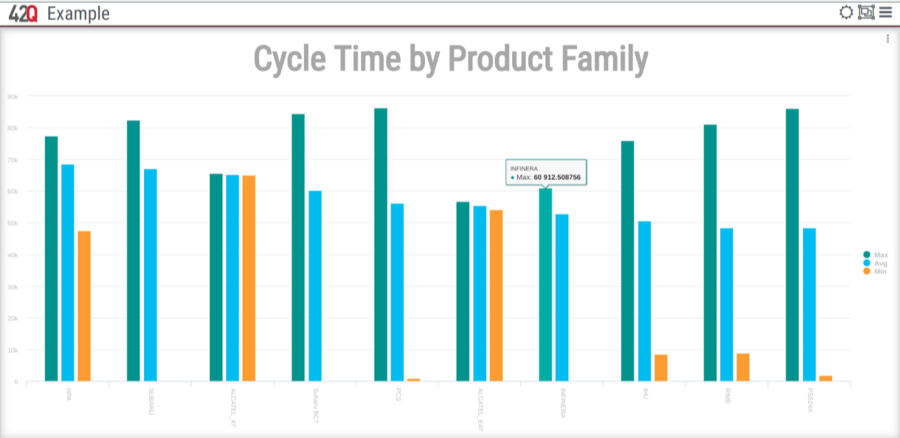
The Cycle Time by Product Family report displays the amount of time used to build a product, including the minimum and maximum values during the same period. As with previous Product Family reports, the user can select which Product Families to include in the report and sort them by either the Top 10 or the Top 5 based on their cycle times.
Figure 40: Cycle Time by Product Family
Access the Cycle Time by Product report by selecting a Product Family from the report.
Formulas used for Cycle Time by Product Family
The cycle time calculation is based on the average time it took for every unit to be completed grouped by family, it is calculated using the following formula:
Cycle_Time = Average ( complete_ts - create_ts )
Where “ts” refers to “timestamp”.
If the filter is selected as “day” it will take from 00:00:00 to 23:59:59.999 from the current day; if the filter is selected as “hour” it is taking the average time of completed units for the previous hour e.g. if it is 15:35 the calculation will be from 14:35 to 15:35.
Top Cycle Time Product
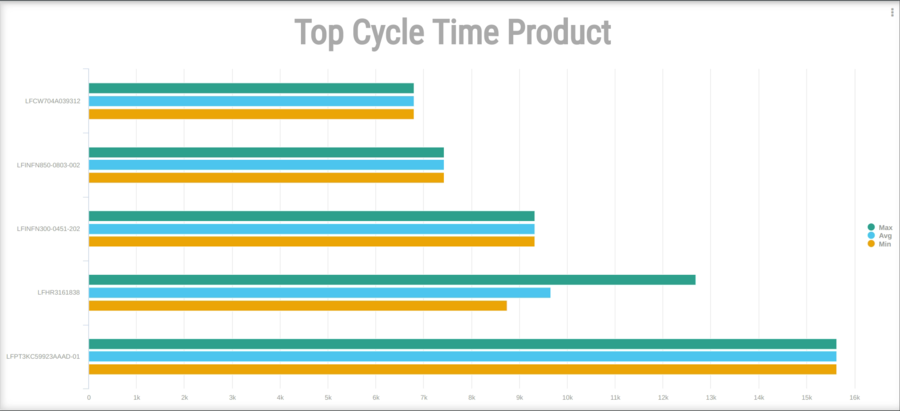
This report displays the top five products that took the longest time to build based on the average time to build the same product in the last hour or day. The Top Cycle Time Product report also displays the product’s minimum and maximum values. As with other Top reports, users may select which items to view by marking the appropriate checkmark in the Display column of the Report’s pop up menu.
Figure 41: Top Cycle Time Product
Formulas used for Top Cycle Time Product
The cycle time calculation is based on the average of the time it took for every unit to be completed grouped by product, it is calculated using the following formula:
Cycle_Time = Average ( complete_ts - create_ts )
Where “ts” refers to “timestamp”.
Cycle Time by Line
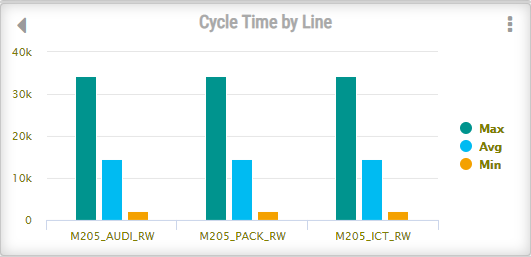
The Cycle Time by Line report displays the Cycle Time for the Line of the selected Product. As with the previous report, the user can set which products to display and sort them by either the Top 10 or the Top 5.
Figure 42: Cycle Time by Line
To return to the previous report, select the arrow in the top left corner.
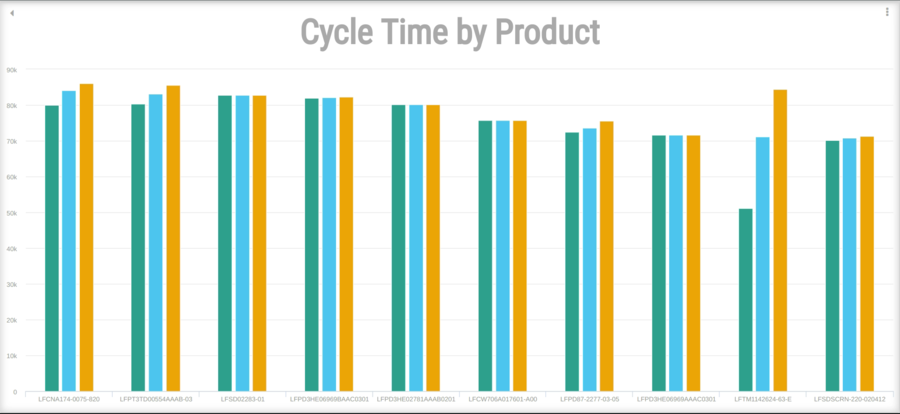
Cycle Time by Product
The Cycle Time by Product report displays the Cycle Time for the Products of the selected Product Family. As with the previous report, the user can set which products to display and sort them by either the Top 10 or the Top 5 with the 3 dot menu.
Figure 43: Cycle Time by Product
Output Reports
The Dashboard includes two Output reports: Output by Progress and Output by Family. Below are listed rules that apply to each.
Output by Process
Figure 44: Output by Process
- The report will consider only Pass 1
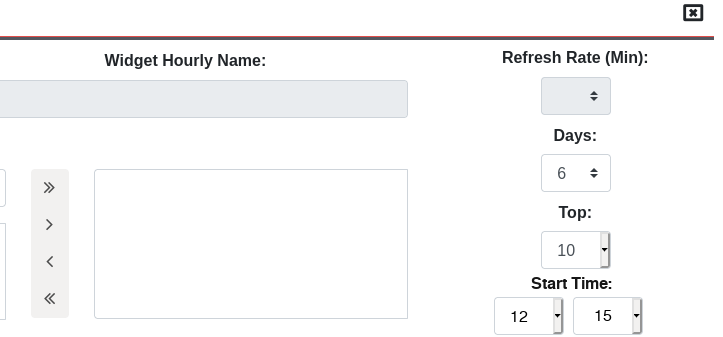
- Output by a period of 24 hrs, starting from a user defined start time in the widget, hours, and minutes in a dropdown selection list. It will be configurable by the widget dashboard and ONLY available to this widget.
Figure 45: Widget Hourly
Note: Maximum of 10 families (order by alphabet).
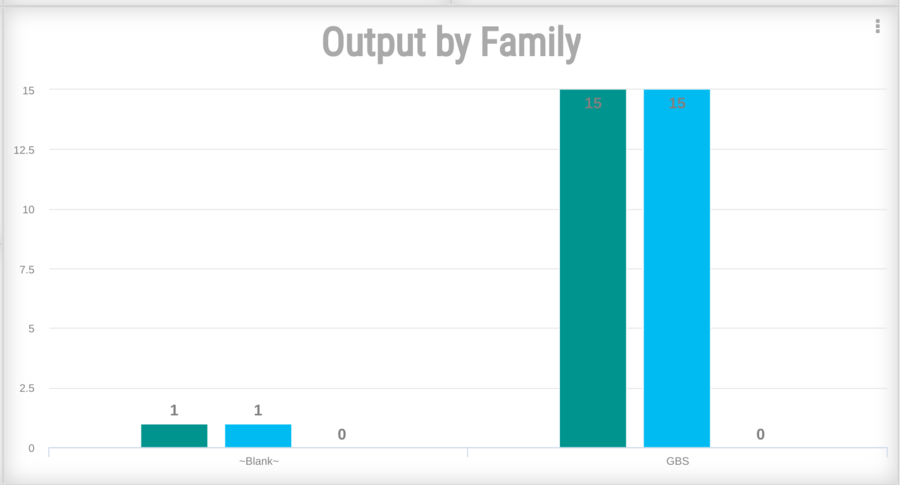
Output by Family
Figure 46: Output by Family
- The report will consider only Pass 1
- Output by a period of 24 hrs, starting from a user defined start time in the widget, hours, and minutes in a dropdown selection list. It will be configurable by the widget dashboard and ONLY available to this widget.
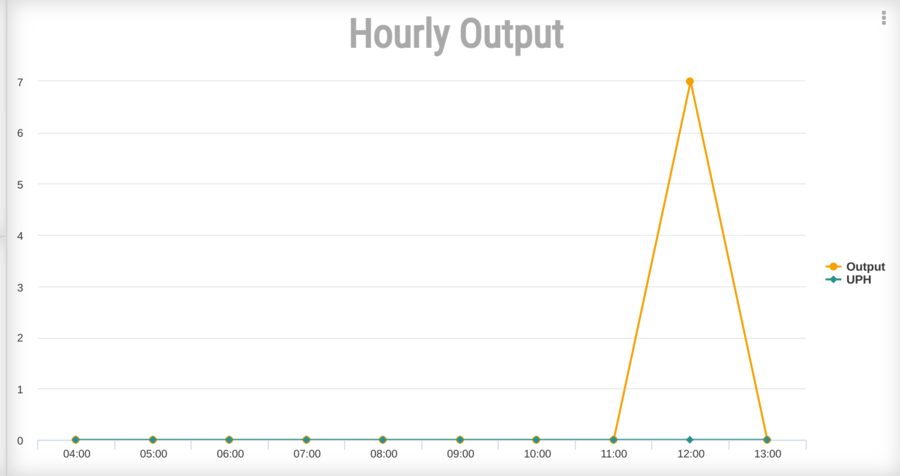
Hourly by Output / Yield
- These reports reflect the hourly Output and Yield of the selected Mfg Lines and Processes in the past 12 hours.
- The report will consider only Pass 1
- The report by Hour (last 12 hours)
- The“Target” value should be the average of the involved Part Number and Process and Mfg Line.
- The“UPH” value is the sum of the involved Part Number and Process and Mfg Line.
Figure 47: Hourly Output
Figure 48: Hourly Yield
Product Family Reports
The Dashboard has 3 reports with data based on Product Families: Yield by Product Family, TP by Product Family, and Cycle Time by Product Family. These reports can be filtered to display a graph for a particular Product Family, Product, and Process/Line.
Filtering Product Family Reports
In each level of a Product Family report, the user is able to select which information to display, and whether to sort it by the Top 10 or the Top 5.
To filter a report:
- Select the vertical three-dot menu in the top right corner of the report.
A list of Product Families, Products, or Processes displays depending on what is to be filtered.
Figure 49: Filtering Menu
- Select the radio button for either Top 10 or Top 5 to sort the list.
- Close the window to remove the window.
Work in Progress Reports (WIP)
The Dashboard includes three of the Work in Progress (WIP) reports: WIP by Project, WIP by Process, WIP by Family. Listed below are the rules that apply to each.
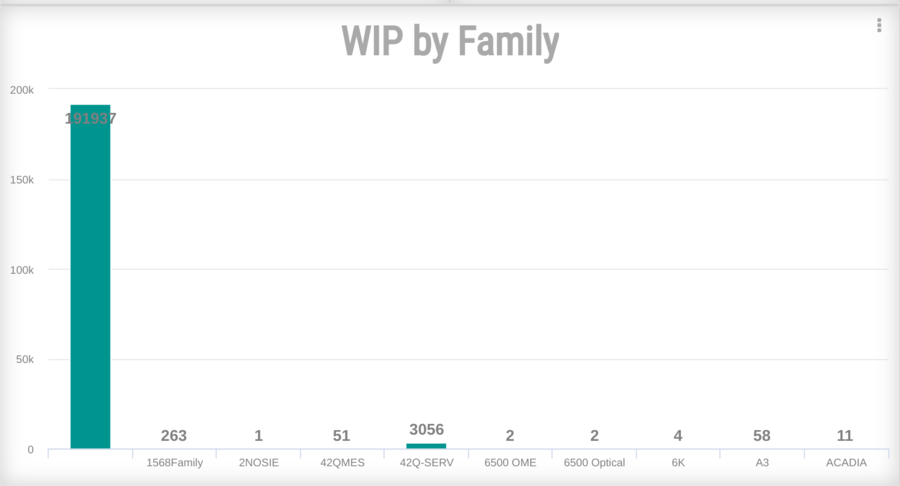
WIP by Family
Figure 50: WIP by Family
- “Quantity” = Count of Serial Number by each family name.
- Maximum of 10 families (order by alphabet)
- Consider all SN in WIP
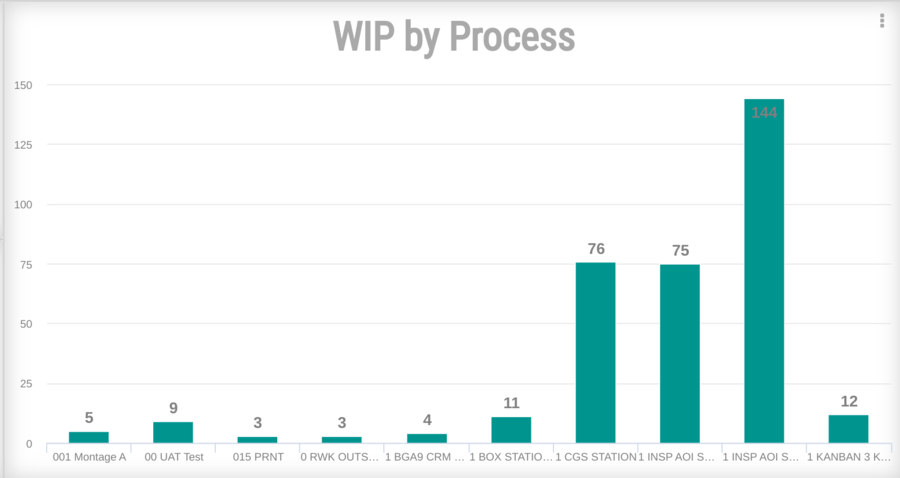
WIP by Process
Figure 51: WIP by Process
- “Quantity” = Count of Serial Number by each process name.
- Maximum of 10 processes(order by alphabet)
- Consider all SN in WIP
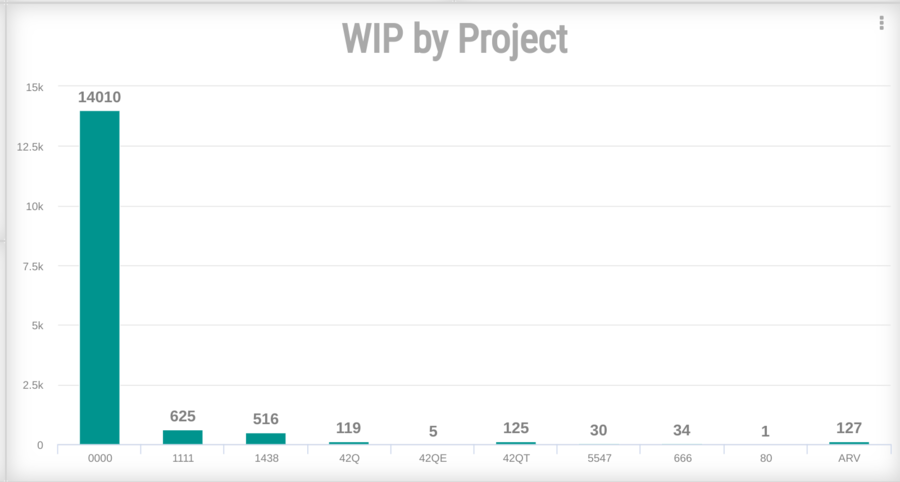
WIP by Project
Figure 52: WIP by Project
- “Quantity” = Count of Serial Number by individual project code.
- Maximum of 10 projects(order by alphabet).
- Consider all SN in WIP.
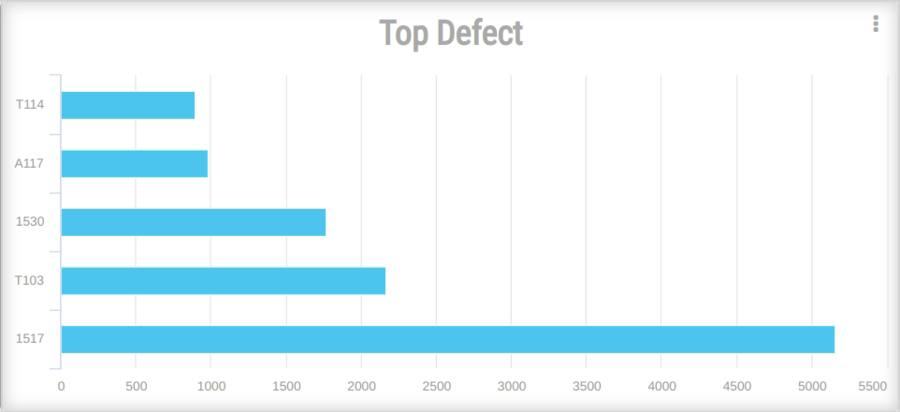
Top Defect
This chart represents the 5 most common defects in the last hour or day, depending on the mode selected. Users may select which defects display by selecting the check mark in the display column of the pop-up menu.
Figure 53: Top Defect
Formulas used for Top Defect
This calculation is showing the more repetitive defects recorded at the plant. The value is calculated by counting the number of defects recorded and grouped by name.
If the filter is selected as “day” it will take from 00:00:00 to 23:59:59.999 from the current day; if the filter is selected as “hour” it is taking the number of defects for the previous hour e.g. if it is 15:35 the calculation will be from 14:35 to 15:35.
Shop Order Reports
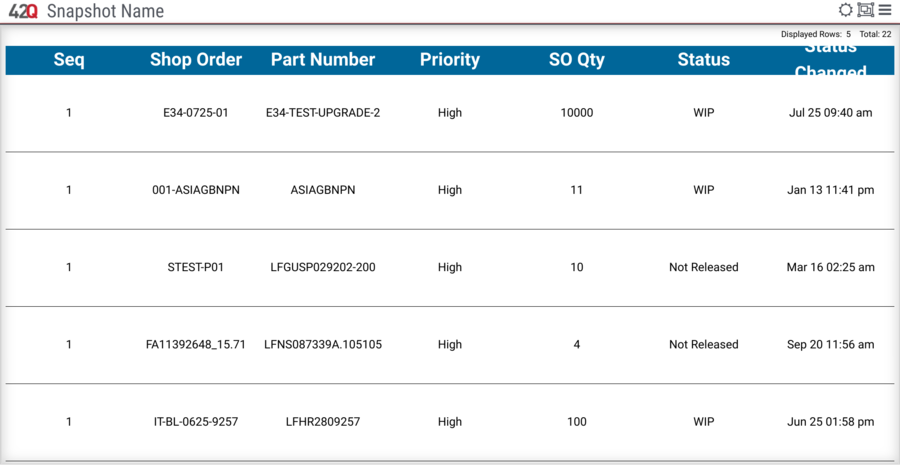
The addition of Shop Order reports provides a monitor (dashboard) to display the current prioritized Shop Orders in 42Q by Line. The shop orders are displayed by sequence number in ascending order.
Use the Configuration Menu to set up the Widget Configuration and the Global Configuration. Global Configurations are applied to the entire dashboard, whereas Widgets Configurations are applied to individual widgets.
Figure 54: Report displayed
This report provides the SO Sequence, Shop Order Number, Part Number, the Priority, Shop Order Qty, and the current status of each Shop Order in the list:
- Not Released
- Released
- WIP
- ON HOLD
- Complete
Display time of status change at any time a shop order status is updated. Ex. From Released to WIP.
Note: When a Shop Order is completed, the sequence list is updated and the completed shop orders remain in the list and the next highest priority Shop Order is moved to line 1.
CMMS
Top 5 Problems Widget
Top 5 Problems is available as a separate widget. There is no option to drill down for more details included with this widget.
Additional configuration options are also available in the Top 5 Problems Reports.
Top 5 Problems - Daily Mode Report
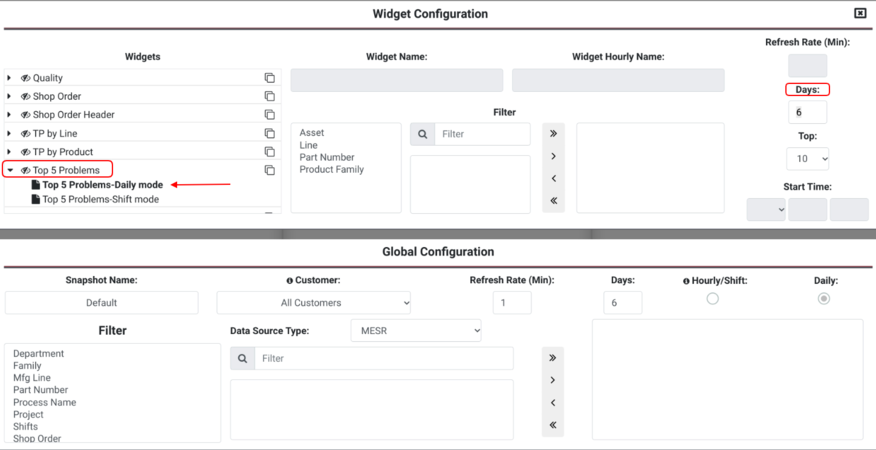
Users can define the Top 5 Problems Report to display data by choosing the days.
- Select the Report.
- Select day (default value is 6 days).
Note: Users cannot select less than 6 days of data for this report. If less than 6 days is desired, select the Top 5 Problems-Shift Mode.
Figure 55: Top 5 Problems Report: Select Days
Note: Users have the option to allow more than one asset to be chosen within the filter field.
Top 5 or 10 Problems - Daily Mode/Shift Mode Reports
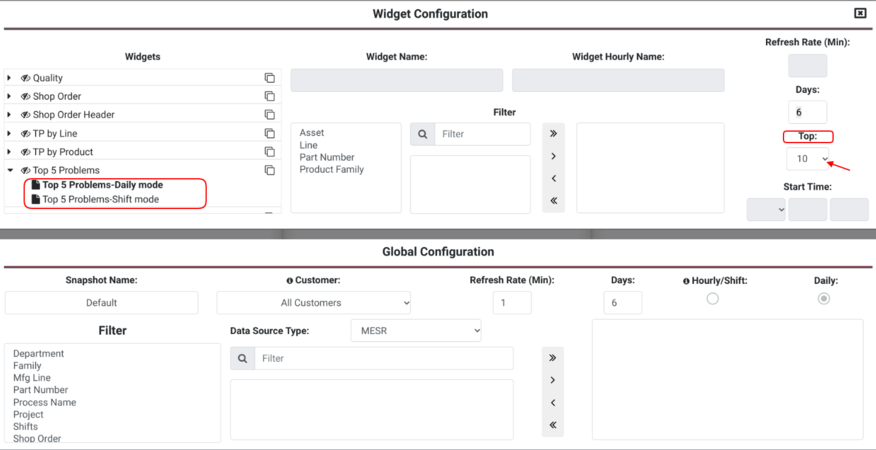
- Users can change the number of problems to display from 5 - 10 in both individual Top 5 Problem Reports.
- The Days option is not available in the Top 5 Problems-Shift Mode.
Figure 56: Select 5 or 10 Problems
Top 5 Repairs Widget
The top 5 Repairs Report is available in a separate widget. There is no option to drill down for more details included with this widget. Additional configuration options are also available in the Top 5 Problems Reports.
Top 5 Repairs- Daily Mode Report
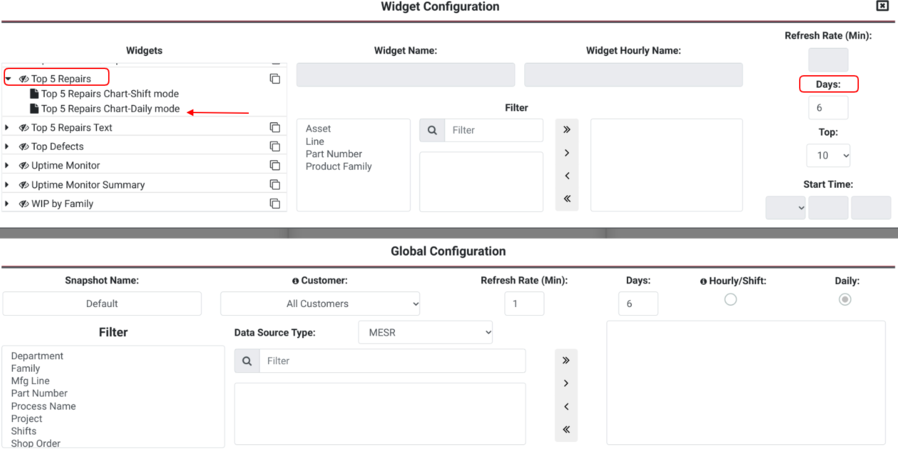
Users can define the Top 5 Repairs Report to display data from 1 week - 2 weeks.
- Select the Report.
- Select 6 days - 14 days (default value is 6 days).
Note: Users cannot select less than 6 days of data for this report. If less than 6 days is desired, select the Top 5 Problems-Shift Mode.
Figure 57: Top 5 Repairs Report: Select Days
Top 5 or 10 Repairs - Daily Mode/Shift Mode Reports
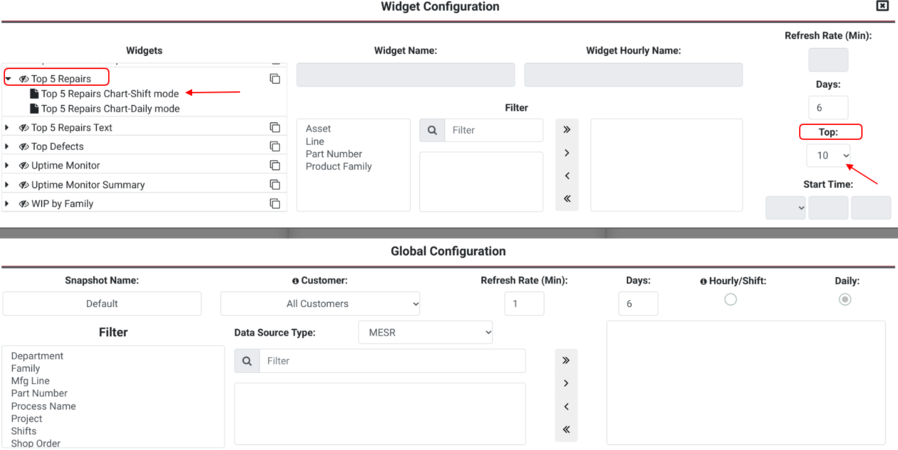
- Users can change the number of problems to display from 5 - 10 in both individual Top 5 Repair Reports.
- The Days option is not available in the Top 5 Repairs-Shift Mode.
Figure 58: Select 5 or 10 Repairs
Top 5 Problems/Repairs Widget
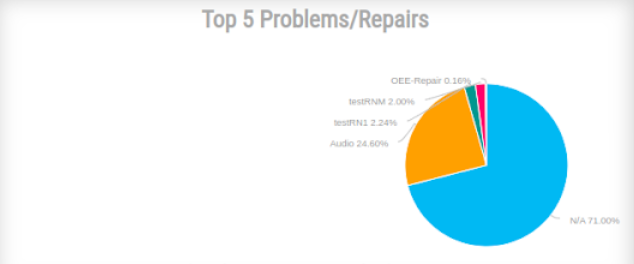
This widget contains two (2) reports. Each report can be filtered to display values per Asset, Line, or All (entire database).
Figure 59: Top 5 Problems/Repairs Widget
- Top 5 Problems Report: Displays the top 5 problems for a specific Asset, Line, or entire plant (All).
- Top 5 Repairs Report: Displays the top 5 repair codes for a specific Asset, Line, or entire plant (All)
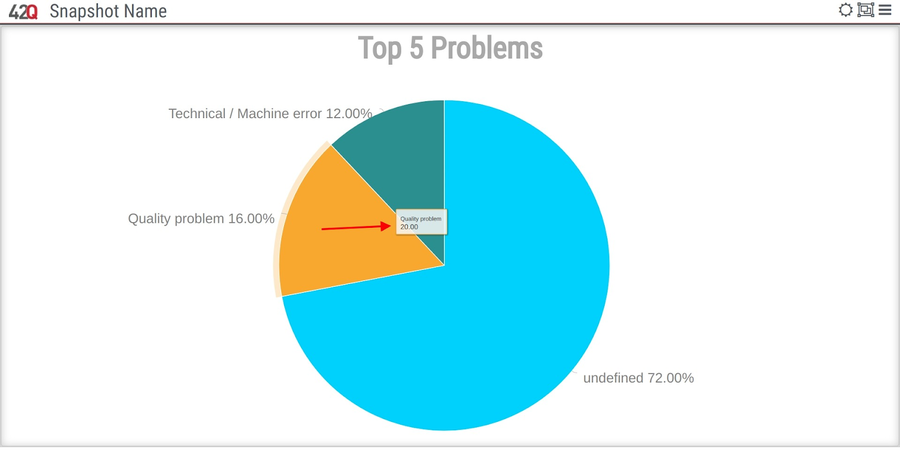
- Users may view the exact number of problems that occurred in each Problem Type by hovering over the individual sections of the pie chart.
- There is no option to drill down for more report details included with this widget.
Figure 60: View the Number of Problems by Hovering
- Both reports are also available as separate widgets (see below).
OEE
Availability, Performance & Quality
All three of the OEE variables are displayed together in the Availability, Performance, and Quality Widget.
There is no option to drill down to a more detailed report included with this widget.
Figure 61: Availability, Performance & Quality
Downtime Trend
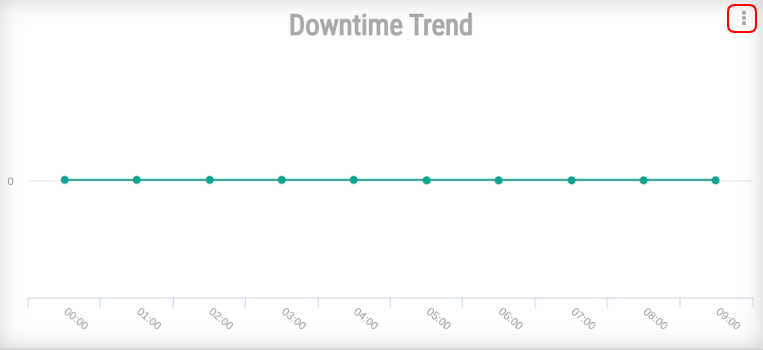
The Downtime Trend Widget contains one (1) report. This report represents the number of downtimes incurred by an asset or line during the past 12 or 24 hours.
Figure 62: Downtime Trend
Set Downtime Trends by Hour
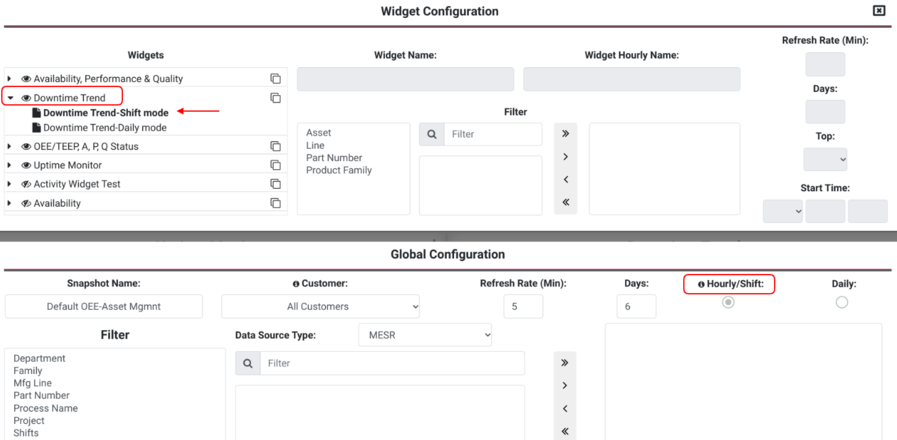
- Select the Downtime Trend Shift Mode report in the Widget Configuration screen
- Select Hourly in the Global Configuration screen (see figure, below).
![]() Important Reminder: When the global configuration has the option Daily selected, the system displays data from the current day (00:00 - Current Time). When Hourly is selected, the system displays data from the last shift.
Important Reminder: When the global configuration has the option Daily selected, the system displays data from the current day (00:00 - Current Time). When Hourly is selected, the system displays data from the last shift.
Figure 63: Select Shift and Hourly
- Once configured, return to the Snapshot layout screen and select 12 or 24 hours from the drop-down menu on the top right-hand corner of the screen. (see figure, below).
Set Downtime Trends by Day
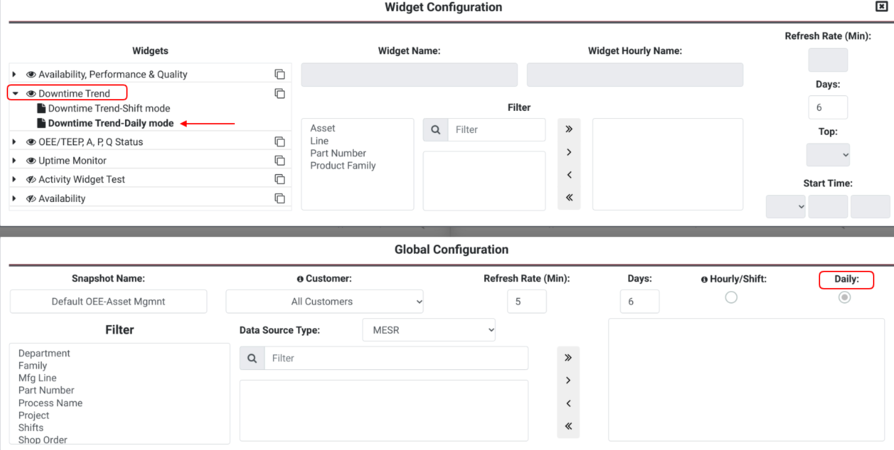
- Select the Downtime Trend Daily Mode report in the Widget Configuration screen.
- Select Daily in the Global Configuration screen.
- The 12/24 hour selection is not available for this configuration.
![]() Important Reminder: When the global configuration has the option Daily selected, the system displays data from the current day (00:00 - Current Time). When Hourly is selected, the system displays data from the last shift.
Important Reminder: When the global configuration has the option Daily selected, the system displays data from the current day (00:00 - Current Time). When Hourly is selected, the system displays data from the last shift.
Figure 64: Configure Downtime Trend by Day
View Complete Uptime Report
Both Up and Downtime Trend Report users working from a desktop pc or tablet can view more details about the Uptime report by selecting the additional options icon on the top right of the screen.
The figure below shows the complete report that corresponds to the data in the Daily Uptime Report pictured above.
Figure 65: More Details: Daily Uptime Report
OEE/TEEP, A, P, Q Status
The OEE/TEEP, A, P, Q Status widget provides a comprehensive overview of all OEE/TEEP metrics. Although Availability, Productivity, and Quality can also be viewed individually (see Individual Widgets for A, P, Q), this widget 42Q displays OEE and TEEP together.
See OEE Configuration User Manual for a full explanation of how OEE/TEEP metrics are calculated.
Figure 66: OEE/TEEP, A, P, Q Status Widget
This widget contains the three (3) KPIs that are used to calculate OEE in addition to TEEP:
- OEE: Displays Overall Equipment Effectiveness values for specific Asset, Line, or Entire Plant (All).
- TEEP: Displays Total Effective Equipment Performance values for specific Asset, Line, or Entire Plant (All).
- A, P, Q: Displays Availability, Performance, and Quality values for a specific Asset, Line, or Entire Plant (All). The A, P, and Q report displays data in a bar chart format.
Uptime Monitor
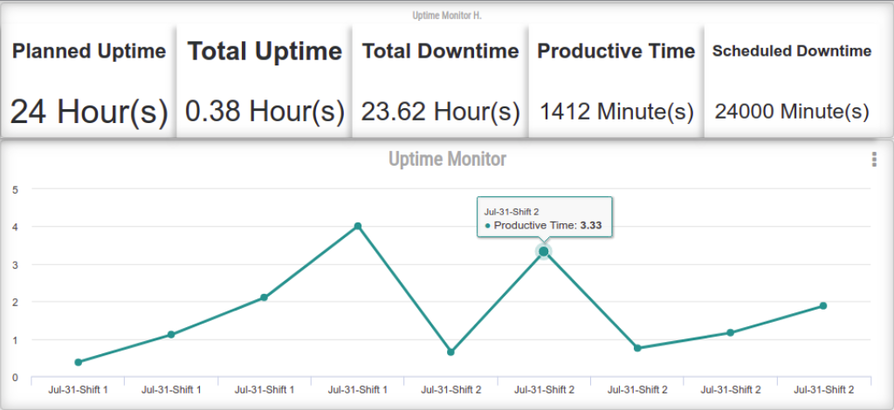
The Uptime Monitor Report shows planned vs. actual uptime (hours) for a given asset or line during a 12 or 24-hour time period.
Figure 67: Uptime Widgets Report
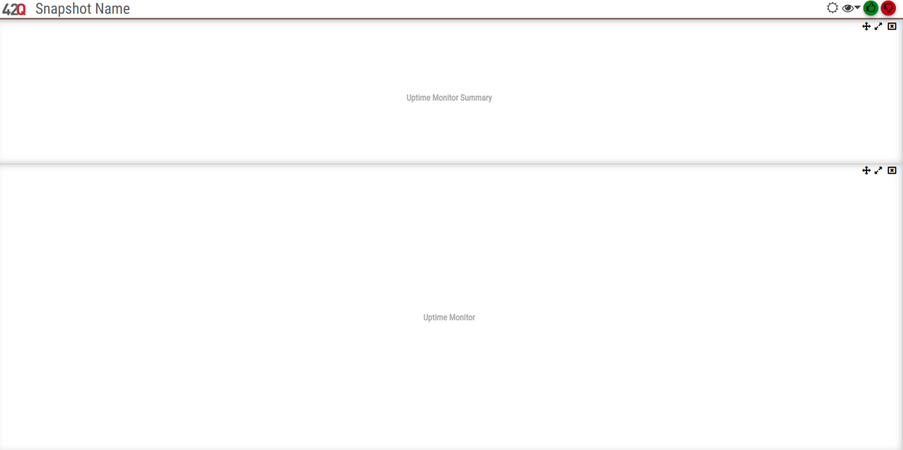
The Uptime Monitor Report is created by combining the Uptime Monitor Summary widget (top portion) with the Uptime Monitor widget (bottom portion). In this way, users are able to view machine uptimes in two ways: as a simple chart (Uptime Monitor Summary), and as a graphic expression (Uptime Monitor).
Figure 68: Uptime Monitor combined
Uptime Monitor Summary
Monitor Summary Widget + Uptime Monitor Widget in Snapshot Layout
To combine the two uptime widgets, add the Uptime Monitor Summary widget as a header in the Snapshot Layout, and the Uptime Monitor Widget beneath it, as shown in the figure below. Figure 13: Snapshot Layout for Combined Uptime Widgets
Figure 69: Snapshot Layout for Combined Uptime Widgets
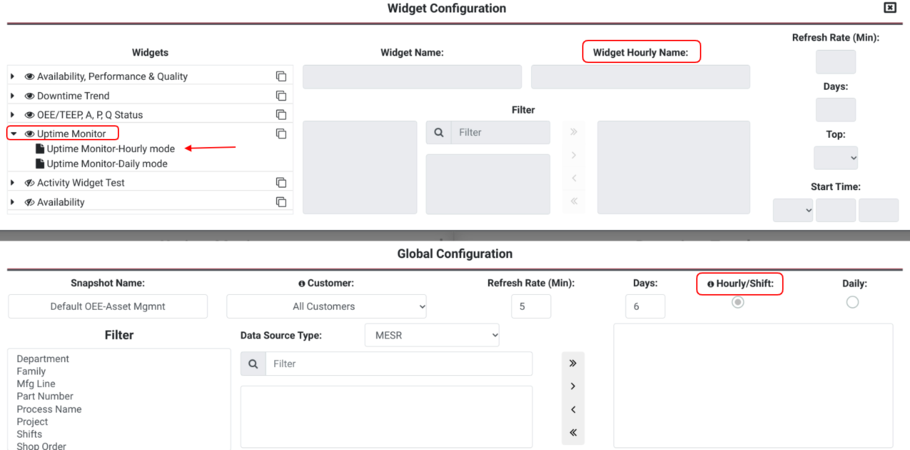
Configure Uptime Widgets by Hour
- Select Uptime Monitor Summary - Hourly mode Report (see figure, below).
- Select Uptime Monitor - Hour mode Report (see figure, below).
- Select Hourly/Shift from the Global Configuration screen (see figure, below).
![]() Important Reminder: When the global configuration has the option Daily selected, the system displays data from the current day (00:00 - Current Time). When Hourly is selected, the system displays data from the last shift.
Important Reminder: When the global configuration has the option Daily selected, the system displays data from the current day (00:00 - Current Time). When Hourly is selected, the system displays data from the last shift.
Figure 70: Uptime Widget Configuration by Hour
- Return to the Snapshot edit page and select 12 or 24 hours from the drop-down that is now available.
Note: Unlike the Downtime Trend Report, users must select an hourly time period (12 or 24 hours) for hourly Uptime widget reports.
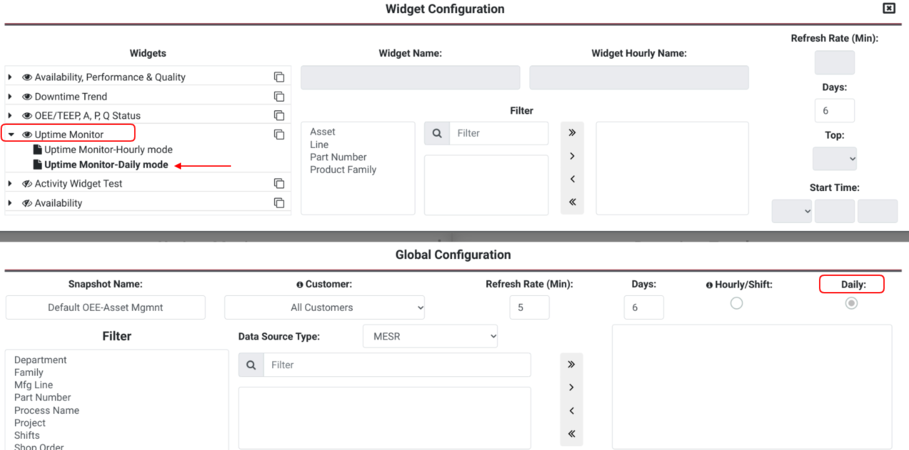
Configure Uptime Widgets by Day
- Select Uptime Monitor Summary - Daily mode Report (see figure, below).
- Select Uptime Monitor - Daily mode Report (see figure, below).
- Select Daily from the Global Configuration screen. (see figure, below).
![]() Important Reminder: When the global configuration has the option Daily selected, the system displays data from the current day (00:00 - Current Time). When Hourly is selected, the system displays data from the last shift.
Important Reminder: When the global configuration has the option Daily selected, the system displays data from the current day (00:00 - Current Time). When Hourly is selected, the system displays data from the last shift.
Figure 71: Configure Uptime Widgets by Day
