How To Create Sisense Boards
Contents
Summary
Sisense Dashboards are developed as visual representations of data to tell a story. These dashboards are tailored to simplify complex data in easy-to-understand ways so that users can easily interpret vital information, as well as discover patterns, trends, and anomalies that are occurring in the business.
By definition, Sisense is an agile business intelligence solution that provides users with advanced tools to support and manage information for company data with analytics, visuals, and reporting.
This tool is the most effective and efficient tool to use to provide informative data modeling.
Figure 1: Sisense
Best Practices for Creating Dashboards
When designing a user dashboard, following these best practices will allow for the best experience and data modeling:
- User dashboards should provide relevant information in about 5 seconds.
- Display the most significant insights at the top of the dashboard,trends in the middle, and granular details at the bottom.
- Keep at a minimum of between 5 to 9 visualizations.
- Select the appropriate type of data visualization according to its purpose.
- Avoid Wide/Long pivot tables.
Features of the Sisense Dashboard
Upon accessing the Sisense Dashboard, the user's first view will be viewed as the Dashboard.
On the left side of the screen, a list of folders and dashboards are displayed for users to choose from. In the middle of the screen, the dashboard is displayed that provides analytical information set by the users. On the right side of the screen, filters are provided to allow users to alter the information given or shown on the dashboard.
How to Create a Sisense Dashboard
Within creating a new dashboard, users will have the ability to create widgets from scratch. After importing data into Sisense, the next step is to create a dashboard that viewers can interact with. Dashboard designers can create dashboards from the Analytics page where existing dashboards are displayed or users have the choice to conduct their own dashboard using the “Create” option.
Below is a list of directions to support users in conducting new dashboards:
- Navigate to the Sisense Platform by following the provided link,https://production-bi-nala.42-q.com/.
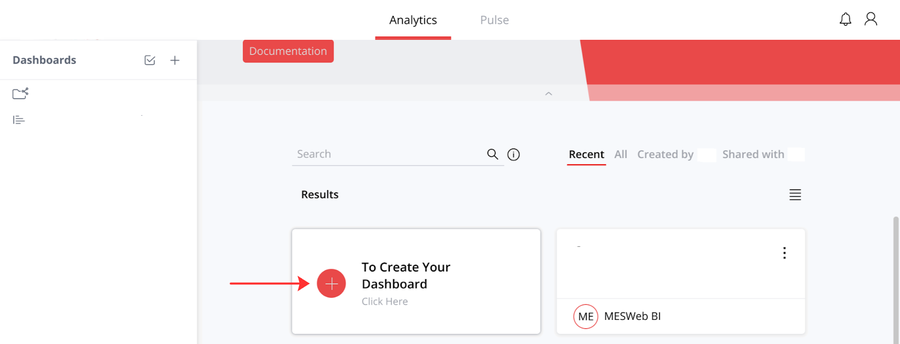
- Click on the red plus sign provided “To Create Your Dashboard”.
Figure 2: Create a Dashboard
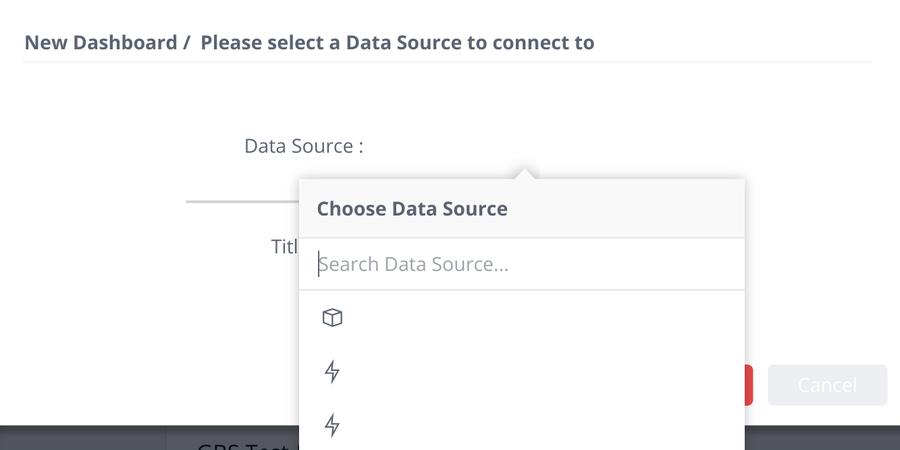
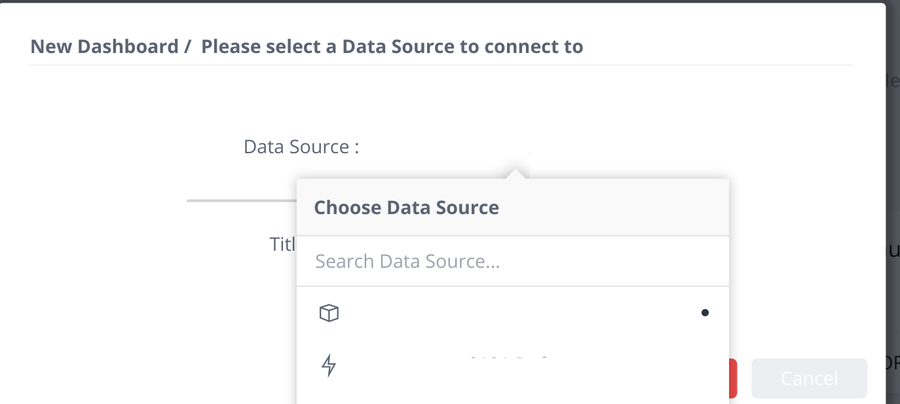
- Choose a Data Source
Figure 3: Choose a Data Source
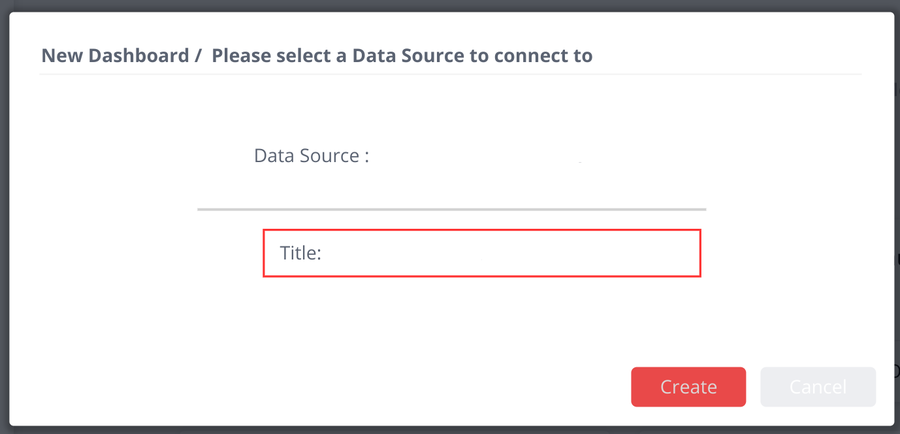
- Set a Title
Figure 4: Data Source Title
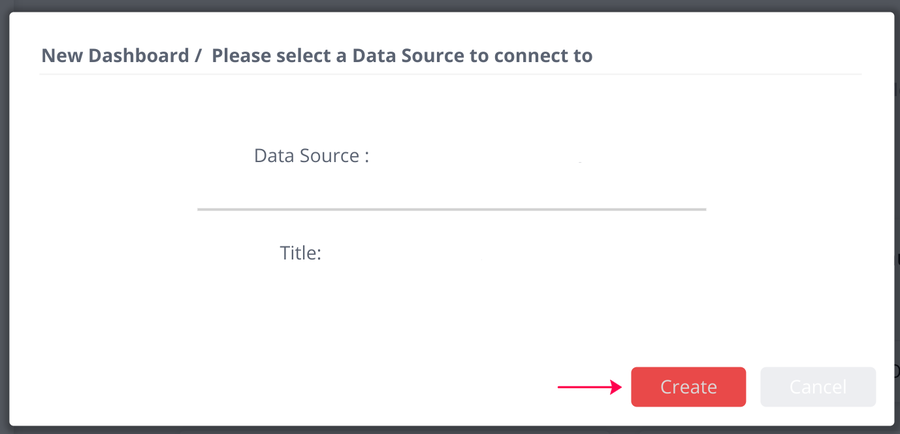
- Click Create
Figure 5: Dashboard Created
To Create a Dashboard as an existing user:
- Navigate to the Sisense Platform by following the provided link, https://production-bi-nala.42-q.com/.
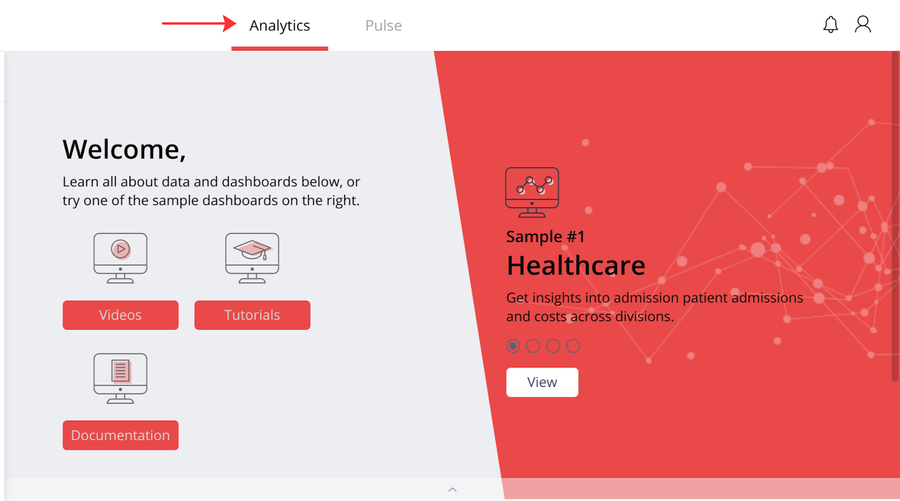
- Click on the provided button labeled as“Analytics” at the top of the screen.
Figure 6: Create a new Dashboard with an existing user
- Choose the corresponding plant name and the title desired
Figure 7: Input Data Source and Location
Once the dashboard is created, the dashboard will be presented empty so the following steps would be to add widgets or visualizations to the dashboard that are not only meaningful but useful.
Importance of the Widgets
Sisense Dashboard is a dashboard made up of widgets, or single units that are representations of one data category.
The first question that should be considered when choosing the right widgets to use within your dashboard is “Who is the main audience for this dashboard?”.
The end goal of creating a dashboard is to create one that supports a given specific user and provides the best possible understanding of the data by using the right widget(s).
How to Add Widgets to a Dashboard
The Widget Wizard is very efficient in guiding users through a simple process of creating widgets, while also offering the best possible recommendations for displaying the data effectively.
Accepting the widgets recommendations will assist in creating the best possible widget, however, users definitely have the option to have total control over the widget’s behavior and appearance by clicking on the Advanced Configuration option in the bottom left of the wizard.
To add a widget to the dashboard, follow the following steps provided :
- For first time widgets, click the + Select Data button. For existing widgets that are already in the user dashboard, click the + Widget button.
Figure 8: Add Widgets to the Dashboard
- Users have the option toadd a title to their widget now or after creating the widget.
- In the Data Browser,select a field to add to the widget.
- The field that is selected is automatically displayed in a suggested widget.
Figure 9: Add a Fields
For more information on creating, adding, or managing widgets, please refer to the Sisense Widgets documentation
How To Create Live Data Models
A Data Model refers to the way data is imported, stored, and accessed to support data analysis, including creating reports, dashboards, and infusing analytics into your applications. When conducting Live Models, a query will be run against the data source. This feature will allow users to view real-time data updates within the dashboard.
To create dashboards built on live connections to a data source, follow the steps provided below :
- Open Sisense and click Data in the top menu.
Figure 10: Data Models Menu
- Click the + Live button
- Within the Title box, enter in a name for the Live Model and an empt model will then be displayed in the Model Editor.
For more information about creating live models, see the documetation on Creating Live Models
