How to create and see SPC Dashboards
Contents
Summary
This How-to document will help you to know how to create, edit, or delete a dashboard, and to know where and what information you can see on the dashboards that were previously added. The SPC Dashboards provide important data and help users to:
- Reduce maintenance workload
- Simplify the configuration steps
- Display quickly important information about the last several hours into clear charts
Add, Edit, or Delete SPC Dashboards
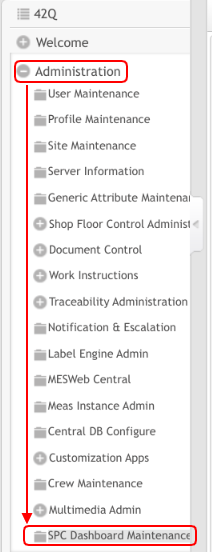
To execute any of these actions, navigate to Administration > SPC Dashboard Maintenance.
Figure 1: SPC Dashboard at the Administration Menu
Add an SPC Dashboard
- Select the (Add) button at the left top of the screen. The Add New SPC Dashboard window will be displayed to input the required information.
- Write a Name for the dashboard.
- Input a Title.
- Select a Monitor Group from the drop-down list.
- Define the maximum Number of Points to be displayed in one chart.
- Define the Time Frame of Pareto (Hours) in which will be displayed the data in a Monitor Group.
- Define how often the monitors will be updated at Refresh Rate (Seconds).
- Choose between black or white Theme.
- Select Save to proceed or Cancel to quit.
Once the new SPC Dashboard has been added, it will appear in the list, where it can be opened by selecting the (GO) button at the end of the row.
Note: Before the creation of a new dashboard, the monitor where it will belong must be configured at the SPC module. To know more information about this setup, please refer to the Statistical Process Control SOP.
Figure 2: Add New SPC Dashboard Button and Window
Edit an SPC Dashboard
- Select a dashboard by checking its box.
- Select the (Edit) button at the left top of the screen. The Edit New SPC Dashboard window will be displayed.
- Modify any information of the fields.
- Select Save to proceed or Cancel to quit.
Figure 3: Edit SPC Dashboard Button and Window
Delete an SPC Dashboard
- Select a dashboard by checking its box.
- Select the (Delete) button at the left top of the screen. A confirmation message will be displayed asking if you want to proceed.
- Select Yes to complete deletion or No to quit.
Figure 4: Delete Button and Confirmation Message
See SPC Dashboards
- To see an SPC Dashboard navigate to Quality > SPC Dashboard.
- Select any dashboard by checking its box.
- Then, select the (GO) button to display the dashboard in a new window.
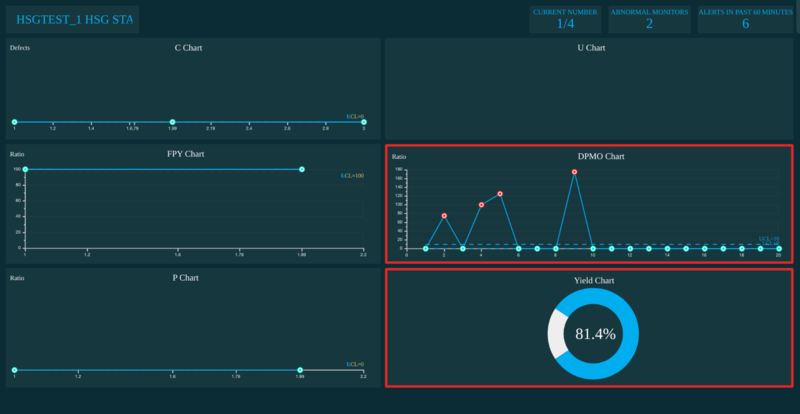
To read the information shown at an SPC Dashboard, follow this guide:
- CURRENT NUMBER: Refers to the number of active monitors at the Monitor Group where is displayed the latest data that has been updated over several hours.
- ABNORMAL MONITORS: Refers to the number of monitors at this Monitor Group that have data out of control.
- ALERTS IN PAST 60 MINUTES: Refers to the number of alert emails sent by the SPC application for this group to the end-user.
Note: If all the monitors have no data at the SPC Dashboard, the system will refresh every 2 minutes.
Figure 5: SPC Dashboard
Edit SPC Dashboard Configuration
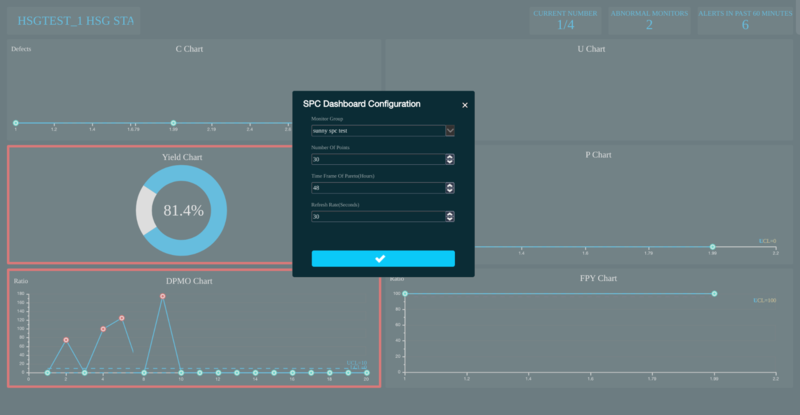
- To edit any field from the SPC Dashboard Configuration, select the tab that appears by locating the cursor at the right top of the screen to display the corresponding pop-up.
- Modify the information in the fields as needed.
- Select the checkmark button to save or the cross mark to close the pop-up.
Figure 6: SPC Dashboard Configuration
Hide SPC Dashboards of monitors with no data
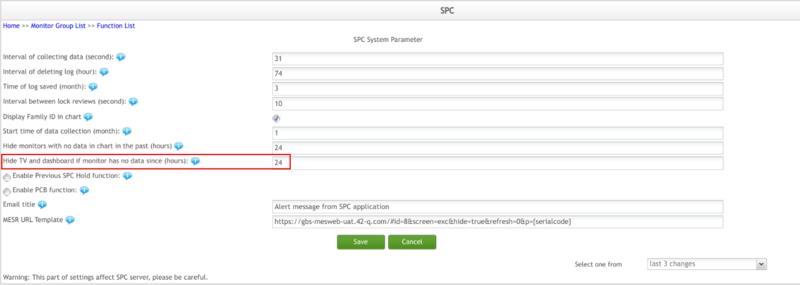
Users can define how many hours should pass before an SPC Dashboard will be hidden if the monitors where it belongs have no data. To configure this:
- Enter to Quality > SPC to choose and open a Monitor Group.
- Select the SPC Parameter Maintenance button.
- Define the number of hours (1-24) of the Hide on TV and dashboard if monitors with no data in a chart in the past (hours) field.
- Select Save to proceed or Cancel to quit.
The SPC system will automatically hide those SPC Dashboards whose monitors have no new data during the past settable hours.
Figure 7: Monitor Group List
Figure 8: Function List of a Monitor Group
Figure 9: SPC System Parameter


