How to use 42Q MES OEE module
Contents
- 1 Problem Statements
- 2 Configuration Order Diagram
- 3 Configuration and Prerequisites
- 3.1 Adding a Problem Category
- 3.2 Adding a Problem Type
- 3.3 Defining a Problem and scheduling regular Downtimes according to it
- 3.4 How to define mapping between Error Code and CMMS Problem Code/Event Codes
- 3.5 Adding an Asset
- 3.6 Mapping assets to acquire Performance and Quality from MES101
- 3.7 Adding a Work Center
- 3.8 Shift configuration for the entire plant
- 3.9 Dynamic work schedule by plant, line or assets in the plant calendar configuration
- 3.10 Predictable scheduled downtimes
- 3.11 How to add a Root Cause Category
- 3.12 Add a Root Cause FormHow to configure Tag Mappings (when using automatic data collection)
- 3.13 Adding an Up Down Threshold
- 4 How to implement Fuji Host Interface and MESAgent Client
- 5 Data Gathering (manual and automatic)
- 6 Reporting and Business Intelligence
Problem Statements
1) A plant with quality and OTD (on time delivery) problems looking for help.
At an important manufacturing site, the program manager contacts the manufacturing operations manager and informs him that the company is facing delivery issues throughout a particular customer’s orders. After some painful further analysis, the operations team figured out that those orders have been processed across multiple different production lines making it really difficult to figure out what and where the problem is. According to manually acquired data from previous quarters, the production lines should be able to handle the demand and produce enough parts to meet the committed orders within the promised delivery dates, but it turns out that this is not the case.
Time is ticking, the team has no answer and there is no certainty they are asking the right questions. No data, no information. Lack of on time delivery can be caused by several different factors in various areas throughout the shop floor and the team is struggling to get insights quickly.
After some brainstorming, the company decides to adopt 42Q MES as a solution. They have heard the system is full-fledged MES with integrated OEE and IIoT solutions that would allow them to not only leverage traceability data collected by operators, but also machine generated payloads that can bring valuable insights on availability performance and quality metrics. Utilizing 42Q MES track and trace data that is collected in real time from machinery and operators will enable the team to not only make sure their efficiency calculations are accurate but have them available anywhere, real-time.
Once the team implemented 42Q Cloud-based MES, they were able to identify opportunities to improve the three main factors that affect overall equipment efficiency:
- Availability: With better maintenance plans and asset health and performance tracking through 42Q’s CMMS Preventive Maintenance Management.
- Performance: Making sure staff is trained and equipment is calibrated by managing these with 42Q MES101’s Employee Validation and CMMS Calibration modules.
- Quality: Measured and confirmed by 42Q’s MES extensive quality reports and dashboards, which help lead to better overall equipment efficiency.
A few months later, real-time OEE dashboards and weekly automatically delivered reports were making a difference in that company’s life (and in their customers’ confidence that their orders are now delivered as planned).
2) Comparing apples to apples (are those really apples)?
A Corporate manufacturing technology group that is responsible for enterprise wide performance and quality metrics is asked to support and approve an expensive equipment purchase for one of its plants. That’s a difficult decision. The plant has struggled to comply with corporate policies before, but the team has made significant strides over the past few years. The operations team has been sending spreadsheets via emails with data coming from disparate sources and collected at different points in time. It’s properly formatted but… still just data. The corporate team is looking for information, but not just any information. They are looking for trustworthy, auditable data, collected in real-time, as automatically as possible and protected against any sort of tampering or modifications.
Presently, the data collection happens inconsistently and the aggregations are manually done, which presents opportunities for human error. A corporate technology analyst who is familiar with 42Q MES and its features decides to drive continuous improvement programs using OEE. He/She suggested that more plants should start using it to consolidate overall efficiency and utilization information that is often available but in silos, which makes it really hard to collect, aggregate and report against in a global fashion.
The plant that is requesting the purchase approval decides to take on the opportunity and give 42Q OEE a shot. The solution should support them with the goal to consistently prove that they are operating at their peak capacity with high availability, performance, quality and utilization levels, but still not able to meet the customers demands.
They should be able to leverage the solution to make improvements on a shift to shift or week to week basis while corporate groups would also benefit from a larger adoption of 42Q’s OEE as they will be able to globally compare apples to apples when analyzing global efficiency trends, say month to month or quarter to quarter.
As a result of feeding accurate data into 42Q, the manufacturing technology group was able to confirm that the plant could reduce performance losses due to slow cycles and small stops. But the company decided to go ahead with the purchase since even with those improvements, more capacity was needed.
Configuration Order Diagram
Configuration and Prerequisites
The Problem Statement 1 can be solved by completing the configurations described in this section. These configurations will allow the users to identify machinery problems as well as their root causes in order to take an action plan to fix them as soon as possible while improving the overall equipment efficiency: availability, performance and quality. Moreover, the plant calendar and shift configuration will help users to have control over the order delivery dates.
Adding a Problem Category
The Problem Category module is used to organize problems into a categorical hierarchy, for that reason, users must first add a Problem Category to a pre-existing parent category before creating a Problem Type.
Problem Categories and Problem Type can be used with the OEE Reporting tools to equip users to perform availability analysis from different angles. Users can utilize these to filter, aggregate (group/break by) and plot/display Problems at different granularity levels depending on their needs.
Global Defects: Different types of assets/processes might require operators to report similar or the same exact issues using different jargon/verbiage/problem codes.
Assigning global problem codes to individual problems enables ‘apples-to-apples’ comparison when it’s required.
This allows quality, production or maintenance teams to analyze plant or enterprise-wide trends while keeping the operation teams using codes and naming conventions that make sense to their areas throughout the factory.
Note: Global Problems are created by placing them into a specific Problem Category. They will become available to be linked to regular Problem Codes.
The following predefined Problem Categories that describe common manufacturing problems are available:
- Manufacture
- Production
- Process
- Quality
- Energy
- Navigate to: Shop Floor Control > Configuration > CMMS - Asset > Problem Category.
- To create a main Problem Category, left-click on the main ROOT level located at the top of the Problem Category Name list.
- To create a sub Problem Category, left-click on a main Problem Category. A pop-up form will appear.
Figure 1: Difference Between Main and Sub Categories (Problem Category)
- Select Add.
Figure 2: Add Problem Category Form
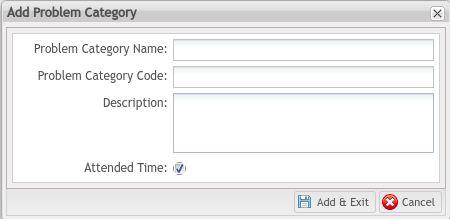
- Enter the required information.
Note: For more information on how to fill in the fields, please refer to the document OEE Add a Problem CateOEE Add Work TimeOEE Add Work Timegory.
- Select Add & Exit to save the information.
Adding a Problem Type
After adding a Problem Category to a pre-existing parent category, users may go ahead and use the Problem Type module to add new problem types or edit existing Problem Types to meet the changing needs of the plants. Users can also enable/disable Problem Types as needed.
- Navigate to: Shop Floor Control > Configuration > CMMS - Asset > Problem Type.
- Select Add. The Add Problem Type form will display.
Figure 3: Add Problem Type Form
- Enter the required information.
Note: For more information on how to fill in the fields, please refer to the document CMMS Problem Type.
- Select Add & Exit to save the information.
Defining a Problem and scheduling regular Downtimes according to it
Before scheduling regular downtimes according to a problem, users will first need to create a Problem Category and Problem Type. After that, users using MES101 automatic data collection may use the Problem module to define a problem, and record regularly scheduled downtimes (such as lunch breaks) according to the problem defined.
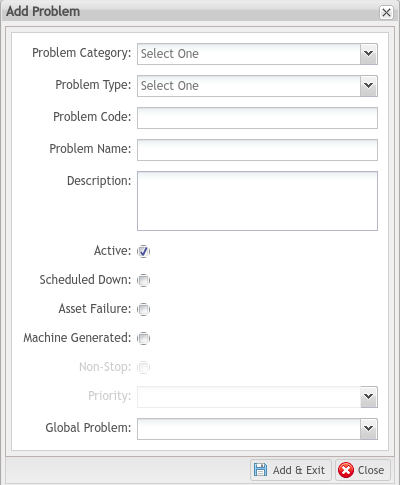
- Navigate to: Shop Floor Control > Configuration > CMMS - Asset > Problem.
- Select Add.
Figure 4: Add Problem Form
- Enter the required information.
Note: For more information on how to fill in the fields, please refer to the document OEE Schedule Regular Downtimes According to Problem in CMMS.
- Select Add & Exit to save the information.
How to define mapping between Error Code and CMMS Problem Code/Event Codes
After defining a Problem, users may use the 42Q MES OEE module provides APIs/Interfaces to get Downtime Error Codes from PLCs and Up/Down data with Error Codes from the equipment automatically.
- First of all, users have to map the relationship between Problem and Asset Type by navigating to: Shop Floor Control > Configuration > CMMS - Asset > Asset Type.
- Select the Asset Type.
- Select the Problem Event icon.
Figure 5: Problem/Event Icon
- Select ADD.
- Select one or more Code.
- Select SAVE to save the information.
- Then, go to the section: How to configure Tag Mappings (when using automatic data collection) to map the relationship between Error Code and CMMS Problem Code.
Note: Each Fuji Machine can be treated as one tag. To create a Tag ID for Fuji equipment use this naming convention: Tag ID = Fuji Machine Name. The Fuji Tag ID needs to be mapped with the CMMS Asset in the Tag Mapping. Similarly, users must also map Error Codes to Problem/Event Codes for the FUJI Error Code such as ‘SMT STOP’.
Event codes type spare affects planned production time rather than being an availability loss.
Whenever a machine sends a signal code that represents a planned downtime (a period of inactivity that is planned), an event code can be mapped to an asset spare status, nevertheless, that will affect the planned production time instead of being considered an availability loss.
If users are not using an ‘PLANNED’ SMT Line at the moment, and users simply take it down with a Problem Code (unscheduled) it may bring discussions, since the OEE will be lower than it should due to availability loss, but the reality is that machine was planned not to run.
If these periods of inactivity are repeatable, they can be handled by the calendars and scheduled downtime modules, but things can not always follow a previously defined schedule, however, they are not necessarily problems.
Event codes have yet one advantage, they can bring machines back up (to running - essentially affecting the planned production time again).
We can use the figures to understand in a better way the Spare, Planned Downtime and Unscheduled Downtime affecting the OEE and Availability.
The descriptions below represent the rules and scenarios for the Spare, Planned Downtime and Unscheduled Downtime. It is possible that the Spare status is not used very often. It will only change the shift from working to not working.
- The same Spare and Planned Downtime minutes record have the same actual production time, planned production time, OEE and availability result.
- More Spare and Planned Downtime will increase the OEE value, but it will decrease the availability value a little.
- More Unscheduled Downtime will decrease the both OEE & availability value.
- The Spare, Planned Downtime and Unscheduled Downtime reduce the actual production downtime, however, both, Spare and Planned Downtime reduce the planned Production Time, while the Unscheduled Downtime will not reduce the planned production time. That is why the availability value is down.
(Availability = Actual Production Time / Planned Production Time).
- The Spare (non-scheduled time) is used for the production planning, such as public holiday, or due to non-machine issues, the production predefined schedule will be canceled as the operator finished the work earlier than expected during the weekend overtime, then the operator can go home early.
- The Scheduled Downtime will be used widely, such as production site training, weekly meetings, lunch, tea break, smoking break etc.
- The Unscheduled Downtime will divide into machine failure or non-machine failure, that is important to identify the root cause and improve the uptime in order to improve the availability and OEE value. If there is more problem with the machine failure, then the plant management needs to check with the plant Repair team and Maintenance team. They need to find a way to make the machine more stable and increase the machine run time. If there is more problem with the non-machine failure, then plant management needs to check with the plant Training department and define a better training plant for their production operator. Most non-machine failure problems are related to human mistakes, such as short of material, waiting for the tool, wrong parts etc.
Availability = Actual Production Time / Planned Production Time
The Planned Downtimes and Assets in spare status both affect the planned production time (the denominator), while the Unscheduled Down will affect the shift's actual production time (the faction's numerator).
When the denominator decreases and the numerator stays the same, the fraction as a whole increases.
When the numerator decreases and the denominator stays the same, the fraction as a whole decreases.
Bottom line, if users incorrectly reduce the amount of planned Production Time by moving an asset to spare or recording a scheduled down rather than affecting the actual run time by properly recording unscheduled downs, the asset's availability will look better than it should (which will, in turn, drive the OEE index up incorrectly).
Adding an Asset
The first step into utilizing 42Q’s OEE to monitor Overall Equipment Effectiveness (OEE) is having asset records representing the equipment into the system. This is done in the CMMS Asset module.
- Navigate to: Shop Floor Control > Configuration > CMMS - Asset > Asset.
- Select ADD ASSET from the top right menu.
- Enter the required information of the Basic Information section.
Note: For more information on how to fill in the fields, please refer to the document: CMMS Asset.
Figure 6: Add Asset Form (Basic Information)
- Enter the required information of the Advanced information section.
Note: For more information on how to fill in the fields, please refer to the document: CMMS Add Asset.
Figure 7: Add Asset Form (Advance Information)
- Select SAVE to save the information.
Mapping assets to acquire Performance and Quality from MES101
Assuming the company is using MES 101 track and trace to scan units and move them through a route (via Production Workbench, OEE Workbench, a custom application, Measurement parsers or any other 42Q Conduit based automation) users can leverage cycle time and yield information already collected and computed in 42Q to populate Performance and Quality variables automatically.
This is done in the Asset Mapping module where users can link CMMS Assets to an MES101 Location or Device.
Note: If the user will not be pulling scanned information from MES101, they can skip this part of the process.
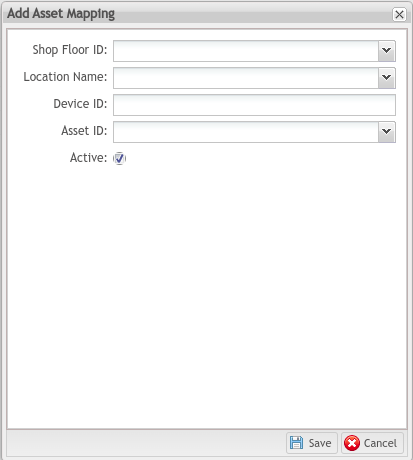
- Navigate to: Shop Floor Control > Configuration > CMMS - Asset > Asset Mapping.
- Select Add.
- Enter the required information.
Note: For more information on how to fill each field, please refer to the CMMS Add Asset Mapping.
- Select Save to save the information.
Figure 8: Add Asset Mapping Form
Adding a Work Center
Only after adding an Asset, users may go ahead and start adding a Work Center.
The Work Center module defines a group of machines that build the same product on a production line or shop floor.
- Navigate to: Shop Floor Control > Configuration > OEE Configuration > Work Center.
- Select Add.
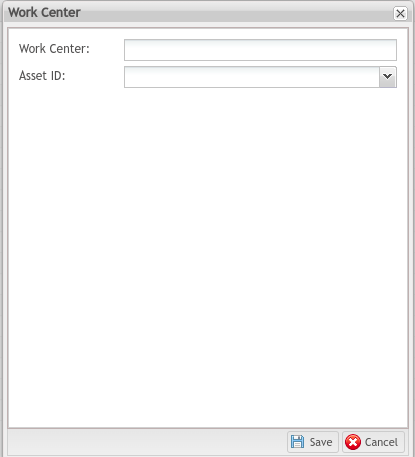
Figure 9: Add Work Center Form
- Enter the Work Center’s name.
- Select the Asset ID for the machine running on the work center.
- Select Save to save the information.
Shift configuration for the entire plant
Shifts define days and times of operation to the entire plant. This is going to help shape the planned production time which is one of the key factors to accurately measure OEE.
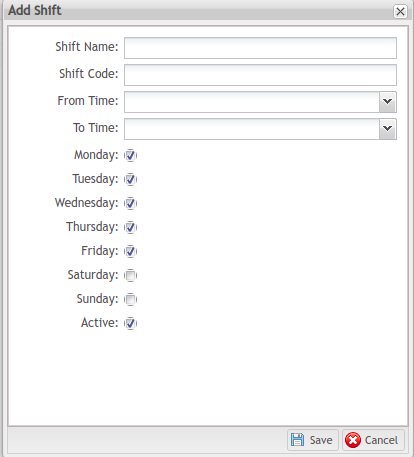
- Navigate to: Shop Floor Control > Configuration > OEE Configuration > Shift.
- Select Add.
Figure 10: Add Shift Form
- Enter the required information.
Note: For more information on how to fill in the fields, please refer to the document OEE Add Shift.
- Select Save to save the information.
Dynamic work schedule by plant, line or assets in the plant calendar configuration
Once assets are created, mapped to ME101 (if applicable) and shifts are set up, users can use the Plant Calendar module to define specific work schedules or breaks for the whole plant, individual lines or assets. This includes special periods of time such as holidays, unplanned weekend shifts or overtime. It also covers lines that will not be available during certain shifts or periods of time. This allows flexible allocation of resources by line or assets without modifying the entire shift calendar configuration that would affect all lines and equipment.
- Navigate to: Shop Floor Control > Configuration > OEE Configuration > Plant Calendar.
Adding a new Plant Calendar
- Select Add Plant Calendar. The Plant Calendar List form will display.
- Select ADD. The Add Plant Calendar form will display.
Figure 11: Add Plant Calendar Form
- Enter the required information.
Note: For more information on how to fill each field, please refer to the OEE Add Plant Calendar.
- Select SAVE to save the information.
Predictable scheduled downtimes
Once shifts are in place and any special plant, line or asset calendars are created, the next step is to record scheduled downtimes into the system. A reason (a problem code; we will talk more about that later in this document), an entity (production line or individual asset), as well as the duration, time dimension and the frequency of occurrence must be indicated.
- Navigate to: Shop Floor Control > Configuration > OEE Configuration > Scheduled Down.
- Select the ADD.
Figure 12: Add Scheduled Down Form
- Enter the required information.
Note: For more information on how to fill in the fields, please refer to the document OEE Scheduled Down.
- Select Save to save the information.
How to add a Root Cause Category
Root Cause Categories are detailed descriptions of machine downtime problems.
- Navigate: Shop Floor Control > Configuration > OEE Configuration > Root Cause Category.
- To create a main Root Cause Category, left-click on the main ROOT level located at the top of the Root Cause Category Name list.
- To create a sub Root Cause Category, left-click on a main Root Cause Category. A pop-up form will appear.
Figure 13: Difference Between Main and Sub Categories (Root Cause Category)
- Select Add.
Figure 14: Add a Root Cause Category Form
- Enter the required information.
Note: For more information on how to fill in the fields, please refer to the document OEE Add a Root Cause Category.
- Select the Add & Exit to save the information.
Adding a Root Cause
In order to create a Root Cause, users first need to create the Root Cause Category.
- Navigate to: Shop Floor Control > Configuration > OEE Configuration > Root Cause.
- Select Add.
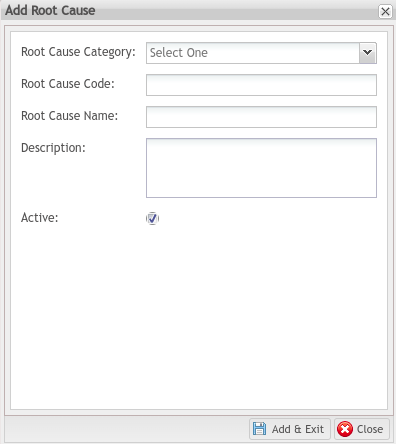
Figure 15: Add a Root Cause Form
- Enter the required information.
Note: For more information on how to fill in the fields, please refer to the document OEE Add a Root Cause.
- Select the Add & Exit to save the information.
Add a Root Cause FormHow to configure Tag Mappings (when using automatic data collection)
Only after completing the configuration of Asset and Asset Mapping, users should carry on and start configuring Tag Mapping.
Tags are key/value pairs within JSON payloads that are sent by machinery, custom applications or commercial middleware systems to the MES APIs (usually via HTTPS or MQTT).
The Tag Mapping module allows admins to map/link these tags to assets, defining who they belong to. This is how the 42Q OEE data acquisition system works when set up in automatic data collection mode. There are other types of data collection available (such as manual data entry via OEE data collection form or Fuji Host Interface via MES Agent).
This mapping process allows 42Q MES to automatically capture asset downtimes and problem codes from the equipment itself and eliminates the need to manually input downtime events.
- Navigate to: Shop Floor Control > Configuration > OEE Configuration > Tag Mapping.
- Select Add.
Figure 16: Tag Asset Mapping Form
- Enter the required information.
Note: For more information on how to fill in the fields, please refer to the document OEE Tag Mapping.
- Select Save to save the information.
Adding an Up Down Threshold
Only after completing the configuration of Asset and Asset Mapping, users should carry on and start configuring ‘Up Down Thresholds’. The Up Down Threshold module allows users to set a grace period (threshold time) before assets are officially flagged as down or up in the 42Q MES.
- Navigate to: Shop Floor Control > Configuration > OEE Configuration > Up Down Threshold.
- Select Add.
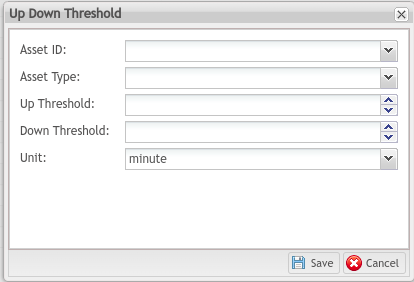
Figure 17: Add An Up Down Threshold Form
- Enter the required information.
Note: For more information on how to fill in the fields, please refer to the document OEE Add Up/Down Threshold.
- Select Save to save the information.
How to implement Fuji Host Interface and MESAgent Client
The 42Q MES OEE module can retrieve the machine Up Down/Reason through the Fuji Host Interface/MESAgent Client automatically. The ‘Fuji Host Interface Up/Down’ down reason is the same as the ‘PLC up/down’ down reason signal which comes from the machine automatically. When using this approach, the Fuji Host Interface can only be used along with the NXT & Aimex modules.
- Install Fuji Host Interface at the production Fujitrax PC. The Host Interface application is included in the Fuji installation CD with installation instructions.
- Install the MESAgent Client (42Q application) in the production Fujitrax PC. It will keep listening to the machine Up & Down/Reason signals from the Fuji Host Interface and will forward it to the 42Q MES OEE.
Note: The Fuji Host Interface and MESAgent are installed by the Administrator or Support team.
Setting up MESAgent Machine STOP Event Status
To enable the MESAgent Machine STOP Event Status option, users must first complete the following configurations:
- Asset.
- Asset Mapping.
- Tag Mapping.
- Defining a Problem (it is advisable to set up its corresponding Problem Code and Problem Name as ‘SMT STOP’ for easy identification).
- Defining the mapping between the Error Code and the CMMS Problem Code.
Note: The SMT STOP Event Status change logic is described below:
When the machine starts up, the MESAgent sends out the ‘SMT RUNNING’ status to the CMMS/OEE API.
When one of the machine modules meets the problem and stops, the MESAgent sends out the ‘SMT STOP’ status to the CMMS/OEE API.
When all the machine modules are up and running without stop, then the MESAgent sends out the ‘SMT RUNNING’ status to the CMMS/OEE API.
- Download the ‘fuji-command.xml’ file.
Note: The Service team must provide the link to download the Fuji Command file.
- Open the XML file to edit the information.
- Enter the OEE Web Service IP Address information.
- Enter the MCSTATECHANGE option inside the command tag.
Figure 18: Fuji Command XML File Content
Note: Only after completing the previous steps, users may find out all the Fuji SMT Machine Stop Event records by navigating to: Reporting > CMMS - Report > Asset Event History.
To view all the downtime work orders associated with an asset, navigate to: Reporting > CMMS - Report > Work Order, enter the Asset Name, and then select the Search button.
How to integrate a PLC
The 42Q MES OEE application availability of Layer 2 drivers (Kepware) to perform data capture from Machines or PLCs and transfer to 42Q Via Rapid IIoT.
- Install a third-party middleware (such as Kepware) software to communicate with the PLC and forward payloads to 42Q IIoT APIs.
- Work with the 42Q automation engineering to test and set up the PLC connection.
- Set up the machine downtime OEE Define Mapping between Reason Code/Error Code and CMMS Problem Code (to map Asset’s Problem Code) at the 42Q MES OEE module.
- Once mapped, users may view Downtime Root Cause Analysis Reports, Downtime Problem Reports, Downtime Trend Analysis Reports, and others in MESWeb Reports.
Note: Steps 1 and 2 are completed by the Administration or Support team.
Note: OEE value will be recalculated with the new downtime or performance/quality data.
If users fill in the missing new downtime, then the system will recalculate the OEE value based on the new downtime. If the MES101 API is down, the system will try to get the previous OEE Performance & Quality data automatically. If the Target UPH value is missing, the system will recalculate the OEE value again after users correct the value. The backend recalculation job will run automatically.
Data Gathering (manual and automatic)
Adding Asset Events
The Report Asset Event module is used by the shop floor operators to manually add asset events running, setup, idle, spare, maintenance, calibration, schedule downtime and unschedule downtime due to asset malfunctions as well as routine stoppages (such as parts in transit or lunch breaks).
- Navigate to: Production > OEE Data Collection.
- Click the Plus (+) icon.
Figure 19: Asset Events Plus Icon
- Enter the required information.
Note: For more information on how to fill in the fields, please refer to the document OEE Add Work Time.
- Once data is entered, the NEXT button will become available. Select NEXT.
- Select BACK to go to the previous window to double-check the information, or select the next status from the Status drop-down list, then select the tick button to save the information.
Reporting and Business Intelligence
The Problem Statement 2 can be solved by using the MESWeb Reports and Operation Dashboard features, which will allow users to visualize, analyze trustworthy data as well as measure their machinery capacity in terms of availability, performance, and quality.
How to generate MESWeb Reports
The 42Q MES OEE module automatically pushes OEE data to MESWeb Reports where information is displayed in a number of dynamic reports, charts, and graphs. Reports are created based on parameters selected in MESWeb Reports.
OEE Reports are classified into three categories:
- Overview: The Downtime Root Cause Analysis report is the primary OEE MESWeb Report.
- Drill Down: Users can access the corresponding Downtime Problem and Downtime Root Cause Charts through this report.
- Chart Type: Downtime Root Cause Analysis displays as a Pie Chart (by default) or Pareto Chart.
- Navigate to: Reporting > MESWeb.
- Select a Report.
- Select Data Source.
- Select Site.
- Select the Parameters.
- Enter the required information.
Note: For more information on how to fill in the fields, please refer to the document OEE Reports.
- Select Go to generate the report.
How to configure Operation Dashboard
The Operation Dashboard module provides a view of production line status, allowing plant managers to quickly troubleshoot critical problems. Presently, factories can monitor the throughput and yield of any given production line as compared to expected target results.
- Navigate to: Reporting > Operation Dashboard.
- Choose one of the default Snapshots or a new one, and select View.
- Select the Configuration Menu icon.
- A new screen will display. The configuration page consists of two parts: Widget and Global configuration.
Widget Configuration
The Widget Configuration page (top section) allows users to configure data for all individual widgets.
Figure 20: Widget Configuration Menu
Each widget may contain multiple reports. Filtered data is applied to each report. To select data for the widget:
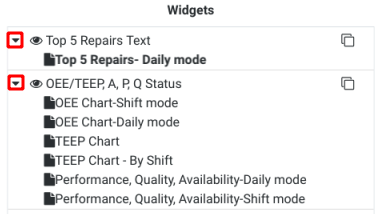
- Expand the Widget options by clicking on the arrow icon.
- Select the Report. A list of parameters will display.
Figure 21: Expanding Widgets
Note: Users may clone a widget by selecting the clone icon adjacent to the selected widget.
The Clone option allows users to create multiple widgets with different filters applied. For example, a user might clone the Top 5 Problems widget and configure one to display problems for Line 1 and the second to display problems for Line 2, thereby allowing plants to view the activity from both lines side by side.
- Select the required filters and use the arrows to add them.
Figure 22: Adding Parameters to the Widget
- Enter the Refresh Rate (min), this option defines how often data is refreshed from the database.
- Days option applies only for those widgets that have an option to display data for the number of days passed.
- The top option applies to the number of items the users want to be displayed in the chart, users can select from the top 5 or top 10.
- The Start Time option applies only for those widgets that have an option to display data for the number of hours passed.
Global Configuration
The Global configuration page (bottom section) applies data to an entire dashboard. The global configuration applies to any/all individual widget(s) with no data assigned in the Widget Configuration.
Figure 23: Global Configuration
- Enter the required information.
Note: For more information on how to fill in the fields, please refer to the document Operation Dashboard Global Configuration.
- Select the required filters and use the arrows to add them.
Figure 24: Adding Filters
- Select Apply to save changes locally in the user’s current window.
- Select Apply & Save to save changes as a Snapshot and list them on the main Operation Dashboard page.


