How to create CPK/PPK charts
Summary
This How-To Create CPK/PPK Charts document will teach users how to create a new monitor as well as set up a Data Strategy Collection, Standard Control Chart, Available Charts, and Actions, applied to the new monitor.
SPC (Statistical Process Control) is an industry-standard methodology for measuring and controlling quality during the manufacturing process.
The most notable advantages of using SPC are the following:
- Companies can dramatically reduce variability and scrap.
- Statistically improve productivity.
- Reduce costs.
- Uncover hidden process characteristics.
- Instantly react to process changes.
- Make real-time decisions on the shop floor.
How to create a new monitor with a CPK/PPK chart
SPC monitors should be created under an existing monitor group. To create a monitor, users must follow the following steps listed below:
- From the Monitor Group List page, select a group monitor, and then click the GO icon.
Figure 1: Monitor Group List Page
- From the Function List page, select Monitor Maintenance.
Figure 2: SPC Function List Page
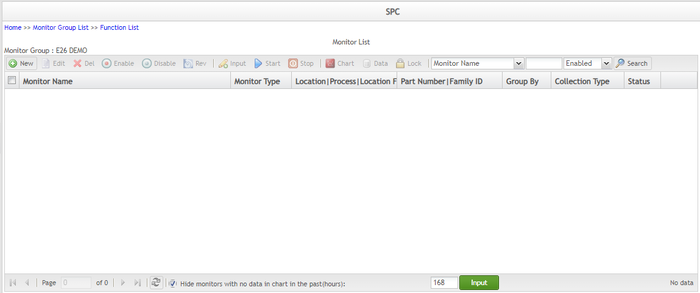
- On the Monitor List page, select New.
Figure 3: SPC Monitor List Page
Select Part or Family ID.
Enter the Part Number or Family ID, and then use the arrow to add or delete the value.
Select Location, Process, or Location Family.
Enter the Location, Process, or Location Family, and then use the arrow to add or delete the value.
Select Next to go to the next tab.
Figure 4: Monitor Tab


