SOP-42Q-MES0175-A SPC Dashboard Maintenance
42Q Home > Quality > SPC Dashboard
MES Portal
SPC Dashboard
Version MES 15.72
Revision A
Contents
SPC Dashboard Maintenance
At the SPC Dashboard Maintenance module, users can add, edit or delete the dashboard, for the dashboard, users can define the dashboard to show the charts for special monitor groups.
Go to Administration > SPC Dashboard Maintenance to open the SPC Dashboard Maintenance page.
Figure 1: SPC Dashboard Maintenance
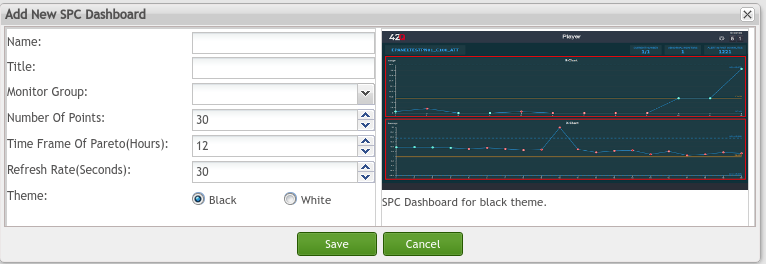
Add SPC Dashboard
Users can add a new SPC Dashboard.
- Select the Add
- Input the fields as needed.
- Select Save to create a new SPC dashboard.
Figure 2: Add SPC Dashboard
- Name: The name of the SPC dashboard.
- Title: The title of the SPC dashboard.
- Monitor Group: Select the Monitor group from the drop-down list
Note: The Monitor groups were defined at the SPC monitor group module.
- Number of Points: To define the max points that show on one page.
- Time Frame of Pareto(Hours): To define the time range of the date to show the Pareto chart.
- Refresh Rate(Seconds): To define the refresh rate between the monitors of the monitor groups for the SPC dashboard.
- Theme: The background color of the theme.
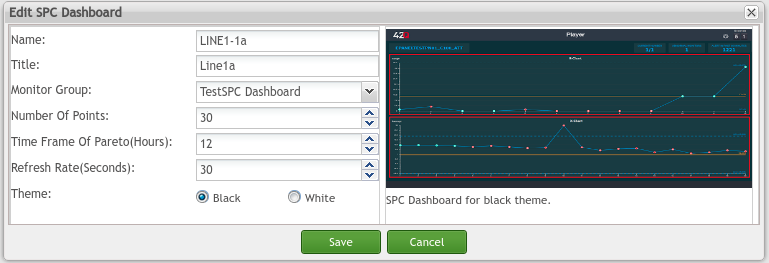
Edit SPC Dashboard
Users can edit an SPC Dashboard.
- Select the SPC dashboard then select Edit
- Change the fields as needed.
- Select Save to update an SPC dashboard.
Figure 3: Edit SPC Dashboard
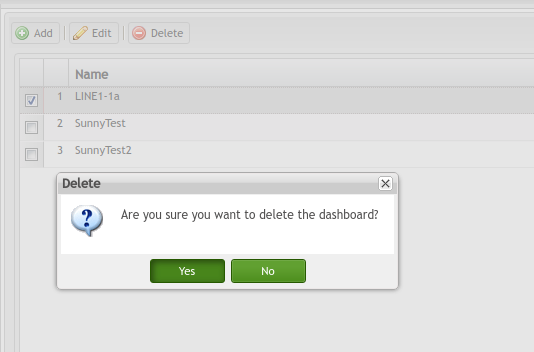
Delete SPC Dashboard
Users can delete an SPC Dashboard.
- Select the SPC dashboard then select Delete
- Will pop-up a window to ask the users to confirm.
- Select Yes to delete the SPC dashboard.
Figure 4: Delete SPC Dashboard
SPC Dashboard
- To see the SPC dashboard, please navigate to the Quality > SPC Dashboard.
Figure 5: SPC Dashboard List.
- Select the Go at the right to see the SPC Dashboard.
Figure 6: SPC Dashboard -Monitor 1
Figure 7: SPC Dashboard -Monitor 2
Figure 8: SPC Dashboard -Monitor 3
As shown above, there are three icons at the top:
- CURRENT NUMBER: The current monitor and the total numbers of monitors at the monitor groups which have data in charts in the past hours.
Note: The hour was defined at theSPC system Parameter Maintenance.
- ABNORMAL MONITORS: The number of monitors at the monitor groups and these monitors has data that are out of control in the charts.
- ALERTS IN PAST 60 MINUTES: The number of Emails that will be sent to associated users for that points were out of control (abnormal points) .
Note: In the example above, the SPC dashboard will show the monitors one by one every 30 seconds. The values 30 times were defined at the SPC dashboard configuration. (See figure 3).
Note: If all the monitors there are no data at the SPC dashboard, the system will refresh every 2 minutes.
- Users change the SPC dashboard configuration by selecting the icon at the right top.
Figure 9: SPC Dashboard Configuration
Document Revision History
| Date | Author | Title | Version | Change Reference | Approved By |
| 11/25/21 | Helena Wang | Technical Writer | A1 | The First version for SPC dashboard at MES 15.72 | Sunny Xiong |


