42Q-MES0160 OEE Whitepaper
OEE (Overall Equipment Effectiveness)
Improving your factory's production process
By definition OEE is the cumulative measure of three separate factors: Availability, Performance and Quality and together they can provide you with a good measure of how well your production line is running. Such information is critical when trying to determine benchmarking in order to improve your company's efficiency.
Contents
- 1 What Is OEE?
- 2 OEE Calculation Example
- 3 Six Big Losses
- 4 What’s Benefits?
- 5 Whitepaper Structure
- 6 OEE Workflow
- 7 OEE Functionality in 42Q Module:
- 8 OEE Modules within 42Q:
- 9 Highlight questions and Our 42Q OEE Solution
- 10 Question 1: Integration with MES 101,retrieve the real production data from production line.
- 11 Question 2: Key in/Receive the UPH or Cycle Time
- 12 Question 3: Sync Fuji/PLC Machine downtime and Reason/Error code
- 13 What are the benefits of an automated data collection?
- 14 Attachments
- 15 References
- 16 Revision Log
What Is OEE?
OEE (Overall Equipment Effectiveness) is known as the gold standard for measuring manufacturing productivity. To simply put it, it identifies the percentage of manufacturing time that is truly productive. By measuring OEE, manufacturing businesses will gain important insights into how to systematically improve the manufacturing process.
By implementing a system that can measure and analyze OEE, manufacturers can improve equipment performance, operating procedures, and maintenance processes.
Measuring OEE is the manufacturing best practice and metric for identifying losses, benchmarking progress, and improving the productivity of manufacturing equipment (i.e., OEE takes into consideration the cumulative impact of three factors: the equipment’s availability, its performance rate, and the quality of its output.
Overall Equipment Effectiveness :
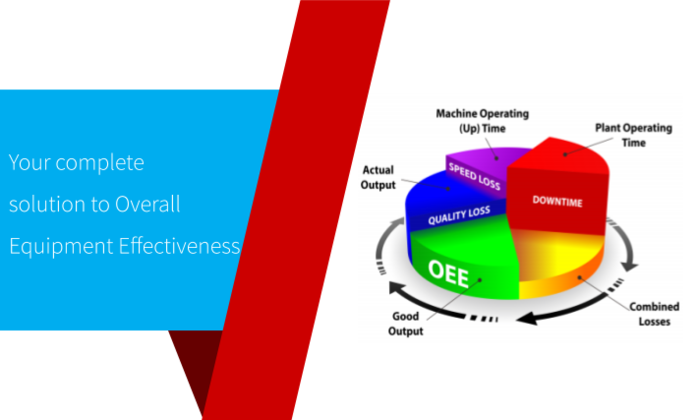
OEE uses all three factors to give you a single metric that is used to help you identify the percentage of manufacturing time that is truly productive :
OEE Calculation Example
OEE scores provide a very valuable insight into an accurate picture of how effectively your manufacturing process is running. It also makes it possible to track improvements easily within the process over time.
Here are some interesting examples that capture the fundamental nature of each of the three losses (Availability, Performance, and Quality) :
Availability = Operating Time / Scheduled Time
Availability = 420 minutes Operating / 450 minutes Scheduled = 93.3%
Performance = Time to Produce Units / Operating Time
Performance = 400 minutes / 420 minutes = 95.2%
Quality = Good Units / Total Units Produced
Quality= 380 Good Units / 400 Units Produced = 95.0%
Finally, OEE is calculated by multiplying the Three OEE Factors :
Availability (93.3%) x Performance (95.2%) x Quality (95.0%) = OEE (84.3%)
Six Big Losses
One of the major goals of OEE (Overall Equipment Effectiveness) is to reduce and eliminate what is called the Six Big Losses – the most common causes of equipment-based productivity loss in manufacturing.
Below is a chart demonstration defining the Six Big Losses. Let’s take a look at each one of the six in more detail and how digital capabilities can help to minimize them for greater effectiveness and efficiency upon the manufacturing floor.
Six Big Losses:
Availability Losses:
- Equipment Failure
- The first big loss is caused by equipment that is not running despite being scheduled to do so within production. This results in an unplanned down due to machine breakdowns, tooling failure, and/or emergency maintenance stops.
- Setup and Adjustments
- The second big loss is caused by downtime when equipment is not running due to changeover, machine, and tooling adjustments or planned maintenance as well as setup time and quality inspections.
IoT connected devices can help to minimize possible downtime while also improving the effectiveness of changeovers and adjustment. One possible way of reducing downtime can be by pushing a reminder or alert to workers’ mobiles or wearables about upcoming changeover as well as step-by-step guidance on how to perform it.
Performance Losses:
- Idling and Minor Stops
- Also known as small stops, idling, and minor stops account for short periods of time when equipment stops operating. These can be caused by material jams or product flow obstructions.
- Reduced Speed
- Equipment can sometimes run more slowly than the Ideal Cycle Time. Reduced speed can be due to poorly maintained or slow equipment.
Technology can help to address performance losses by helping to improve training and provide operators with relevant information for the point of action. For example, management can take a photo of the machine as evidence of complying with the standard operating procedure (SOP).
Quality Losses:
- Quality Losses
- Both quality losses account for the production of defective parts, including scrapped parts and parts that can be re-worked.
- Reduced Yield
- Reduced yield accounts for the defective parts produced in the warm-up stage of production. It is caused by poorly executed changeovers, wrong settings, or equipment generating waste after startup.
Analyzing data captured on the shop floor can help to identify the root causes and communicate with workers the best corrective action to take.
What’s Benefits?
- With Overall Equipment Effectiveness (OEE), you are able to accurately and effectively measure your manufacturing productivity. Overall Equipment Effectiveness (OEE) identifies areas of production time that are efficient, how efficient they are, and offers thorough insight within your operation.
- Return on Investment (ROI) - Machinery is a large investment that companies make in order to achieve maximum return on investment. Operators are able to prove the amount of financial value of these investments, conducted through measurable data provided by overall equipment effectiveness (OEE). With even a small increase in production, this can add up in time in small increments and become monumental progress for a production facility.
- Increase Competitiveness - For manufacturing operations, it is a must to reduce losses within production and push toward greater competitiveness. If production line is lacking efficiency, there are procedures and methods needed to help maximize the facility. With OEE data, operators and analysts are able to identify any constraints or bottlenecks within production. Cloud-based OEE can easily identify any weaknesses and opportunities within production.
- Visualizing Performance - OEE enables you to visualize performance with ease. This is conducted by utilizing calculations and observing any production losses. This is then assigned into three different categories of availability, performance, and quality and then are filtered into a single metric, ultimately showing current production status and areas of improvement.
- Reducing Machinery Cost - Understanding actual performance of machinery correlates directly with knowing whether or not the machine is working efficiently. It also identifies whether there are issues that may lead to the need for future repair. With OEE, you are able to anticipate events that represent massive savings of cost - preventative maintenance, machine failure, etc.
- Production Insight - You can not understand what to improve without it being measured, which is why utilizing live data of equipments status can efficiently provide the knowledge to reduce any unplanned downtime and increase speed time on planned stops. This analysis of the correlation between performance and performance loss may reveal potential for improvements within maintenance in the future, ultimately leading to lower cost within the facility.
Whitepaper Structure
First, we will instruct our OEE system workflow and modules, then We will explain OEE highlight solutions by using questions and solutions for several real-life examples from production lines.
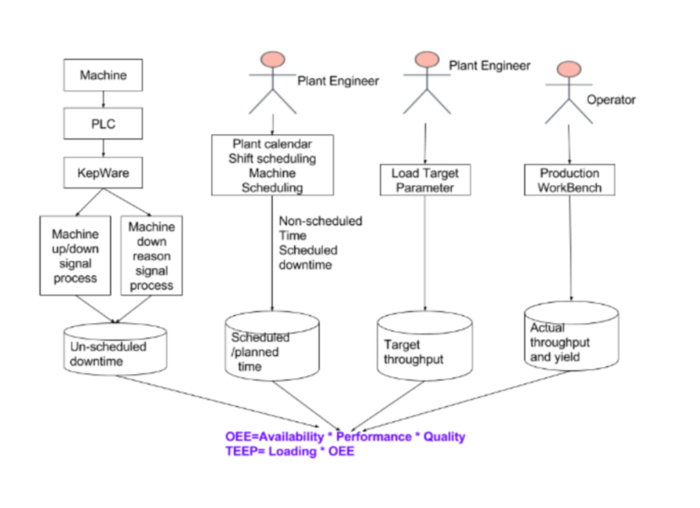
OEE Workflow
OEE Functionality in 42Q Module:
The functionality provided by the 42Q OEE system includes:
- Automatic or manual acquisition of downtime, quantity
- Downtime classification via reason/error code
- Downtime management and analysis support
- Data contextualization against meaningful production data as well as custom data
- High visibility panel/TV/Web operator pages
- Supervisor pages for detailed analysis
- Downtime reports & dashboards with drill-down capability
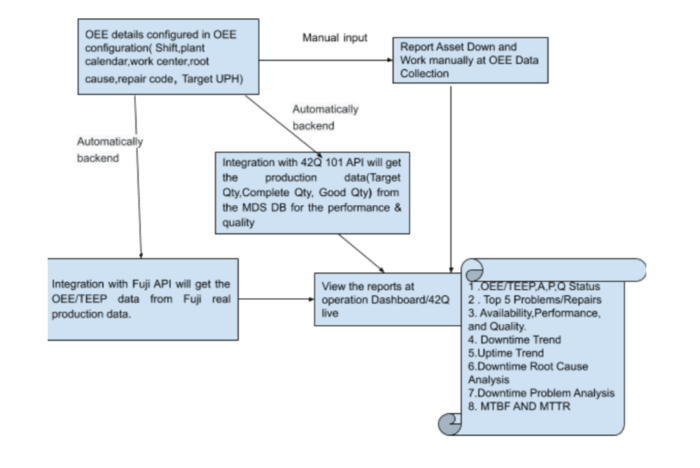
OEE is completed within several 42Q modules :
- The OEE Configuration modules are used by engineers to define Shift, Plant Calendar, Work Center, Root Cause/Root Cause Category, Tap Mapping, Up/Down Threshold, Target UPH, Repair, also the mapping parameters to connect the MES101 and Fuji.
- OEE Production modules are used to report the Machine Down and to report work manually, also associates MES 101 data (Shop Floor Asset Mapping) with OEE, in order for 42Q OEE to get the production data auto backend.
- OEE Operation Dashboard /42Q live/MESWeb are OEE reports that inform your team just how close you are to that target and which aspects of your operations are holding you back from exceeding it.
OEE Modules within 42Q:
All data is collected in one central location. OEE modules are located within Shop Floor Control > Configuration > OEE Configuration.
1. Shifts
The supervisor defines days and times of operation to the various shifts operating in their plants in order to accurately measure OEE availability. Administrators assign Shift Names and Shift Codes to scheduled shifts, and then add/edit shifts as needed.Shifts are configured in OEE > Shift.
2. Plant Calendar
The Plant Calendar is a planning tool that allows administrators to add or remove special shifts from the work schedule (such as holidays, or extra workdays- e.g. Sundays), without affecting the regular work shift calendar.
3. Work Center
The Work Center defines a group of machines that build the same product on a production line or shop floor. Work Center is a configuration tool used by managers to:
- Designate the Work Center Name
- Assign an Asset to the Work Center
4. Root Cause Category & Root Cause
Root Cause Categories are broad descriptions of machine downtime problems. Possible manufacturing Root Cause Category examples include: Process, Energy, System, and Maintenance. Users may add and edit root causes directly from the Root Cause Category submodule, or within the Root Cause submodule of OEE. Examples of root causes pertaining to a manufacturing environment include: Material Issues, Shortage of Operators, Unscheduled Maintenance, Change Over, End of Shift Cleaning, and Tool Change.
-
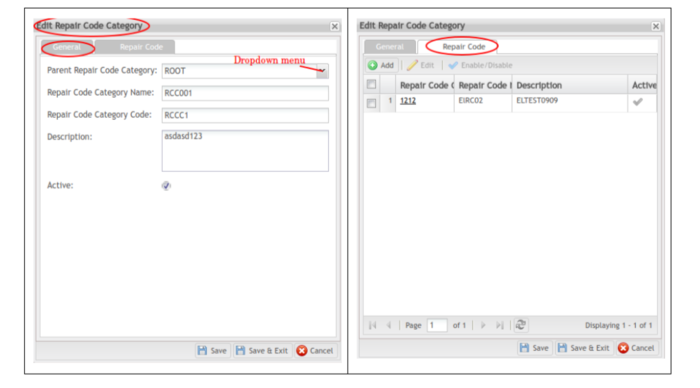
Repair Code Category & Repair Code
Sometimes the production line’s low OEE value may be caused by worn out, misaligned, or broken parts on the asset itself. To resume producing good quality product, the repair team must replace or refurbish the asset’s parts or calibrate the asset itself. The management team may also want to view the asset’s repair history according to reported Problems and/or most commonly reported repairs (Top Repair Codes). All repair details are compiled into reports that are available on the factory’s shop floor via Operation Dashboard. Overall, OEE’s Repair Code feature is a valuable tool that helps management teams to determine the root cause of poor OEE scores.
6. Up Down Threshold
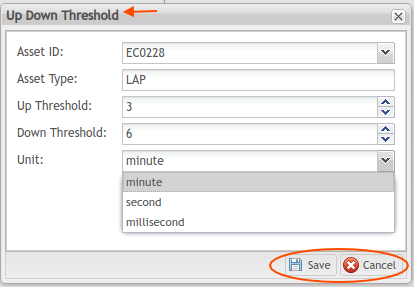
The Up/Down Threshold submodule of OEE allows engineers to set a grace period (threshold time) before assets are officially flagged as down or up in the 42Q MES.Up/Down Thresholds are configured according to Asset Type, and depend upon that machine’s unique running patterns and idiosyncrasies. The time selected will determine how long the system allows before machine stoppages and starts are recorded as down/up times. Time intervals are available in minutes, seconds, or milliseconds.
7. Tag Mapping
The Tag Mapping feature links (tags) assets to the OEE reporting system. This mapping process allows 42Q’s MES to automatically capture asset downtimes and problems from CMMS, and eliminates the need to manually input downtime events. Once a downtime event is received, the system creates a new repair Work Order or closes the corresponding Work Order in CMMS.
OEE Data Collection
42Q OEE provides two ways for plants to collect Production Data.
- Report production data (downtimes, work time) manually in the OEE Data Collection module.
- Collect production data backend automatically from MES 101,Fuji, and PLC using the OEE tools, 42Q's API, and a preferred client.
OEE Reports
Users able to see the final OEE, TEEP, performance, quality and availability metrics on reports, 42Q Live Operational Dashboard (3x3) and 42Q Live Layout.
Our 42Q OEE system provides reports as following:
- OEE/TEEP,A,P,Q Status report
- Top 5 Problems/Repairs report
- Availability,Performance, and Quality report
- Downtime Trend report
- Uptime Trend report
- Downtime Root Cause Analysis report
- Downtime Problem Analysis report
- MTBF AND MTTR report
Operation Dashboard
42Q’s dashboard application, Operation Dashboard, provides a real time view of production line status, allowing plant managers to quickly troubleshoot critical problems in real time. Presently, factories can monitor the throughput and yield of any given production line as compared to expected target results. Read about 42Q Live
OEE Widgets
The addition of OEE (Overall Equipment Effectiveness) widgets to the Operations Dashboard provides displays a different kind of productivity metric. With one quick glance at their shop floor monitors, plant managers can now answer broader questions: How well does my machinery work? How are my lines moving? What is causing delays and downtimes? What time of day do problems occur? And more.
42Q Live Updates
42Q Live provides real time data on shop floor activity in an intuitive dashboard format. 42Q Live currently offers 3 Layers of data:
- Machine: displays cycle time status (Machine status is determined by comparing scanning activity (throughput and cycle time) during a set period of time to target yield values predefined in target maintenance.
- TP/Yield:shows throughput and yield values for the selected level, and the current status of each production line (ok, acknowledged, on hold, critical, and idle.)
- OEE: shows OEE statistics for the specific asset;
MESWeb
OEE MESWeb reports include all historical data as it relates to current OEE activity.
Highlight questions and Our 42Q OEE Solution
Question 1: Integration with MES 101,retrieve the real production data from production line.
42Q Solution:
42Q provides MES 101 API/Web services to get real production data automatically backend. MES 101 allows OEE to gather Performance & Quality data from MES automatically, thus avoiding possible human errors resulting from manual entry. The process saves labor time and ensures data (e.g. Finished Qty, Good Qty, Target UPHs, shop order, Start/End Intervals, etc.) is accurate and up-to-date. The automatic data retrieval also reduces the need for operation training, thereby simplifying implementation, and reducing costs.
- The MES 101 system provides an API to feed performance & quality data to the OEE system.
- OEE retrieves specific location/machine hourly throughput & yield from MES 101 interface.
- OEE system collects target HPU & yield rates as well as quality, OEE and TEEP from MES 101 backend.
- The user can set the target OEE, Performance, Quality and Availability at the MES 101 Target Maintenance. It take care the ERP Shop Order Target OEE value as well.
Configuration Steps
In order for the system to get the Production data and target data, users must map the Asset to the Location in OEE system (Shop Floor Control > Configuration > CMMS Asset > Asset Mapping).
Question 2: Key in/Receive the UPH or Cycle Time
The OEE standalone user needs to be able to key in the expected Cycle Time or UPH, eliminating the mandatory ERP dependency.
Use Case
- The user can key in the Shop Order with the expected Cycle Time or UPH at the GUI.
- Alternatively, The OEE system will calculate the OEE based on the performance target value.
- If ERP order integration is available, the system should be able to use it.
- The user should be able to see the final OEE, TEEP, performance, quality and availability metrics on reports, 42Q Live Operational Dashboard (3x3) and 42Q Live Layout/Monocle.
42Q Solution :
To meet the requirements/questions of a wide variety of plants, OEE offers several ways to configure target data/Target UPH.
- Plants operating OEE as a standalone product input their target UPH data manually through OEE’s Target UPH module.
- Plants using MES 101 can set target values at the Target Maintenance module; the system automatically saves data into CMMS and OEE databases.
- Plants that utilize Oracle’s ERP to transfer data define target values in Oracle; 42Q sends data via the Oracle Work Order to 42Q’s Shop Order.
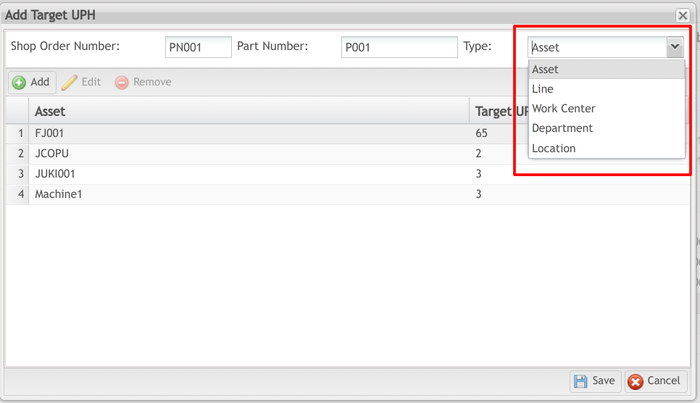
The OEE Target UPH (unit-per-hour machine rates) module allows users to manually set Target UPH rates for plants using OEE as a standalone feature.Plants can config the UPH by Asset,Line,Work Center,Department and Location.
Target Configuration for MES 101 Plants
Plants using OEE in conjunction with MES101 will set target UPH values in 42Q’s Target Maintenance module. Once defined, target data will be saved into the plant’s MES database. The OEE application then calls 42Q’s API call (automatically auto) to send target data from the MES database to the CMMS/OEE database .
OEE Target: Define UPH For Assets
SOMS Target: Define Target for Mfg. Lines
The SOMS Target is used to configure target data according to Manufacturing line, Process, and Part Number. The configuration also determines how MES 101 data (e.g. target yields, throughputs, top defects, etc.) will be displayed in Operation Dashboard and 42Q Live.
Target OEE Data compare with real OEE Data for 42Q Live: A Screen Printer Use Case
The following illustration shows the OEE values for a Screen Printer as they display in 42Q Live.
Figure: Target Ranges in 42Q Live
The OEE value reads red, signifying to line supervisors that the screen printer in this location requires immediate attention. Because the Target configed was 95%, any number falling beneath 95% would signal critical status (red).
If the target OEE value for this screen printer had been set at 75% and the cautionary (yellow) value had been set at 60%, the OEE gauge chart would appear yellow, because the present OEE value of 70% falls between 60% - 75%.
Likewise, if the critical value had been set at 60% and a cautionary value was set at 50%, this 70% reading would display green, indicating the screen printer asset is behaving as expected. OEE Example: Target vs. Actual (Closeup View)
Question 3: Sync Fuji/PLC Machine downtime and Reason/Error code
To sync the Fuji machine downtime raw data to the OEE database table and summarize the Fuji downtime raw data at backend, then the user can view the Fuji OEE downtime analysis summary report.
42Q Solution:
42Q OEE system provides Web service to retrieve the machine Up, Down/Reason through the Fuji Host Interface/PLC interface automatically. The Fuji Host Interface up/down, down reason is the same as the PLC up/down, down reason signal which come from the machine automatically.
- The OEE web service syncs the Fuji machine downtime raw data from Product Navigator DB regularly.
- The OEE web service summarizes the Fuji downtime raw data at backend.
- The plant users view Fuji machine downtime analysis summary report at the 42Q OEE application side.
What are the benefits of an automated data collection?
If done properly, manually executed OEE systems will identify losses and opportunities for improvement. However, collecting and interpreting data for evaluating OEE this way is a time-intensive process that is wrought with risk of error and inconsistency. The time and effort spent doing it this way would be much more efficiently used to work on actual improvement projects. In addition, at higher levels of OEE, it becomes more difficult to obtain further gains, which makes the time and effort in manual systems seem less worthwhile. There are many benefits of automated OEE systems. They are powerful tools used to provide automated data collection, analysis and reporting of accurate and consistent, data-based OEE evaluation summaries and details. The following table provides a comparison of these two methods, and shows the powerful and cost-effective benefits of using the OEE productivity tools. /> />
OEE Using Manual Spreadsheet 42Q OEE System Proper data collection and reporting can take up to 20 man-hours per month, per work cell or line, and information accuracy and detail is limited Data is captured automatically, reports are user-defined and generated on demand, or automatically generated based on schedules set by any user Difficult, complex analytical methods to consistently apply, and then manually map results to sources of OEE shortfalls for subsequent analysis Pareto analysis tools automatically provide top reasons for downtime losses, and the detailed data needed to identify and resolve the root causes Errors can come from operator influence, data collection and reporting, missed stoppages, memory of events, and estimations; impact to OEE subject to interpretation and inconsistencies Every production stop and performance loss is captured, validated and analyzed; down time reason codes can be assigned automatically by the machine and updated by authorized operator or engineer; OEE impact consistently applied per facility guidelines and industry standards Timeliness and accuracy of data and level of detail is dependent on individuals involved, and organizational, political, and cultural influences Data is analyzed in real time, and delivered with valuable information tailored to the requestor, whether operators, maintenance, engineers, or management Attachments
CMMS Administration Work Instruction
References
https://www.oee.com/ https://cp.energy/wp-content/uploads/2017/09/OEE-Overview-v2.pdf
Revision Log
Rev# Revision Date Section(s) Modified Updated by Reviewed & Approved by Published by 1
07/18/2019
Proof of Concept.
Helena Wang.
2 10/6/2020 Updated entire vOEE Whitepaper. Tiana Hollingsworth Simon Zhou Tiana H.
