SOP-5-I-MES0073-C Measurement 3.1
42Q Home > Test Integration > Test Integration (Measurement 3.1)

This edition applies to MES15 Portal 1.0 Application and all subsequent releases and modifications until otherwise indicated in new revisions.
Contents
- 1 Introduction
- 2 Home
- 3 Administration
- 4 Configuration
- 4.1 Parser
- 4.1.1 List parsers
- 4.1.2 Search parser
- 4.1.3 Create a new parser
- 4.1.4 Enabled / Disable a parser
- 4.1.5 Edit a parser
- 4.1.6 Delete a parser
- 4.1.7 Clone a parser
- 4.1.8 Restore a parser
- 4.1.9 Parser Configuration Groups
- 4.1.10 Search Configuration Groups
- 4.1.11 Creating a Configuration Group
- 4.1.12 Edit a Configuration Group
- 4.1.13 Delete a Configuration Group
- 4.1.14 Add Configuration Items to a Configuration Group
- 4.1.15 Edit Configuration Items in a Configuration Group
- 4.1.16 Delete Configuration Items in a Configuration Group
- 4.1.17 Parser Station Groups
- 4.1.18 Search station
- 4.1.19 List station group
- 4.1.20 Enable/Disable all stations on group
- 4.1.21 Add new station group
- 4.1.22 Edit a station group
- 4.1.23 List defect mapping groups from a station group
- 4.1.24 Add a defect mapping group to a station group
- 4.1.25 Bulkload defect mapping items to a defect mapping group
- 4.1.26 Station
- 4.1.27 List stations
- 4.1.28 Add a station
- 4.1.29 Enable/Disable a station
- 4.1.30 Delete a station
- 4.1.31 Move a station
- 4.2 Tooling
- 4.3 SFDC Configuration
- 4.4 Recipe Maintenance
- 4.1 Parser
- 5 Operations
Introduction
The Measurement application is a flexible, extensible, high-performance software solution designed to be an integration platform between test equipment (AOI, AXI, 5DX, FP, ICT, FCT, System Test, Burn-In, etc.) and MES. Measurement provides a common gateway for automating simple and complex task chains. It also provides a centralized repository for test parametric data collection and reporting.
Measurement allows engineering to design and build powerful, quick, and error-free mechanisms that automatically perform checks against data available in current or previous test outputs in any MES application. It also provides a method to automate a majority of scanning related tasks for SFDC/Conduit.
The basic off-the-shelf solution provides AutoLog mechanisms (to PASS/FAIL UUT - Unit Under Test), test step mapping to symptom codes (allowing Pareto of symptoms, grouping similar faults,etc., as well as link key process indicators to SPC monitored attributes (allowing for a broad range of statistical process control techniques to be used to take actions based on deviations, control charts, cpk analysis, etc) and test parametric data collection reported DHR (Device History Report). This feature also provides tabular "measures vs. specs" reports that can be imported into Minitab for histogram, dispersion, control charts, and normal distribution-curve creation thereby giving engineering statistical reporting over volumetric test data.
Home
Login / Logout
Measurement can be accessed from the 42Q Welcome page. To login, select a language, enter a valid screen name and password, and click the Sign In button.
Figure 1
To switch users or logout of the application, click the Sign Out link located at the top right of the screen next to the username.
To log back in, click the Sign In link at the top right and repeat the login process.
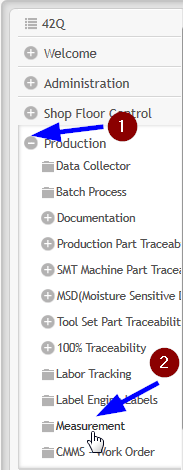
The Activity Monitor, Manual Test Log, Log Viewer, System Log, Audit and Locked Objects modules are located in the Production Menu. From the system menu, click the Expand button on the left of Production to show the menu options. Then click the Measurement option to access the Measurement Operation modules.
Figure 2
Select the Measurement menu item to display these modules.
Figure 3
The Parser, Tooling, SFDC Configuration, SPC Integration and Recipe Maintenance modules are located in the Shop Floor Control menu.
From the system menu, click the Expand button on the left of Shop Floor Control to show the menu options. Then click the Expand button on the left of Configuration, then click the Meas Config option to access the Measurement Configuration modules.
Select the Meas Config menu item to display these modules.
Instance Selection
The Measurement configuration web application is instance based. All parsers, stations, and any Measurement automated line production related information constitutes an instance and is stored in a Measurement database. Each instance is set to view one Measurement database. This produces one instance per Measurement installation.
Generally, Measurement is configured to have one installation per site. It is also common to have a separate instance in the same site when there are medical operations. To view available instances in the Measurement application, select the Instances drop down list.
Figure 4
A list of instances will display. Instances can be selected in order to update information. The instance set will appear as the screen’s title to display the current instance to the user.
Administration
Users
The following roles are available via the access control module within Measurement: Global Administrator: A user with access to all instances. Has the ability to manage user permissions. Instance Administrator: A user with the ability to manage instance related configuration, such as SFDC Configuration and Instance Configuration Groups. User: A user with the ability to manage all configurations contained in accessible instances. Operator: A user with the ability to use checklist and activity monitor modules in accessible instances.
To access the User management module, select the Users icon from the Measurement administration screen.
Figure 5
List user accounts
Upon entering the Measurement User Management module, Measurement loads all users on the application from all instances. The following information is shown:
Username: The active directory username or Measurement account name. Badge: The user badge number; this is used in the Checklist module to send to AutoSFDC when registering a test. Instances: The Instance list to which the user has access. Permission: The Role (and associated abilities) to which the user is assigned. Enabled: True when user has access to the Measurement application.
Search for a user
The User module provides a search tool. Click the Expand button on the left of Search Panel title to expand the search area. Provided filter fields include Username, Permission, and Enabled. More than one filter may be used. Click the Search button to filter the results according to the filter criteria specified. To erase the filter, clean up all filters and click the Search button.
Figure 6
Enable / Disable a user account
Accounts may be disabled in order to remove user access to Measurement. This operation is reversible, so privileges are not permanently lost. To disable a user account, click the Disable button of the respective account in the User list.
Figure 7
To reverse the previous action and re-enable the account, click the Enable button. The button will appear red when the account is disabled, and will change to green to indicate that it has been enabled.
Add a user account
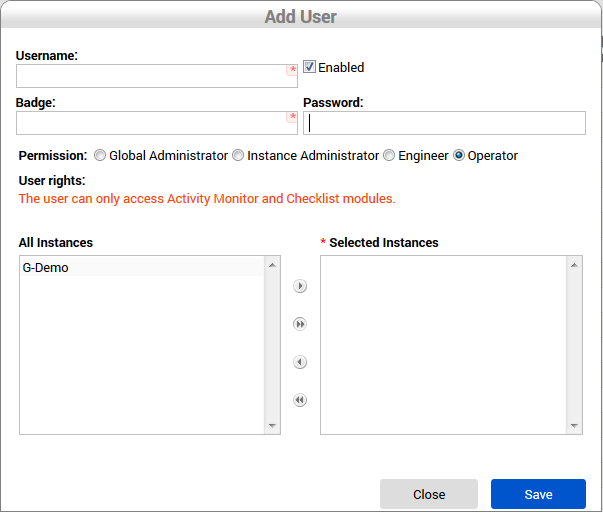
User must be a Global Administrator to add a user account. To add a new user, click the New button at the top of Users list.
The Add User form displays:
Figure 8
The fields for the Add User screen are: Username: The active directory username or Measurement user account name. Badge: The respective user’s badge number; this is used in the Checklist module to send to AutoSFDC when registering a test. Password: The password used for logging on to the Checklist module. This password is optional and typically only used if the user does not have an active directory account. Permission: The role to which the user is assigned. Enabled: This refers to when the user has access to the Measurement application. All Instances: List box displaying the instances to grant a user. To grant instances, click/highlight on the instance and use the arrow buttons to move it to the Selected Instances list box.
Click the Save button when done to save changes, or click the Close button to abandon changes. Upon clicking the Save button, Measurement will validate the user identification and store the user in the Measurement database. Measurement closes the Add User form and reloads the Users list, which now contain the new user.
Note: Permissions cannot be given at levels above the granter's level.
Edit a user account
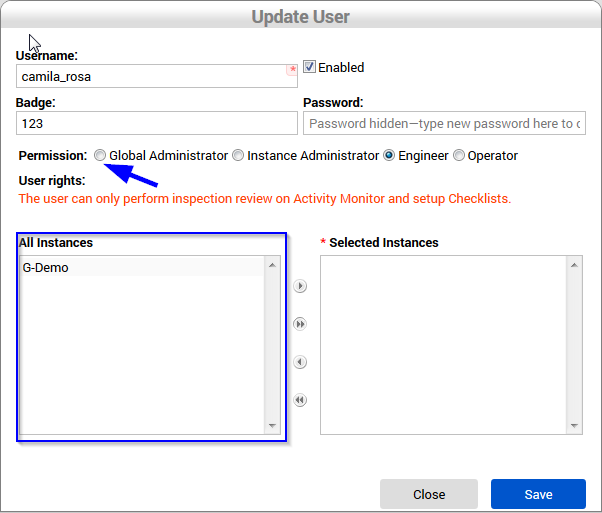
To change a user’s permissions or role, their account must be edited. This action requires Global or Instance Administrator permission. To edit a user account, click the Edit button referencing the user’s item on the list.
Figure 9
Click the Save button when done, or click the Close button to abandon changes. Upon clicking the Save button, Measurement will validate the information, store the data in the Measurement database, close the screen and reload the user’s list with the updated user.
Remove user account
To remove a user account from Measurement click the Delete button associated with the user. Global Administrator privileges are necessary to perform this action.
After clicking the Delete button, Measurement prompts to confirm the operation. When confirmed, Measurement removes the user from Measurement database and reloads the user list without the removed user.
Instances
An instance is used to handle a group of jobs (Parsers) that are responsible for: Importing test results from many channel types Processing test results Communicating to SFDC
NOTE: Only Global Administrator users can manage instances (Projects).
As a Measurement installation, an instance is composed of a Measurement Engine Service, a Measurement Database, and Parsers. An instance may have multiple Projects running in the same server reaching different Measurement databases as well as different MESR databases. To access the Instance module, go to the Measurement administration page at the top menu and click the Instances icon.
Figure 10
List instances
Upon accessing the Instance module, Measurement loads and displays all instances. To see instance information, expand the instance item by clicking the Expand button on the left of the instance name.
Search for an instance
The Instance module also offers the ability to filter instance items. To search for an instance, click the Expand button on the left of Search Panel at the top of the instance’s list. Fill the appropriate filter fields, and click on the Search button. Measurement provides filtering instances by alias and server name. To unfilter the instance list, clear the text from alias and server name fields and click the Search button again.
Create new instance
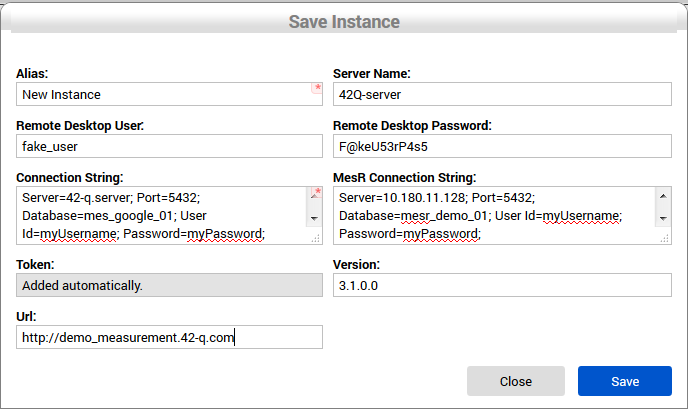
To install a new instance in a site, go to the Instances module and click the New button at the top right.
Measurement displays the Save Instance screen.
Figure 11
At a minimum, the mandatory fields must be completed.
The fields for the Save Instance screen are: Alias: An organizational name given to a instance to identify it on the tool. Server Name: Server name configured on the OS from the Measurement server that is configured with the given instance. Remote Desktop User: Username on the server used to remote connect on the desktop. This is used if necessary to access for the purpose of troubleshooting. Remote Desktop Password: User password to remote connect on the desktop. This is used if necessary to access for the purpose of troubleshooting. Connection String: Measurement database connection string used to run Measurement configuration modules. MesR Connection String: MESR (MDS Replication) database connection string used to get MDS data, such as process, defect codes, and other information. Token: Automatically-generated unique identifier. Version: Core version. URL: Url of the instance.
Click the Save button when done to save changes, or click the Close button to abandon changes. Upon clicking the Save button, Measurement will display the new instance on the list.
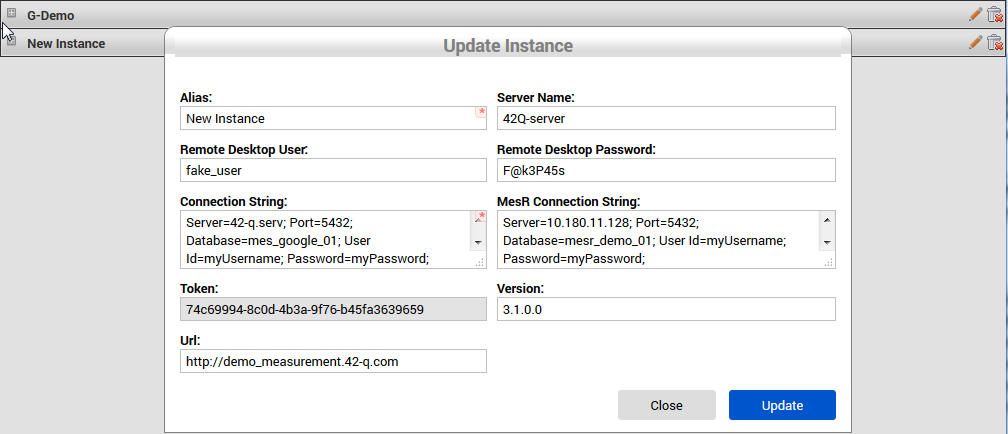
Edit an instance
To change an instance value click the Edit (pencil) button at the right side of the instance item. Measurement displays the Update Instance screen with allowable fields to modify.
Figure 12
Click the Update button when done to save changes, or click the Close button to abandon changes. Upon clicking the Update button, Measurement validates the changed values, stores the data(if valid) and refreshes the instances list after closing the Update Instances screen.
Remove an instance
This feature is used when a Measurement installation is no longer necessary in a plant or is merged between installations. An instance removal does not erase any test result data from the Measurement database. Removing an instance only removes the web access to this database. If it is necessary to erase measurement or parametric data, the user is advised to contact the Measurement support team.
To remove an instance from the list, click on the Delete button at the right side of the instance item.
A confirmation box is displayed. If the operation is confirmed, then the Instance is removed from the list and from the Measurement database. List items are refreshed without the removed Instance.
Configuration
Parser
List parsers
This module shows all parser applications that are installed and their status. Every line on the parser’s list represents a parser instance. There can be multiple instances of the same parser pointing the source test data to different paths. This is helpful when there is a need to segregate lines, or increase processing performance by having two or more parsers running in parallel and processing different files concurrently.
To access the Parser module from the main menu, go to Shop Floor Control > Configuration > Meas Config and select the Parser icon.
Figure 13
Search parser
In order to manage and quickly find a specific parser on the list, there is a search mechanism at the top of the parsers list. After clicking the Expand button, the fields available for filtering the list will be shown.
Figure 14
Searches can be filtered by Parser Name, Customer, or for only Enabled/Disables parsers. After filling one or more filter fields, click the Search button.
Create a new parser
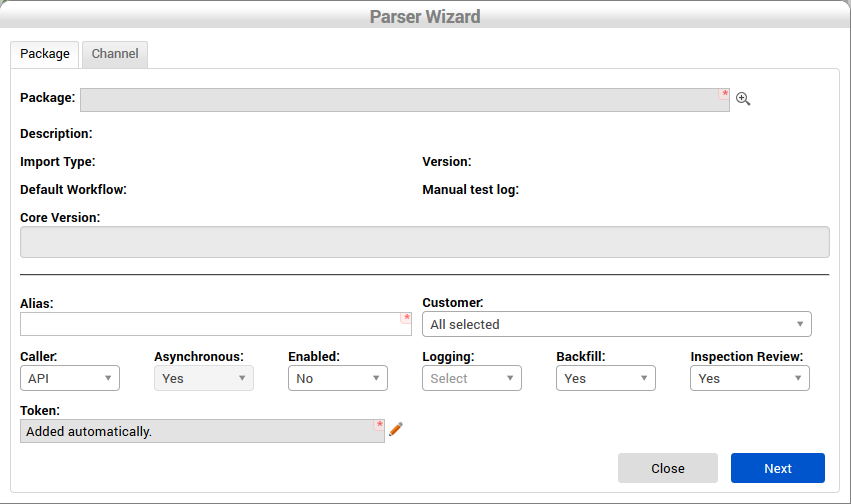
To create a new parser, click the New button for the Parser Wizard at the top right on the screen. This will open the Parser Wizard screen. At a minimum, the mandatory fields must be completed, then click the Next button to go to the next screen, or click Close to abandon changes.
Figure 15
The fields for the Package tab are:
Package: Click the Choose Package button to get to the Package Wizard screen. This field populates the Assembly Name field on the Parsers screen, and is the fully qualified name from the parser file, including its extension.
Alias: An alias to the parser, this will help identify this parser instance on the parser screen.
Customer: Used to identify from which customer the automated line is processing their products.
Caller: Set how the parser will run. Local: Set the parser to be run from Measurement Core. Remote: Set the parser to be load from other parser.
Asynchronous: Identify if the parser will process multiple serial number in parallel on SFDC.
Enabled: Set the parser to run or stop.
Logging: The user can set logging to all, info, or debug information.
Backfill: Select whether or not to load historical data.
Inspection Review: Toggle inspection review on or off.
Token: A unique identifier string associated to a parser instance.
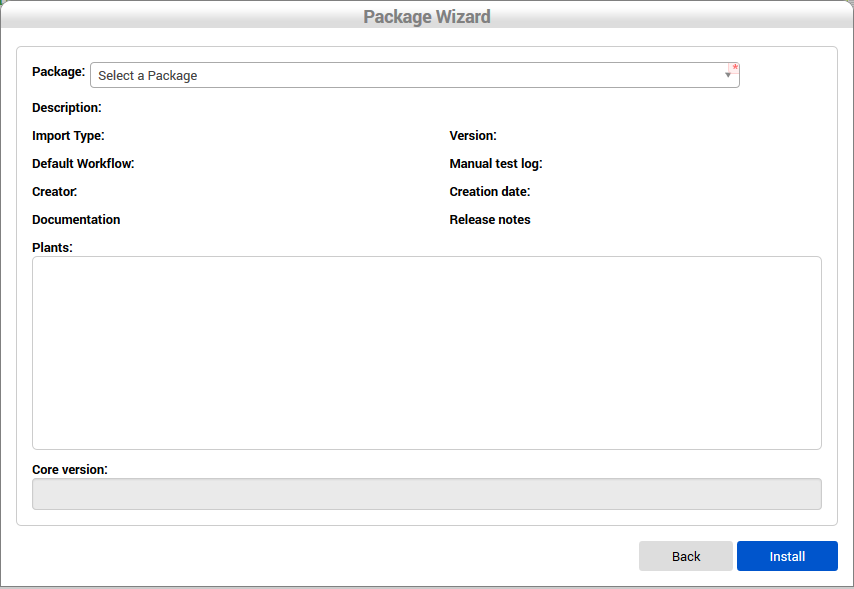
Click the Choose Package button to load the Package Wizard screen.
Figure 16
Select a Package from the drop-down list. Click Install button to install, or Back to exit back to Parser Wizard. These fields are automatically populated:
Core Version: The 4 digits version from Measurement application this parser was deployed to run.
Parser Version: 4-digit version number from this parser assembly file.
Import Type: Informative data to identify the import mechanism the parser uses.
Default Workflow: Technical option set by the developer to identify the parser to run in a default workflow (Import data, Parse to measurement data, send unit information to SFDC, store parametric data, release the file to out folder).
Click the Install button to go to the next screen, or click Back to abandon changes.
The fields for the Channel tab are:
In Dir: The fully qualified path the parser will use to collect test result files.
Out Dir: The fully qualified path the parser will use to store the processed test result files.
Error Dir: The fully qualified path the parser will use to store the test result files that failed while being processed.
User Name: Optional user name required to access file system
Password: Optional password required to access file system
Extension: File extension the parser will use to locate files in the In Dir (e.g *.txt. parser will collect from In Dir only the files with txt extension.
Click the Update button to save the parser and reload the parser’s list screen. Click the Close button to abandon changes, or Click the Back button to return to the Package tab.
Enabled / Disable a parser
Measurement Core application is configured to run the parser every x seconds like an alarm clock, which means all enabled parsers will run when this alarm trips. There are situations in the shop floor when a line is under maintenance, or the stations are being calibrated/adjusted, or SFDC is being updated and it is undesirable for the Measurement parser to process test result files for a while. In this case, there is a quick way to enabled/disable a specific parser.
On parser’s list screen, there are a few actions to perform for a specific parser without having to edit them.
Figure 17
The Disable button is the Enabled/Disabled parser action. This button becomes red or green depending on the parser’s current status. In the example, this parser is currently enabled since the parser’s name on the title is green (it becomes red when it is stopped).
After clicking, the button becomes green, which means it can be enabled. Also, the parser title becomes red, indicating that the parser is currently disabled.
Edit a parser
Managing test stations, defect mapping, dynamic configuration or even parser status do not require the parser to be in edit mode in Measurement application. However, if a characteristic or source paths requires change, then the parser needs to be edited.
Note: when editing an enabled parser, the changes will only take place when they are confirmed by clicking the Save button. Meanwhile the parser is running with the current configuration set. To edit a parser, click the Edit button.
Measurement opens a Parser Wizard screen and the screens follow the same process as “Create a new parser” (see section above)
Delete a parser
Generally a parser is used for a specific line, product or customer. When a customer moves their production to a different company, or the product line changes and the parser is no longer necessary, the parser can be deleted in order to not have a application running with nothing to process. It is also beneficial to keep the parser’s instance list better organized. When removing a parser, all the data this parser has created will not be deleted. Data such as parametric data, test result activities, and their station’s devices will be available for other stations to be used.
There is also an action called Restore that brings back the parser to run again. However, this action can only be performed by Global Administrator users.
Clone a parser
This feature allow the user to create a new instance of a parser based on an existing one. All configuration items with their current values are copied (station groups, defect mappings, etc.) When cloning a parser, all stations are set with device as -1 value on the copied one, this will ensure not having SFDC device collisions. After clicking the Clone button, a new instance with same parser name will show on with the original name plus a “- Copy” text. Also, the In Dir, Out Dir, and Error Dir properties receives a “_new” suffix in order to avoid source path collision between parsers.
Figure 18
Restore a parser
This feature allows the user to restore a deleted parser. A parser is not physically removed when this operation is performed. All data continues to be stored on CPR database, however, this data is not used for other parsers. The Restore button is only available for removed parsers, and only Global Administrator users are able to perform this action.
FIgure 19
After clicking on Restore button and confirming in the dialog box, the parser no longer has the name strike-through, and it is ready to be enabled again.
Figure 20
Parser Configuration Groups
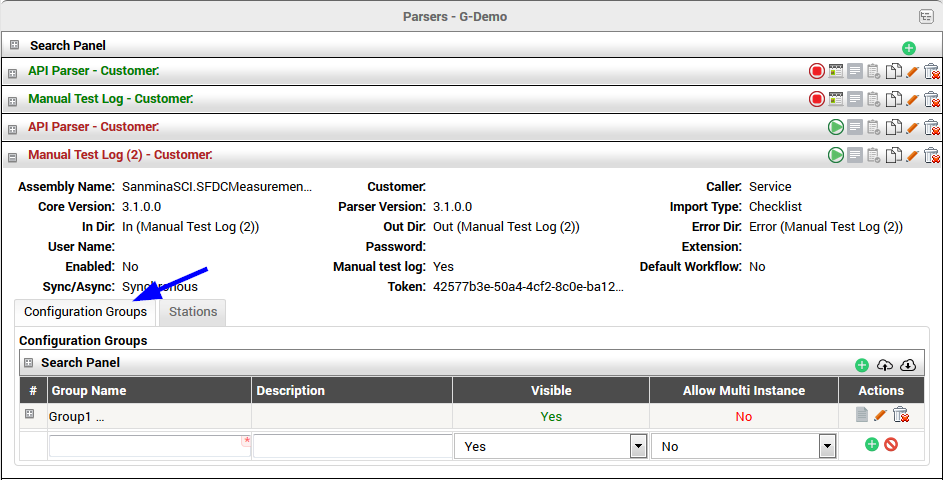
A parser has a well defined workflow structure based on inbound processing, optionally integrated to SFDC, and outbound information. Due to customizations depending on customer requirements (line differences and technical integration issues) it is necessary to have a place to store additional configuration items and values. This is purpose of the Configuration Groups. To see the Configuration Groups for the parser, click the Configuration Groups tab at the bottom of parser’s information.
Figure 21
Search Configuration Groups
In order to manage and quickly find a Configuration Group on the list, there is a search mechanism at the top of the Configuration Groups list. After clicking the Expand button, the fields available for filtering the list will be shown.
Figure 22
Searches can be filtered by Group Name or Item Name. After filling one or more filter fields, click the Search button.
Creating a Configuration Group
The fields for the Configuration Group are:
Group Name: Name to associate with this group, mandatory field.
Description: Optional field to add more detail or purpose for the Configuration Group.
Visible: Drop down Yes or No list. Default is Visible - Yes.
Allow Multi Instance: Drop down Yes or No list. Default is No.
Figure 23
Enter values for the new Configuration Group and click the New button to insert the record and open a new line for additional group entry. Or, click the Cancel button to abandon entry.
Edit a Configuration Group
To edit a Configuration Group, click the Edit button on the right side of the group. After edits are done, click the Update button to save change, or click the Cancel button to abandon change.
Delete a Configuration Group
To delete a Configuration Group, click the Delete button on the right side of the group. A dialog box will appear prompting to confirm or cancel the delete.
Add Configuration Items to a Configuration Group
To add Configuration Items to a Group, click the Configuration Items button on the right side of the group. This will open a screen to add Configuration Items to the group.
Figure 24
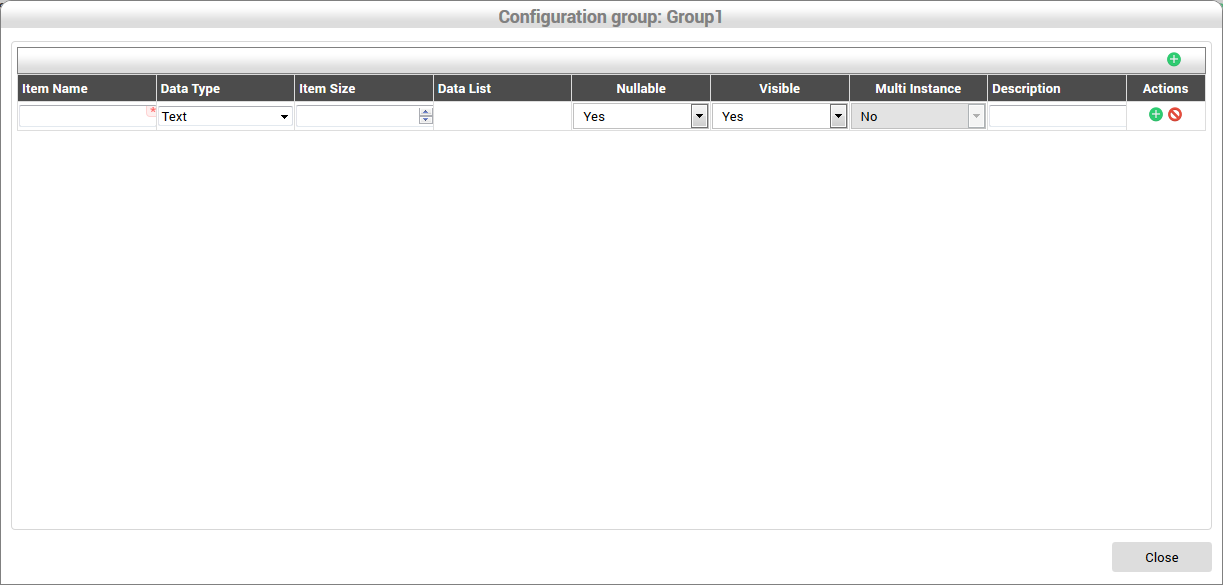
The fields for the Configuration Item are:
Item Name: Name to associate with this item, mandatory field.
Data Type: Drop down list of data type expected for this item. The selection on this list controls the behavior of the Item Size and Data List fields. Possible values are: Text, Boolean, Integer, URL, DropDownList, ListBox, Decimal, Date, KeyValue, List, KeyList, Password.
Item Size: This defined the length of the Data Type value and is editable only for certain types.
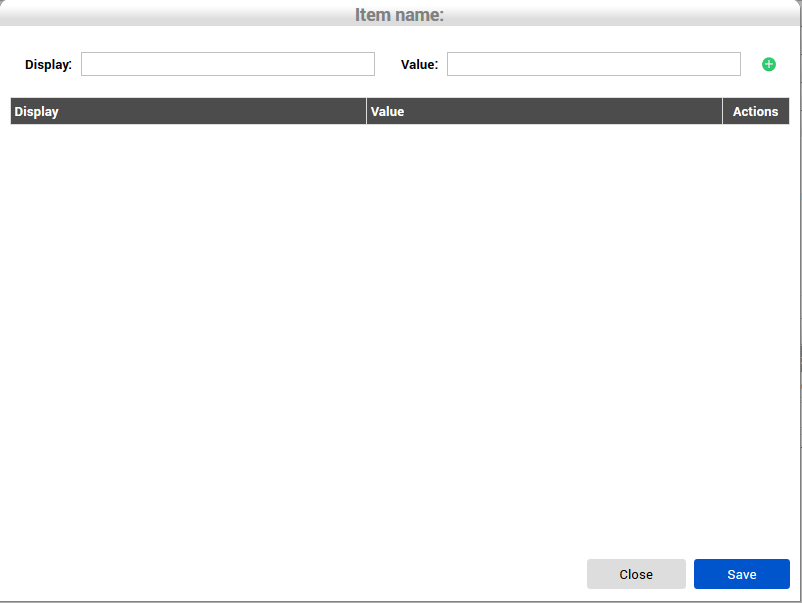
Data List: This is where lists are created if the Data Type is a list type. If this button appears on the field, then click it to define the list items. (See Data List definition screen below)
Nullable: Drop down Yes or No list. This defines whether or not an incoming value for this item can be a null value. Default is Yes.
Visible: Drop down Yes or No list. Default is Yes.
Multi Instance: This Yes/No drop down is editable only for certain Data Types.
Description: Optional field to add more detail or purpose for the Configuration Item.
Data List definition screen. Enter values for the list to contain. Click the Enter/New button to add the values to the list and prompt for another entry.
Figure 25
Entered items are shown in the list box. Click the Edit button to change a list value, or the Delete button to delete an entry. A dialog box will appear prompting to confirm or cancel the delete. When done with entering the Data List items, click Save to save changes, or Close to abandon changes. Saving or Closing will return to the Configuration Item entry screen.
Enter values for the new Configuration Item and any Data Lists, then click the New button to insert the record and open a new line for additional item entry. Or, click the Cancel button to abandon entry. When done with entries, click Close and Measurement will save all entries.
Edit Configuration Items in a Configuration Group
Configuration items previously entered can be edited by clicking the Edit (pencil) button to the right.
Figure 26
Make necessary changes and click the Save button to save changes, or click the Cancel button to abandon changes.
Figure 27
Delete Configuration Items in a Configuration Group
Configuration items previously entered can be deleted by clicking the Delete button. A dialog box will appear prompting to confirm or cancel the delete.
Figure 28
Parser Station Groups
Station groups are a way to group the Measurement test stations items which have the same AutoSFDC. Also, the stations share the same defect mapping groups associated to their group. There are a few rules to maintain the stations between groups in Measurement in order to avoid SFDC device collisions:
- Two station groups cannot have the same name associated to the same parser.
- A station group can be associated to only one AutoSFDC.
- A station can have just one device, and this device should be unique between all stations from different station groups associated to the same AutoSFDC.
- Multiple stations can be assigned to the same device ID within same parser when parser is synchronous.
- A station name should be unique per parser, even being associated to a different station group.
Search station
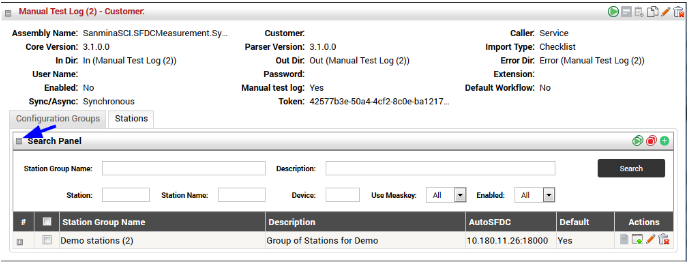
In order to manage and quickly find a specific station group or station on the list, there is a search mechanism at the top of the station group’s list. After clicking the Expand button on the left of Search Panel, the fields available for filtering the list will be shown.
Figure 29
After filling one or multiple filter fields click the Search button. To unfilter, erase the search boxes and click the Search button again.
List station group
On the Stations tab inside parser information group, there is the list of stations grouped by their Station’s group sections. There are a few operations to perform on this list that are available on the right side of each station row. Each of them are described in a separate topic in this documentation: Defect Mapping Groups, Station Bulkload, Edit and Delete stations.
Figure 30
Enable/Disable all stations on group
This feature is generally used when there is a need to stop the production line a few minutes for maintenance or a quick test. This action stops or enables all stations from a specific group. On the image below, the red arrow indicates the stop all stations icon and the blue arrow points to the enable all stations button.
Figure 31
Add new station group
To add a new station group, click the New button on the search panel inside the Stations tab on a parser.
Figure 32
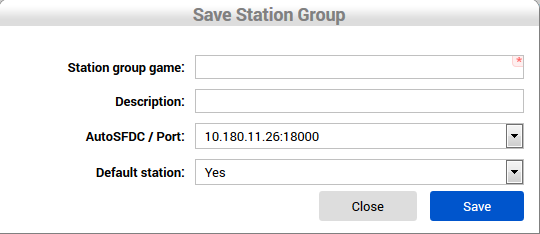
Measurement loads the Save Station Group screen in order to fill the station group information.
Figure 33
Each Station group must have an AutoSFDC attached. Which means all stations inside this group will be validated against this AutoSFDC, including the defect mappings (defect codes), devices and process.
After clicking on Save, Measurement will validate the input data, save the station group information, and update the station group list on parser’s list screen.
Edit a station group
Measurement currently offers the ability to change name and description fields from a station group item. The AutoSFDC information is currently locked due to data security matter to avoid SFDC communication using unknown defect codes or device collision between parsers having stations with same devices on same AutoSFDC items.
To edit name and description from a station group, click the Edit button.
Figure 34
Measurement opens the Update Stations Group screen, which is similar to the add station group screen, just having the title name different. Change the name and/or description and click on Save button. Measurement will reload the station group list with the updated one.
List defect mapping groups from a station group
Measurement is able to use defect code mappings to send specific SFDC defect codes based on tester defect code, or use a single generic defect code if the customer prefers. To see all defect mapping groups from a station group, click the Show Defect Mappings button in the Action column in front of each station group.
Figure 35
Add a defect mapping group to a station group
On the Defect Mapping group list screen, click the New button at the top of the Defect Mapping list screen.
Figure 36
Measurement loads the Defect Mapping list screen with the form opened on the last line of the list. After typing the Defect Mapping Group Name and optionally the Description, click the Insert button. Measurement will save the new group.
Figure 37
After inserting the measurement group, defect mapping items can be added. Click the Expand button on the left of the Defect Mapping Group, and click on New button at the Defect Mapping group item.
Figure 38
Measurement loads the defect mapping item screen. Enter the Tester defect code and select an existing SFDC defect code on the right side and click on Insert button.
Figure 39
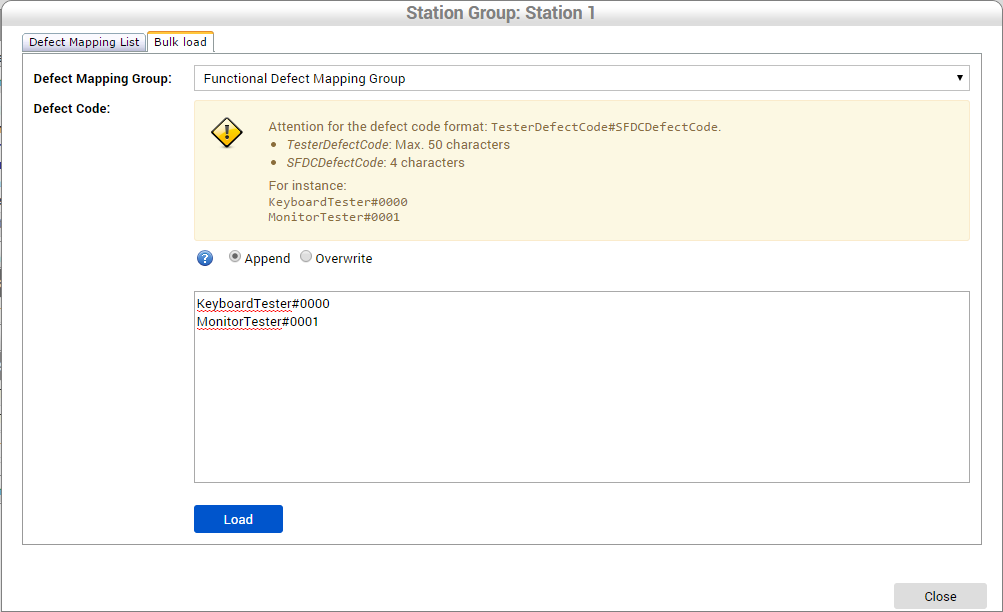
Bulkload defect mapping items to a defect mapping group
If there are multiple defect items to add, use the Bulk load feature to insert all of them at once. On the Defect Mappings screen, click on Bulk load tab at the top of the screen. Choose an existing defect mapping group(could be an empty defect mapping group) and select the bulkload mode (Append or Overwrite). Append mode means that Measurement will keep the existing defect mapping list and include this new item to this list. Overwrite mode will remove all existing items and then will add the ones on the list. The mapping should be one per line, and separated using the # char between the tester defect code and the SFDC defect code.
Figure 40
After typing all defect mappings items, click on Load button. Measurement will check for existing defect mapping items and validate if the SFDC codes exists in MDS. If they are valid, Measurement will save the defect mapping items and show on the list all defect mapping items inserted and with error.
Figure 41
Station
Station Mapping module is built based on a lookup record concept, used to link a test station name to a SFDC device number. It allows different test station names from several customers and brands to be connected dynamically to SFDC/MDS Locations/Workstations. Device link also allows Measurement to leverage multi-pass data collector feature being able to use a single device to more than one station.
List stations
To list all stations from a station group, click the Expand button on the station group row and Measurement will display the test station’s list.
Figure 42
Station does not have a dedicated search inside the station group box. However, Measurement allows the user to search for a station on a parser level, using the Search Panel at the top of the station group’s list. The result set is segregated into station groups.
Add a station
To add a new station, click the New button. Measurement will load the Station form.
Figure 43
Fill out all mandatory fields, and then click Save. Measurement will validate the data and insert this new station into the group. The station’s list screen is reloaded with the new station inside.
Station Group: Name of the group to which the station will belong. Station ID: This is the station identification. Measurement parsers use this field to match a station and device mapping from a test result data test station identification. Device: The SFDC device number which Measurement will use to communicate to SFDC when using this Station mapping. SFDC Defect Code: If there is no defect mapping found for the defect being recorded, Measurement uses this default defect code on SFDC to fail a unit. Comments: This is a generic field to be used on parser. Commands: This is a generic field to be used on parser. Enabled: Set the station to be used or not while processing a test result data. AutoSFDC: The SFDC PC which this parser uses to send data. Name: A station name identification, like an alias, to be used on a station. Badge: The default operator to be used to login on SFDC in case this information is not provided on the test result data. Process: The MDS process to which the test station belongs. This is used for recipe creation and Checklist module to identify the recipe. Arguments: This is a generic field that is used on a parser. Use Autolog: Configure station to not perform any SFDC communication. Use Measkey: This sets the parser to send/not send the MEASKEY command to SFDC. When set to Yes, Measurement sends the MEASKEY command to SFDC and links this MDS Activity to Measurement parametric data generated by this test. Doing so makes Parametric data viewable inside the Unit History report on MESWeb.
Edit a station
To edit a station, at the station’s list on station group section, click the Edit button at the right side on the station row.
Measurement will load the station edit screen, similar to “Add a station” above. After changing the values, click on Update button. Measurement will validate the information and save the station if the data is consistent. Measurement reloads the station’s list showing the updated station data.
Enable/Disable a station
A station can be associated to a parser in an inactive mode, which means the parser will not use this station mapping to communicate to SFDC. To enable a station, click on the Start/Enable button on Actions column from the station row. To stop a station, click on the Stop/Disable button.
After clicking on the icon, it changes to the opposite action. For example, if the station is disabled and the Enable button is clicked, it will switch to the opposite action, and vice versa.
Delete a station
The operation to remove a station can only be performed if the parser did not generated any activity using this test station. If it is necessary to free up a device, or use it in other station, the station can be disabled and the device can be used at another station. To remove a station, click the Delete button and confirm the operation. If this station was not used it will remove the entry and reload the station’s list without the removed one.
Move a station
If a station needs to be moved to another Station Group, click the Expand button on the left of Station Group, check/select the Stations to move, and then click the Move Selected Stations button.
A pop-up window will be shown in order to perform the referred operation. Select the new Station Group and click the Move button.
Note: If Measurement has processed a test file with a station that is not configured yet, Measurement will add a Station Group named “Non configured stations” (if not created before) and include station in this group.
Tooling
The Tooling module can be used to maintain manufacturing floor equipment. It is useful for keeping track of maintenance and calibration dates. Tooling can also be used to track equipment usage.
For example: If there is a need to track the number of times a piece of equipment was used during testing because there is a limited number of times it should be used before being calibrated (e.g. test sockets), then a tool can be entered here to track the hits. When a test result is process through Measurement for this equipment, Measurement can increment the Actual Hits and send an email alert when a warning level or threshold level has been exceeded.
To access the Tooling module from the main menu, go to Shop Floor Control > Configuration > Meas Config and select the Tooling tile.
Tooling has a search mechanism which also works as a filter. To search for a specific tool, click the Expand button to the left of Search Panel at the top of Tooling list.
Enter the Tooling ID and/or Station information to search by and click the Search button.
To add a new Tooling record, click the New button.
This screen will appear to enter Tooling information:
The fields for the Save Tooling screen are: Tooling ID: Mandatory field should be a unique value to identify equipment. Tooling Name: Name of equipment Revision: Revision of the tool. Type: Type of tool Owner email: email address of recipient to receive alerts when thresholds or warnings have been hit. Last email date: System generated when an email has been sent Threshold: Maximum times the equipment should be used before being calibrated. Warning level: Number of times the equipment can be used before sending a warning email. This number should be less than the Threshold to give time to calibrate. Actual hits: System populated field Last date: System populated date the equipment was last used Calibration date: Date of last calibration Maintenance date: Date of last Maintenance Validation date: Date maintenance or calibration was validated Description: Description of the tool.
After all values have been entered, click the Save button to save changes, or click the Close button to abandon changes. Additional Tooling type values for the drop down list can be entered by clicking the New button on the right side of the Type field. A Tooling Type screen will appear to add new types, edit existing ones, or delete an one that has no activity. Click the Close button to exit.
Edit Tooling Items
To edit a Tooling item or see associated station and hit count history, click the Edit button.
The Update Tooling screen will appear:
This screen is for editing any of the Tooling values not automatically generated. Also, there are tabs to see additional information about the Tooling, Associated Stations and Hit Count History. Click the Update button to save changes, or click the Close button to abandon changes.
Reset Hit Count
To reset the actual hits value, click the Reset Hit Counts button. This operation is typically after a calibration.
The Reset Hit Counts screen appears prompting for a comment (optional) before submitting. Click the Reset Hit Counts button to reset the actual hits value, or click the Close to abandon change. Clicking Reset Hit Count will show a dialog box prompting to confirm or cancel the reset.
Delete Tooling Items
Tooling items can be deleted by clicking the Delete button. A dialog box will appear prompting to confirm or cancel the delete.
Note: A tooling record cannot be deleted once it has activities associated to it.
SFDC Configuration
The SFDC Configuration module is responsible to configure the SFDC/MDS servers to be used by parsers to communicate to SFDC (sending commands based on test result) and map MDS Servers to be used in defect mapping module as well. SFDC Configuration lists are stored in a Instance level, which means the same SFDC Configuration item can be used by different station groups in different parsers.
List SFDC Configuration items
To access the SFDC Configuration module from the main menu, go to Shop Floor Control > Configuration > Meas Config and select the SFDC Configuration tile.
Note: Only Instance Administrators can change SFDC Configuration information.
Measurement loads the AutoSFDC list screen.
Add a SFDC Configuration
To add a new SFDC Configuration item, click the New button at the top of the SFDC Configuration list screen.
Measurement loads a new entry at the bottom of the SFDC Configuration list table.
Type all mandatory information and click the Insert button. Measurement will validate and save the SFDC Configuration information and reload the SFDC Configuration list with the new item.
SFDC PC / Conduit Name: The IP Address or DNS entry of the SFDC PC. Port: The TCP port connect on the SFDC PC. Default value is 18000. Prefix: Field not used. Project: Select the MESR project in which Measurement will load Process and Defect Code lists. Server Type: Select a server type from the drop down list Net User ID / MDS API: This is used to store the AppServer to retrieve MDS data. In a Cirrus based MDS, add the MDS Open API REST based. For the Legacy MDS version, use the AppServer url. Description: Enter a description for this SFDC Configuration.
Edit a SFDC Configuration
To change any SFDC Configuration value, click the Edit button related to the SFDC Configuration item row at the right side in the Actions column.
Measurement opens the SFDC Configuration item for editing, making all fields available for change. Change the data and confirm by clicking the Save button. Measurement validates and store the data, then reloads the SFDC Configuration list with the updated information.
Remove a SFDC Configuration
Removing a SFDC Configuration item is only possible when there no Station Groups associated with this item. To remove a SFDC Configuration, click the Delete button located in the SFDC Configuration item actions column.
After clicking the Delete button, Measurement prompts with a confirmation message. After clicking the OK button, it checks if any Station Groups are using this SFDC Configuration. If not, then the SFDC Configuration is removed from the application.
Search SFDC Configuration items
SFDC Configuration has a search mechanism. Click the Expand button to show the Search Panel box. Type the SFDC PC, Prefix and/or Description and click on Search. Multiple fields Can be used on the search. After clicking on Search button, Measurement will load the list of SFDC Configuration items matching the search criteria and refresh the SFDC Configuration list.
Click the Clear button to clear the search values, then click the Search button to see all results.
Recipe Maintenance
Measurement extracts recipe information (sequence, specs, etc.) from test equipment output, or from a file/repository.
In some situations it is necessary to create recipes to manage specific scenarios, such as calculated columns based on other steps from the same recipe, or creating a checklist and collecting test equipment data offline that has been manually entered by an operator.
Note: A user must have access as an Instance Administrator or higher to access this module. Accessing Recipe Maintenance
To access the Recipe Maintenance module from the main menu, go to Shop Floor Control > Configuration > Meas Config and select the Recipe Maintenance tile.
The initial Recipe Maintenance screen will load all existing manual recipes with their information and current status. There can be multiple versions of the same recipe by changing its specification items, such as parametric measurement groups and items.
� The first screen displays the top 50 records. To view more records or filter the search click the Expand button at the left of Search Panel.
There are several search fields available to change criteria. The Top Records slider can be increased from the default 50 to 200 records. Click the Search button to find records matching the specified search criteria, or click Clear to reset the values.
Create a new recipe
To create a new recipe click the New button at the upper right corner.
Note: Recipes are unique by part/process combination.
The part number field value can also be a “Part Family.” This is helpful when all or most of the parts are in the same family and use the same recipe. It is possible to have most parts in a family use one recipe while others may use different ones. When processing test results, Measurements first looks for a specific (part+process)/recipe combination. If it does not find a match, it then looks for the (part’s family+process)/recipe combination. This feature reduces the number of recipe records to create.
After clicking the New button, Measurement creates a row at the bottom of the list to add the Recipe header information and Group information.
Enter information in the following fields: Recipe Name, Part Number, Process, Parser and Group Name. These are mandatory fields.
Recipe Name: An identifying name for this recipe. The name is not unique since there can be different versions of the same recipe. Part Number: Part Number this recipe is targeted to test. A recipe can be associated with one Part Number or one Part Family. To have multiple Part Numbers using the same recipe specification, create a clone of this recipe and change the Part Number of the newly cloned one. Revision: This field is automatically incremented every time an existing recipe is cloned and the clone keeps the Part Number and Process from the original one, or a new recipe is created using an existing Part Number/Process pair. ECO: Engineering Change Order, this is an informative field to associate this recipe to a change order specification in PLM. Process: Mfg Process in which this recipe will be used. This is also used to filter the list of test stations where this recipe can be used. Parser: Select the parser associated with this recipe. If the Type is MTL, then the Parser value should be Manual Test Log. Type: Represents the type of recipe. Note: this value cannot be changed after recipe is created. Click the Information button for details on the Types. Possible Type values are ATE (Automated Test Equipment, MTL ( Manual Test Log), TPI (Test Program Interface) Evaluate: Check this option to have Measurement evaluate data input and make decisions on each test step status based on recipe specs (limits) and comparators while using the recipe. If measured value matches recipe specs and comparator, then PASSED, otherwise FAILED. When this option is unmarked, Measurement will only store the measured value (everything will be disregard and units will always PASS). Default value is No. Show Comparators: This field is automatically populated with Yes if comparator values are entered on the Test Steps. See below for more information on Comparators. Default value is No. Comments: Informative field. Creator: Automatically collected: logged on user creating this recipe. Creation Date/Time: Automatically collected: timestamp of creation. Enabled: Recipe activation status. When False, this recipe will not be loaded by Measurement at Manual Test Log module. Only one Recipe can be enabled for a particular Part Number/Process pair at a given time. Order #: This is the first field in the Group row. The user can set the order of the Test Group to be displayed in the checklist module. Group: Name of the group. This is a Mandatory Field Group Description: Brief description of the test group. Repeat: This field is used to set how many times the Group can be repeated.
After Recipe header information and mandatory Group Name is entered, click the Save button to enter Test steps, (or click the Cancel button to abandon changes).
At this point there are several options available:
Click the Cancel button on the Recipe header to abandon the recipe changes.
Click the New button on the Group level to create another Group.
Click the Edit button to edit the Group Name or Group Description.
Click the Delete button  to delete the Group.
Click the New button on the Test Step level to create another Test Step.
Click the Save and Install button to save the recipe as enabled.
Click the Save button to save the recipe but do not enable it. Useful when needing to come back later and finish the entry.
Enter a Test Step.
Note: A recipe must contain at least one test step for it to be installed. It can be saved without a test step but a warning will appear:
Enter Test Step information in the following fields. At a minimum, Step Name, Type and Comparator are mandatory fields. Each test step represents a test scenario in which Measurement will store collected parametric data.
Step Name - Test Step Name, should be unique per Group and is a Mandatory Field. Step Description - Brief description of the test step. Add Detailed Description - Clicking this button will open a dialog to enter additional information. Text, bullet point lists and images can be inserted in this dialog.
Units - The unit of measure. Type - Available values are Input, Expression, Fetch and Procedure. Click the Information button for details on the Types. Type Details - Depending on the value selected in the Type list the button located here becomes active to add additional information. If the Type is Expression, then this dialog will appear when the button is clicked.
If the Type is Fetch, then this dialog will appear when the button is clicked.
If the Type is Procedure, then this dialog will appear when the button is clicked.
Comparator - This is the comparator semantic used to evaluate the measured value against limit boundaries. Click the Information button for details on the Comparator. Available comparator semantics are:
Low Limit - Used as the lower limit comparator to evaluate measurement value. Low Limit cannot be greater than High Control Limit. High Limit - Used as the higher limit comparator to evaluate measurement value. Low Control Limit - Low Control Limit cannot be greater than High Limit or High Control Limit. High Control Limit - High Control Limit cannot be less than High Limit or Low Control Limit Tooling Type - Select Tooling Type if applicable. Expected - Used to equally compare the measured value. Repeat - How many times this limit will appear in this Test Group. Mandatory - Used to require the operator to fill measured value for this step. Show Comparators - To set if the Low and High comparators should be shown on the checklist.
After entering the Test Step data, click the Save button to save the information, or click the Cancel button to abandon entry.
After saving the Test Step there are several options available:
Enter another Test Step.
Enter another Group.
Click the Save and Install button to save and enable the recipe.
Click the Save button to save the recipe but not enabled.
Click the Upload Work Instruction button.
Click the Edit button to edit the step just entered.
Click the Delete button to delete the step just entered.
To add a Work Instruction to the Step, Click the Upload Work Instruction button. Click the Select Item and use the Windows explorer to select a file. Click Upload to save the image, or Close to cancel the entry.
Clone an existing recipe
One of the features of Recipe Maintenance module is to clone an existing recipe. This is used when there are different steps from the same recipe varying per part number, or as a time-saver when most of the steps from a different product are the same. Due to traceability constraints Measurement does not allow editing of a recipe that was used to process an unit. In order to change it, a new one needs to be created based on the original one. This is done by cloning the recipe and changing what is needed, if the Part Number and Process are the same as the old one, then the Revision number will be incremented. When enabling the new one, the old recipe will be automatically disabled, and will not be usable anymore.
To clone a recipe, click the Clone button in the Actions column of the recipe to clone.
`
After clicking the Clone button the newly created recipe field will be shown at the bottom with information already filled from the cloned recipe. This information can be edited.
Edit the values on the clone record and click Save and Install to save and enable the recipe, or click Save to save but not enable the recipe. In this example the Test2 recipe was cloned to create Test2a with a different Process.
Enable / Disable a recipe
A newly created recipe can be saved but not enabled. It is not available to test units until it becomes enabled. This works as a mechanism to avoid the need to finish the recipe creation at once, or to be able to review the recipe before any operator starts using it.
After a recipe is enabled, it is available to run tests.
To enable a recipe, click the Enable button. To disable to recipe, click the Disable button. Note: A recipe with a newer revision cannot be enabled.
Operations
Activity Monitor
The activity monitor is the module where all the units that have been processed by the Parsers can be viewed. In this module it is possible to check all the details related to the serial numbers (activities) such as parametric data information, test stations where a unit was tested, activities that were sent to SFDC successfully and/or waiting to be inspected and activities available to be reprocessed. Users can set multiple activities with SFDC errors to be reprocessed. Also, there is a link between the serial number being shown and MESWeb. The user can click on the serial number link and Measurement will open MESWeb Unit History report with this serial number history.
To access the Activity Monitor module from the main menu, go to Production > Measurement and select the Activity Monitor tile.
List activities
Upon opening the activity monitor page, Measurement automatically loads the first 50 activities from the instance ordered with the most recent activities at the top. The columns and definitions are: Serial Number: Represents the processed unit serial number. This is also a link to MESWeb Unit History report related to this serial number. Test Station: The configured Measurement Test Station which processed this serial number on SFDC. Slot: Test station slot. Badge: The operator used to communicate on SFDC. Test Time: The time this unit was processed on Measurement. Status: The overall test status. Possible status are: PASSED: Unit has passed the test. FAILED: Unit has failed the test. KNOWN GOOD :It is an activity of a golden unit—a perfect unit that ensure the test equipment is working well. ABORTED: Test was aborted but an activity could be generated. IGNORED: Test data is invalid but an activity could be generated. NOTEST: Test is incomplete due to temporal or equipment limit conditions. ERROR: There was an error on the test equipment and the test could not be completed successfully. Autolog Message: A message indicating the current status of the unit on production, an error that occurred after parsing the activity, or a message indicating that the parser is waiting for an external action before continuing the SFDC communication. Autolog Status: The status of the parser communication with SFDC. Possible status are: SUCCEEDED: The communication was successfully performed and SFDC has accepted all commands. It does not necessarily mean that the unit has passed. ERRORED: There was an error with SFDC communication. It may be caused by Flow Error, Device In Use, or any other input error. Whether the error it is, Autolog Message column will have the SFDC message. WAITING INSPECTION: Activity has been successfully processed and is waiting to be inspected before SFDC communication is performed. INSPECTED: Activity was inspected and is waiting for its parser to process it the next time it runs. PENDING: Activity is waiting for its parser to process it the next time it runs. MANUALLY SKIPPED: Communication was not performed due to an action a user has made, like skipping the activity on Inspection Review. AUTOMATICALLY SKIPPED: For some reason, parser decided that SFDC communication should not occur. Generally, it is specific to a customer implementation. NOT APPLICABLE: Activity is not eligible to be logged on SFDC. The main reason is that its test station is not configured to communicate with SFDC. BUFFERED: SFDC communication is in the queue to be performed. IGNORED: Activity has invalid test data or test station is not proper configured to move on SFDC.
Search activities
Activity Monitor has a search mechanism which also works as a filter. To search for a specific test result data or sequence of test results, click the Expand button to the left of Search Panel at the top of activity monitor’s list.
Multiple filters can be combined. The possible filters are: Serial Number: Search for activities from a serial number specific, it does not search for partial text. Parser: Only activities processed by the selected parser. Top records: The latest selected number of activities. Autolog Status: Only the activities which have their communication to SFDC status equals the selected one. Start/Stop: When enabled, Measurement reloads this search based on the number of seconds set on this field. Station: Only activities processed using the selected stations. Multiple stations can be selected. Autolog Message: Search for a specific part of the message. Since this is a text comparison, the result could take some time to return. Status: Filter activities which have their overall test status equals the selected one. Customer: Filter activities from a specific customer. Only one customer is allowed. Date: Results can be filtered by a start and end date. Process: Test process.
How to see activity details
Measurement is designed to collect parametric data from test results. To see all information collected and processed by Measurement from a specific serial number, click the More Details button in the Actions column from a specific activity row.
Measurement opens the activity monitor info page from the respective selected activity. All information such as process time, AutoSFDC status, duration and all parametric data collected and status are shown on this page.
Additional Parser and Test information can be seen by clicking the Expand buttons to the left of Parser Info and Test Info.
By default, the screen displays information in the Measurements tab. There are two more tabs, Dynamic Properties and Audit Trail, with additional information. This is the Dynamic Properties tab information:
This is the Audit Trail tab information:
Re-run a process failed activity
This feature allows the operator to reprocess an activity that failed while communicating to SFDC. It’s possible that SFDC could be unresponsive or down due to maintenance or shop floor update process. During this operation, Measurement has a mechanism to retry for a few minutes, however it will stop and set the Autolog Status as ERRORED if it was not possible to send data information to SFDC.
Operator can manually trigger a process to allow Measurement to retry to send this data to SFDC. This feature is allowed to be performed only in ERRORED activities, and is triggered by clicking the Re-Run Activity button. If the Re-Run Activity button is grey,then it cannot be re-run.
After clicked on Re-Run Activity button, Measurement will change the Autolog Status to PENDING, and on the next parser iteration, it will load this activity and process in SFDC. The status will change according to its processing result.
Additionally, multiple ERRORED activities can be selected to be reprocessed. To do this, mark the activities to be reprocessed on the first column checkbox and click on Re-Run Selected Activities button.
Measurement will set all selected activities to have the Autolog Status as PENDING and then reprocess them at next iteration process.
Manual Test Log
Manual Test Log Setup
The Manual Test Log feature allows non automated test equipment data to be manually collected based on a created test recipe. Using this manual input test data, Measurement is able to use a configured Test Station, communicate with SFDC and use a data collector associated with this test station pass the serial number through the SFDC flow.
To execute a manual test log in Measurement, first choose a parser that has an Import Type value of “Checklist”. Verify this by clicking the Expand button to the left of the parser information and confirm if Import Type equals “Checklist”.
Manual Test Log Screen Usage
To access the Manual Test Log module from the main menu, go to Production > Measurement and select the Manual Test Log tile.
After inputting a Serial Number, Measurement will check if this serial number sits on current location used by the device associated with this station.
If the serial number is not on the location associated with this device, then a flow error message is displayed.
This is the recipe and all test step items ready to receive input data, or uploaded automatically, depends on the type of the test step (fetch, procedure or expression). Values can be manually entered into the Value Field.
On the left in the Comparator field, the comparator in which the Value will be compared to can be seen. Also, there is the low limit, and on the right is the high limit (when available, depending on the Comparator type).
All mandatory fields are marked with.
After inputting a value, results can be tested against the expected outcome. In this example the Value of 100 is between the low limit and high limit, satisfying the Comparator GELE.
The Test Result could also be NOT EVALUATED, Measurement will only evaluate this result if the recipe was created with the Evaluate option marked.
To retest a unit, Click the Test again button, and enter a new Value.
To automatically load values that are calculations based on other steps, click the Load values button. In this example, line 1 is input and has a value that meets the Comparator and limits. Line 2 is an expression based on line 1. Clicking the Load values button processes line 2.
After inputting all required Test step values, click the Submit button at the very bottom of the page. Note: the Submit button will be inactive until all test steps have values.
After clicking on Submit, the following success message should display:
That ends the manual input log and the screen is ready to receive the next Serial Number. The tested serial number result is available on Activity Monitor including its result from SFDC.
See audit trail for an activity
Viewing an audit trail is a good place to start when trying to diagnose an activity process workflow problem. To see a audit trail from a specific activity, click the Print button in Actions columns from a respective activity row. This action will open a new browser tab where it can be sent to a physical printer if desired.
Measurement opens the Audit Trail in a new browser tab containing the activity information.
Log Viewer
Log Viewer is the module where Measurement tracks Parser processing deviations. This is generally used for troubleshooting when there is an abnormal flow, invalid data received or any kind of system malfunction behavior.
Based on this module the user in charge is able to identify any parser error or units not being processed in Measurement.
To access the Log Viewer module from the main menu, go to Production > Measurement and select the Log Viewer tile.
List log entries
As soon as the Log Viewer page is opened, the latest 30 entries are loaded into a list, providing the following information:
Customer: The customer set on the parser when this log was generated. Serial Number: Serial number being processed when available. File Name: If this is regarding a Text File processing Parser, then the filename is set here when available. Parser Name: The parser identification that generated this error. Machine Name: Name of server where Measurement service is running. Source: Where the error originated from, either Measurement Core or Measurement Web. Message: Technical or customized message regarding this unexpected behavior. Date: Datetime this action occurred. Severity: Type of action/behavior of this entry. Thread Name: SO Thread name who throws this error. Class: The Measurement object in which this error was thrown. Method: The Measurement object class name in which this error was thrown.
Search on log items
It is common to have little information when starting to troubleshooting, like the production line, customer or product, even serial numbers that were not processed correctly. The Log Viewer module offers a few filters to help find the exact error blocking the unit from being processed. Click the Expand button to the left of Search panel. The filters fields are the following ones:
Serial Number: The exact serial number being tested. Customer: The active customer’s list being used on parsers. Severity: Type of error. Source: Where the error originated from, either Measurement Core or Measurement Web. File Name: The filename being processed which throws the error. Message: The text message thrown by the application. This field decreases the performance of the search operation Top Records: Used to limit results on the screen. As this number increases, the more time the search will take to display results. Start/Stop: Used to trigger the search operation between the set number of seconds. Date Range From/To: Date time range to search the logs when they happened.
After clicking the Search button, Measurement loads the log entries according to the filter criteria and displays the list.
To erase the filter, clear all fields and click the Search button.
Create a Service Request based on a log entry
If there is a log entry which cannot be resolved, or if it is identified as application technical deviation, the log entry can be used to open a service request. Log Viewer application offers an easy way to do that. On the right side of each ERROR type log entry, there is a Create Service Request button, when this button is clicked, Measurement loads a submit form to create a service request, using the logged username and the log details as SR description.
After clicking the Create button, Measurement will open a service request to Measurement support team and will return to Log Viewer list.
== Revision History==
| Date | Author | Title | Version | Change Reference |
| 04/03/17 | Benjamin Cavanaugh | v 1.10 | Major Revision and upload to wiki | |
| 01/14/17 | Jim Morgan | v 1.10 | Updated to Measurement 3.1 | |
| 07/22/16 | Rafael Figueiredo | v 1.10 | Included Move Station Feature | |
| 01/14/15 | Leonardo Agostini | v 1.10 | Initial Version |

