SOP-42Q-MES0070 Statistical Process Control TV
Cirrus > Quality > Statistical Process Control TV
Contents
SPC TV Portlet
Like SPC portlet, SPC TV portlet is another component of SPC system. SPC TV enables user can view SPC control charts in any combination in one page through some simple configuration so that users can learn the latest status of any line or location in real time.
Add SPC TV Portlet
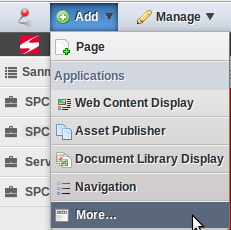
After SPC portlet is installed, click the SPC TV sub-menu on the left side, move the cursor over the Add selection menu on the top left corner, and choose More from the drop down menu.
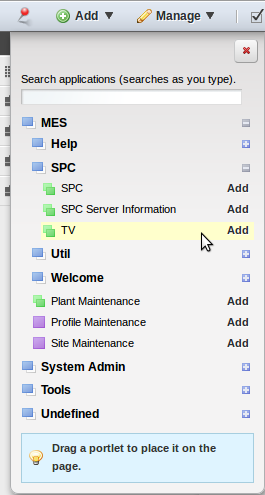
From the MES menu tree, select SPC, then select TV from the SPC menu tree. Select Add. An SPC TV portlet has been added onto the page.
NOTE: By default, there is only one SPC TV page on the left navigation menu, and only one SPC TV portlet added in the page. Users do not have the permissions to add an SPC TV page or SPC TV portlet. If a user wants to make such an addition they must submit a Work Request and have MES Support team to make the addition.
Set Page Layout
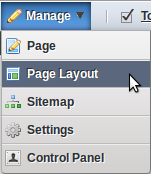
Move the cursor over the Manage selection menu and select Page Layout sub-menu from the drop down list
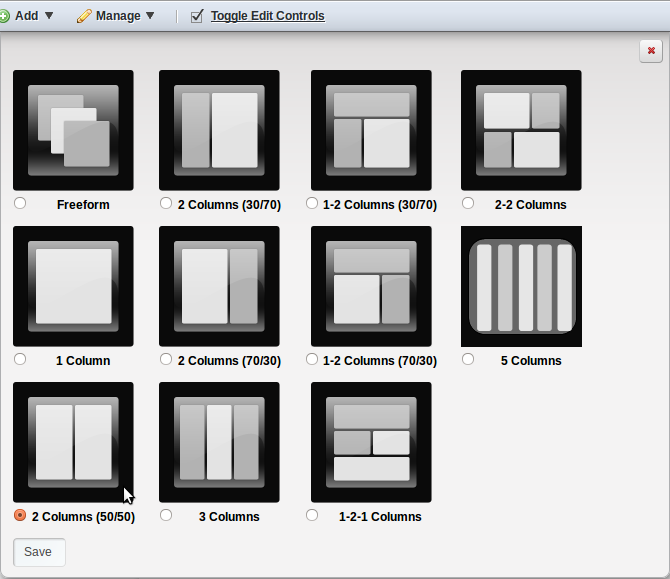
In the float panel, 11 layout templates are available, you can select one and click the Save button to apply the layout to your page. By default, the 2 Columns (30/70) layout template is selected.
Configure Preferences
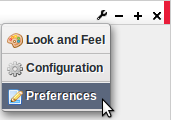
Users must perform some simple configuration before SPC TV portlet shows SPC control charts properly. Click the ![]() icon from the SPC TV portlet controls bar, and select Preferences from drop down menu.
icon from the SPC TV portlet controls bar, and select Preferences from drop down menu.
Select available an server, monitor, and chart from each drop down selection box. Complete the remaining parameters and click Save.
Some of the fields are explained as follow:
Select SPC Server: the SPC server that have been defined in Server Information portlet
Monitor Group: Currently SPC monitors are grouped into two categories according to the data source: MDS and SPI. You can select a monitor group name here.
Monitor: the monitor that you've created under the selected monitor group in SPC portlet
Chart: the control charts that you've configured in the selected monitor. Please note that the Pareto chart and Yield chart will not be displayed in this field even if you've configured them in SPC monitor
Number of point: the maximum points that will show on the selected chart
Refresh(min): every xx minutes SPC TV will refresh for new data
Display counter: whether or not shows the countdown timer on SPC TV portlet (on top right corner)
Size: the size of SPC TV portlet, you can either select a fixed size or define your own size
Tip:
For details about how to get the best display effect under different screen resolutions, you can refer to SPC TV Configuration Guide
Exceptional Icons
- If there is no setting for the SPC TV portlet, it displays a gear icon
- If there is no data, SPC TV portlet displays a question mark icon
- If the connection times out, SPC TV portlet displays an exclamation mark icon
Roles & Permissions
| Roles→ Permissions↓ |
SPC_Corp_Support |
SPC_Plant_Admin |
SPC_Plant_Manager |
SPC_Plant_User |
*SPC_Plant_Operator |
|---|---|---|---|---|---|
| SPC |
|||||
| Add/Edit/Delete Monitor |
|||||
| Start/Stop Monitor |
|||||
| Disable/Enable Monitor |
|||||
| Add/Edit/Delete Monitor Group |
|||||
| Input/Edit Data |
|||||
| Add/Edit/Delete Email |
|||||
| Delete Log |
|||||
| Edit OCAP |
|||||
| Disable/Enable Data |
|||||
| Add/Edit/Delete Location Family |
|||||
| Disable/Enable Location Family |
|||||
| Edit System Configuration/Global System Configuration |
|||||
| Unlock |
|||||
| View |
|||||
| Add to Page |
|||||
| Configuration |
|||||
| SPC Server Information |
|||||
| Add/Edit/Delete Server |
|||||
| View |
|||||
| Add to Page |
|||||
| Configuration |
Notification:
- ‘SPC_Plant_Operator’ is for plant E68 only.
Glossary
1. MFG hold: MFG hold is short for manufacturing hold. SPC sends MFG hold to MDS or SFDC to stop manufacturing line. It is another action SPC can take when point is out of control limit.
2. MDS: Short for Manufacturing Data System.
3. SFDC: The SFDC (Shop Floor Data Collection) System is the main software/hardware system used by Sanmina-SCI for production control and the collection of manufacturing data.
4. Exception: SPC considers some out-of-control caA valid group here means the group oses as exception based on the rules you selected when configuring monitor parameters.
5. Valid group: It means the data that is in the normal scope. On SPC control charts, a valid group of data points are plotted between the UCL and LCL.
6. DPMO: Short for Defects Per Million of Opportunities.
7. OCAP: Short for Out of Control Action Plan.
8. Ext JS: Ext JS JavaScript Framework. Ext JS is a pure JavaScript application framework for building interactive web applications using techniques such as Ajax, DHTML and DOM scripting.
Change Log
| Date | Author | Title | Version | Change Reference |
|---|---|---|---|---|
| February 1, 2014 | Elton Wang | Tech Writer | 1.0 | initial release |
