42Q-MES0138 OEE Data Collection
42Q Home > Production > OEE Production
Contents
OEE
OEE Data Collection provides two ways for plants to collect Data from asset activity:
- Report production data (Asset event/downtimes, work time) manually in the OEE Data Collection module.
- Collect production data automatically using the OEE Configuration tools, 42Q’s API, and a preferred client.
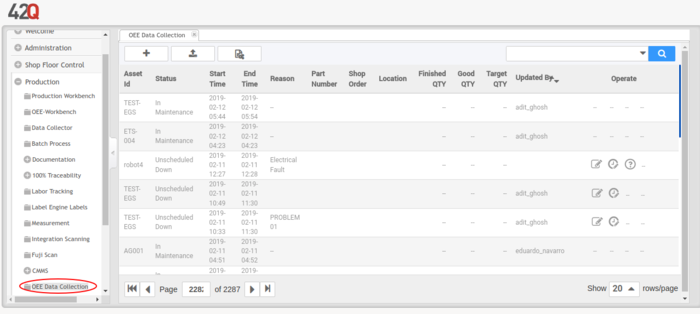
To access OEE Data Collection go to: Production > OEE Data Collection and the following main screen will appear.
Figure 1: OEE Data Collection
Report Asset Event
In the Report Asset Event portlet, Shop Floor Operators manually add asset events running, setup, idle, spare, in maintenance, calibration, scheduled downtime, and unscheduled downtime due to asset malfunctions as well as routine stoppages (such as parts in transit or lunch breaks). This data expresses the Availability component of OEE Configuration.
When an asset experiences stoppages, for any reason, a signal is sent to the MES database, the time is recorded in the system, and a work order is created. When the asset is once again running, the work order is closed and corresponding timestamps are recorded.
Keep in mind that uptime and downtime timestamps are dictated by the up/down intervals defined in the Up/Down Threshold submodule of OEE Configuration. This allows for a grace period during which the signal is not sent to the MES, based upon machine parameters and production expectations.
TIP: Don’t forget to set Up/Down Thresholds so Work Orders are not triggered during scheduled downtimes (e.g. setup).
Attention: Plants operating OEE Configuration without an auto PLC or FUJI interface must manually record stoppages due to a plant’s regular workflow (e.g. lunch breaks, waiting for parts) in Report Work.
Engineers will then use the Report Asset Event tool to manually record the root cause for each downtime event.
Note: Root Causes are reported in Data Collector for all interface types.
In the Report Asset Event module, operators can report details about their shift to include the following:
- Work Time: The operator enters the beginning and end of their shift. This data represents the Performance variable of OEE Configuration.
- Finished Quantity: The operator enters the total number of units produced.
- Good Quantity: The operator enters the number of first-time quality units produced.
Taken together, Finished/Good Quantity represents the Quality variable of OEE Configuration.
Report Asset Event
To record an asset event due to regular plant workflow:
- Select the “+” icon on the top menu bar.
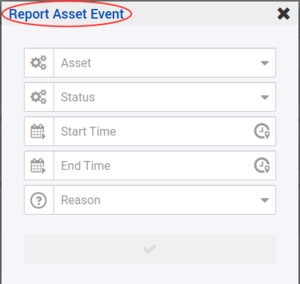
- A pop-up window displays: Report Asset Event.
Figure 2: Report New Asset Event
- Complete the following fields:
- Asset: Select the Asset.
Note: The system allows for a complex search: Input at least 4 characters to locate the asset.
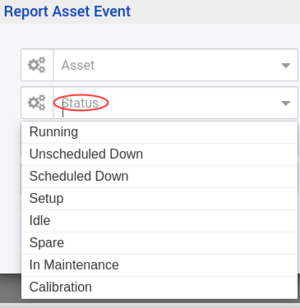
- Status: Select the status of the asset. Options are: Running, Unscheduled Down, Scheduled Down, Setup, Idle, Spare, In Maintenance, and Calibration.
Figure 3: Asset Status
- Running - It is used to up the asset without location, shop order, part number or it can record the period shift Finish Qty/Good Qty(optional).
- Unscheduled Down - It is used to record the asset unscheduled downtime event.
- Scheduled Down - It is used to record the asset scheduled downtime event.
- Setup - It is used to record the production line/asset setup time during the preparation.
- Idle - It is used to record the asset idle time when the asset is up and running, but it does not produce any product.
- Spare - It is used to record the asset non-schedule time.
- In Maintenance - It is used to record the maintenance time when the maintenance team performs the asset maintenance.
- Calibration - It is used to record the calibration time when the maintenance team performs the asset calibration.
- Start Time/End Time: Select the date of the asset event using the drop-down calendar. Then select the time using the adjustable timestamp at the bottom of the calendar form. (Note: If the event time corresponds to real-time, there is no need to manually select the time - the system records real-time when the date is selected.)
- Reason: Select the reason for the asset event from the drop-down menu provided.
Note: Reasons are configured within the Asset configuration module of the CMMS (Computerized Machine Maintenance System) under the Problem category. This association links Asset (machine) problems with their corresponding downtimes.
Note: If users report Assetrunning events, they can input the Shop Order, Part Number, and Location. When inputting the Start Time and End Time, the Finished QTY and Good QTY will display.
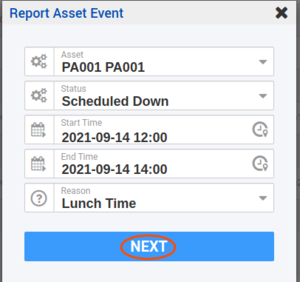
- Once the information has been successfully entered, select Next.
Figure 4: Report Events-Next
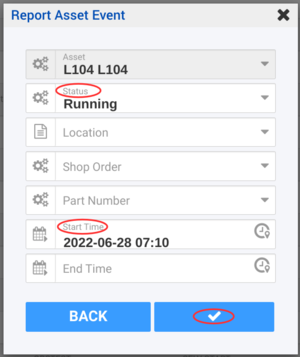
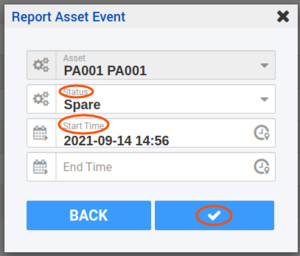
- Select the next Status, Start Time, then select the Green Checkbox to save the asset event. Or Select the BACK to double-check the event information.
Figure 4a: Report Running Events
Report Reason and Report Downtime Per Interface
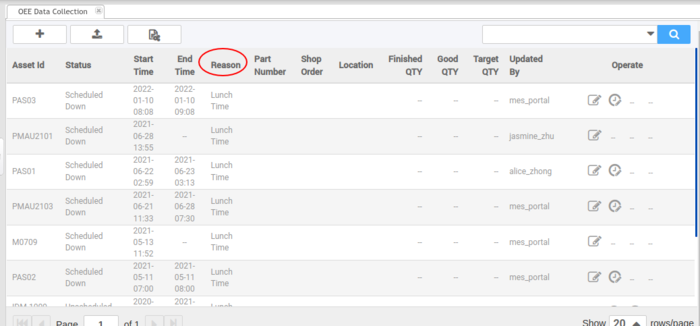
Once the repair is complete, users must report the Reason for the asset malfunction.
The type of interface used by each individual plant to gather data will determine whether downtimes and reasons are sent automatically by the MES, or recorded manually by Shop Floor Operators. The following rules apply:
- Fuji Host Interface: Downtime and Reason automatically retrieved from Fuji; no human involvement.
- Auto PLC Interface: Downtime and Reason automatically retrieved from PLC; no human involvement.
- Semi-automatic PLC Interface: Downtime retrieved from PLC; Reason must be entered by Operator.
- No machine Interface: Downtime and Reason must both be entered by the Operator.
Figure 5: Reason
To record a Reason for asset downtime:
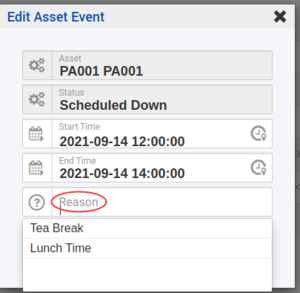
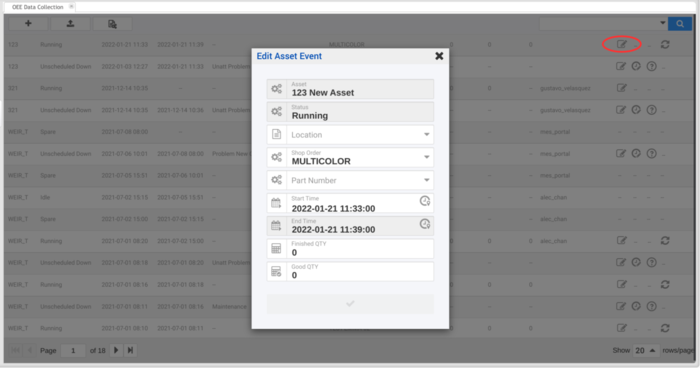
- Select the line of data describing the downtime by choosing the Edit icon.
- A pop-up window displays: Edit Asset Event.
- Select the Reason from the drop-down menu.
- Select the checkmark to save the reason.
Note: Reasons are configured within the Asset configuration module of the CMMS (Computerized Machine Maintenance System) under the Problem category. This association links Asset (machine) problems with their corresponding downtimes.
Figure 6: Edit Asset Event
Time Split
The Time Split feature allows operators to record multiple downtime events relating to the same asset. Time Splits cannot be added until Reasons are recorded.
- Select the specific asset down the record by highlighting the line of data.
- Select the Time Split icon.
Figure 7: Time Split Icon
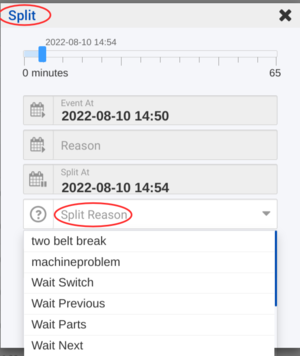
- The Split pop-up window displays.
Figure 8: Time Split
- The operator can select the time (slide the blue bar) for the new split downtime event and select the new Reason from the drop-down menu provided.
Note: Reasons are configured within CMMS Asset > Problem portal of 42Q.
- Select the checkmark screen at the bottom to generate the new split downtime event record.
Root Cause
The Root Cause of the downtime problem is recorded by an engineer after the asset is repaired. Root Causes are based on the Reason recorded as well as a thorough inspection of the stopped asset. Root Cause information is used to compute OEE Configuration Trend Reports: Trend reports provide valuable insight into productivity. All plants are required to input Root Causes so that accurate and useful OEE Configuration data is available.
- To add a Root Cause, select the desired asset down the record by highlighting the line of data.
- Select theRoot Cause icon.
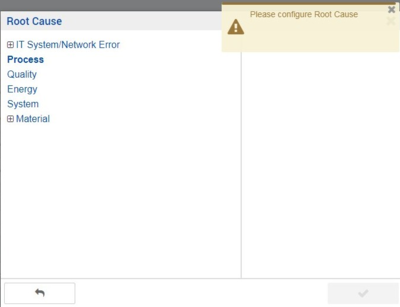
- TheRoot Cause window will display.
- Select the + button to add the root cause to the selected downtime record.
Figure 9: Add Root Cause for Asset Downtime
Root Cause Configuration Example
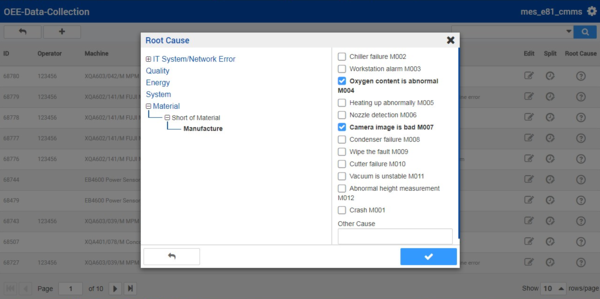
- In the example,(below) the engineer may select the second-level category root cause.
- Select the category by double-clicking on the title. Preconfigured Root causes then populate on the right-hand side of the window (Lack of Steel Plate M004, etc. in the example figure below ).
Note: Root Causes and Categories are defined in the Configuration module of OEE Configuration (Shop Floor Control > Configuration > OEE Configuration > Root Cause > Root Cause Category). See Configure a Root Cause and Category.
- Selectsave (checkmark icon) to add the new root cause to the selected downtime event record.
- Other Cause textbox: Engineers may add a new root cause to the Root Cause Category by entering the cause into the Other Cause textbox. Once saved, the new Root Cause is added to the system and available for selection in other records.
Note: The system does not allow users to save or edit more than one Root Cause Category at a time. Each Root Cause Category must be saved separately using the save/checkmark icon. If the engineer would like to add a Route Cause from a different category, s/he must first complete the initial Root Cause by selecting the save/checkmark icon; then return to complete a second Root Cause Category.
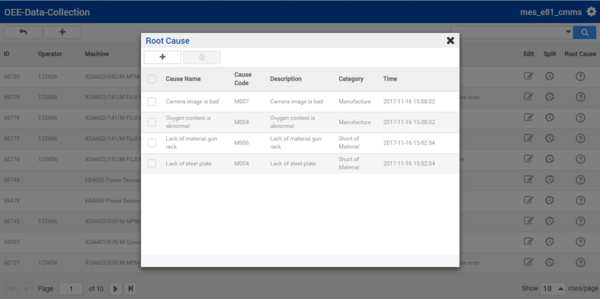
Once saved, the system returns the user to the Add Root Cause page(see below) and the newly created Root Cause details display.
Figure 10: Root Cause Page
Select the+ icon toadd an additional Root Cause from a different category.
Note: The system does not limit the number of Root Causes per downtime record.
Figure 11: Add Another Root Cause for Asset Downtime
Figure 12: Root Cause Successfully Added
Root Cause Error Message
Root Cause Categories with no associated Root Causes cannot be completed. The following error message displays (see figure, below). Return to the configuration submodule to define root causes (Shop Floor Control > Configuration > OEE Configuration > Root Cause).
Figure 13: Root Cause Error Message
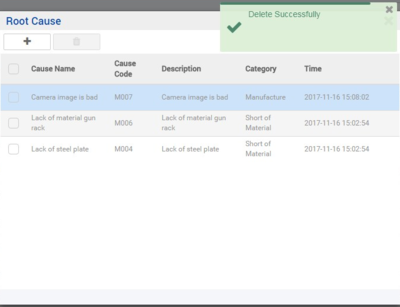
9. To Delete a Root Cause from the downtime record, select the root cause by activating the checkmark, then select the trash bin icon.
Figure 14: Delete Root Cause
Report Work
In the Report Asset Event module, operators report details about their shift to include the following:
- Work Time: The operator enters the beginning and end times of their shift. This data represents thePerformance variable of OEE Configuration.
- Finished Quantity: The operator enters the total number of units produced.
- Good Quantity: The operator enters the number of first-time quality units produced.
Taken together, Finished/Good Quantity represents the Quality variable of OEE Configuration.
Add Work Time
Click the “+” Icon at the OEE Data Collection main page
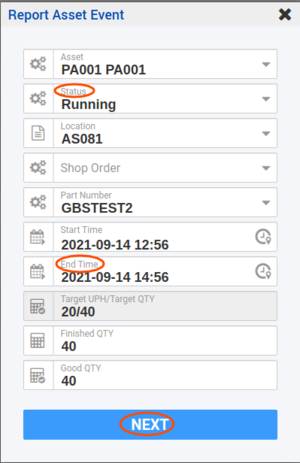
'Select'Running from theStatus field to Report a new work time record.
Figure 15: Report Asset Event (Work) Next
Using Part Number/Part Family or Shop Order to link with the Target UPH value. If a Part/Family has been set up for more than one location, then the user needs to select the location. The Asset Mapping will be mandatory to link the location with the part information.
Complete the following fields:
- Asset: Select the Asset.
Note: The system allows for a fuzzy search: input at least 4 characters to locate the asset.
- Status: SelectRunning.
- Shop Order: The shop order is optional. The Shop Order number is used by the system as a search key to find the target value for the Performance factor(Expected UPH).
- Part Number: The Part Number is used by the system as a search key to find the target value for the performance factor.
- Location: The Location/Workstation used by the system as a search key to find the target value.
- *Start Time: Select the start time using the drop-down list.
- *End Time: Select the end time using the drop-down list.
- Target UPH/Target QTY: The value automatically populates based on the target UPH value defined at the target maintenance.
- *Finished QTY: Enter the total quantity completed.
- *Good QTY: Enter the number of completed items that successfully met quality standards without rework.
- Once data is entered, theNext on the bottom of the form becomes available.
- SelectBACK to double-check the information, or select the Status for next status then select the checkbox to save the asset work information .
Figure 16: Report Asset Event (Work)
Figure 17: Report Asset Event (Work) List
Note: The Finished QTY and Good QTY will be unavailable if the Target UPH/Target QTY is 0.
Edit Work Time
The operators may modify the Finished QTY and Good QTY of the existing work time using the Edit feature.
- Select the production report for modification.
- Select theEdit icon (pencil) located on the far right of the screen.
- The Report Window displays, allowing the operator to adjust data.
Figure 18: Edit Work Time
- Change the'Finished QTY or Good QTY as needed.
- Select the checkmark icon to save the changes.
Bulk upload Asset Event
OEE Data Collection module supports the users to upload the asset event from files. First, download the template file, make your own asset event data at your local file, then upload the file to input asset events in bulk.
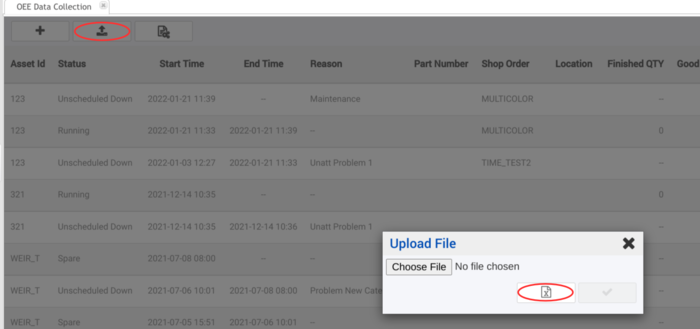
- Select the second button at theOEE Data Collection main page.
- At the Upload File, select the X icon to download the template file.
- Make your own asset event data at your local.
Figure 19: Download the Template File
See the following example data for those Asset Event status import data format:
- Unscheduled Down
- asset_id, start_time, end_time, status, problem, part_number (optional), shop_order (optional) , root_cause (optional), description (optional).
- Scheduled Down
- asset_id, start_time, end_time, status, problem, part_number (optional), shop_order (optional), description (optional).
- Setup, Idle, Spare, In Maintenance, Calibration
- asset_id,start_time, end_time, status, description (optional).
Figure 19a: Unscheduled Down
Figure 19b: Scheduled Down
Figure 19c: Idle Down
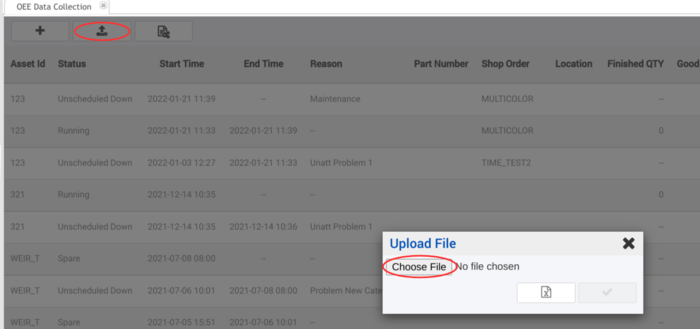
- Select the'Choose File button to select the local asset event csv file, the file name will show.
Figure 20: Choose the Asset Event File
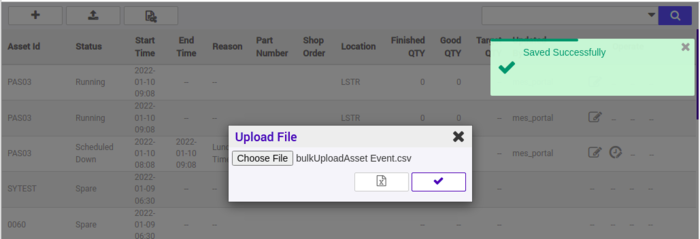
- Select the Check Mark to upload the asset event data in bulk.
- If uploaded successfully, the message will show.
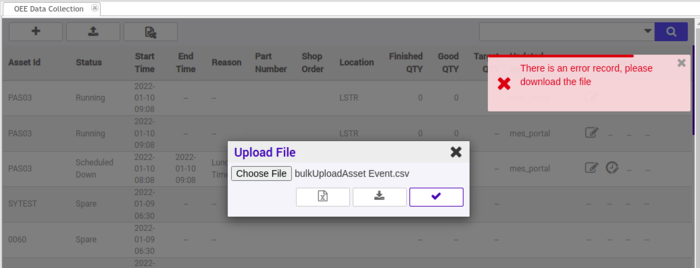
- If uploaded fails, it will generate an error file that allows users to download to view the error message.
Figure 21: Bulk Upload successfully
Figure 22: Bulk Upload Failed
Search and Export Asset Event
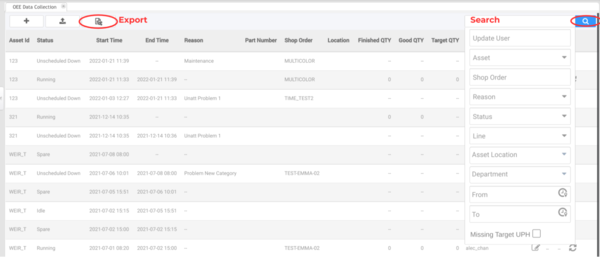
OEE Data Collection module supports the users to search and export the special asset event data into a local file.
The filters can be:Periods Dates (From, To), Assets, Group by (Line, Location, Department) Operator, Shop Order.
Figure 23: Search and Export Asset Event
Refresh the Target QTY
At the OEE Data Collection main page, the users will be able to click the refresh button for the specific missing target UPH record for the running status asset event, the backend system will call MES-API to get the refresh Finished QTY, Good QTY, and Target UPH record data within 1 hour.
Figure 24: Refresh the QTY
Automatic OEE Configuration Data Collection
As noted in Report Reason for Machine Downtime Per Interface, OEE Configuration variables (Performance, Availability, and Quality) can be collected manually or automatically, depending upon the type of interface used by the individual plant. This section describes how to set automatic interfaces.
The following interfaces are used to auto-collect production data:
- MES 101 interface
- Fuji interface
- PLC/Rapid IIoT Gateway interface
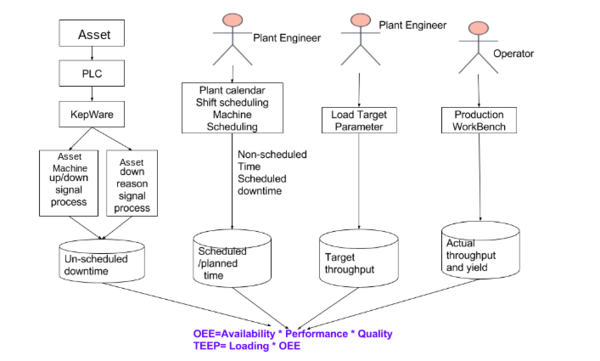
The below diagram illustrates the major data sources required to calculate OEE Configuration automatically; manual entry and manual correction are still supported at OEE Configuration Data Collection.
Figure 25: Major data sources required to calculate OEE Configuration
MES 101 Integration
MES 101 allows OEE Configuration to gather Performance & Quality data from MES automatically, thus avoiding possible human errors resulting from manual entry. The process saves labor time and ensures data (e.g. Finished Qty, Good Qty, Target UPHs, shop order, Start/End Intervals, etc.) is accurate and up-to-date. The automatic data retrieval also reduces the need for operation training, thereby simplifying implementation, and reducing costs.
Configuration Steps
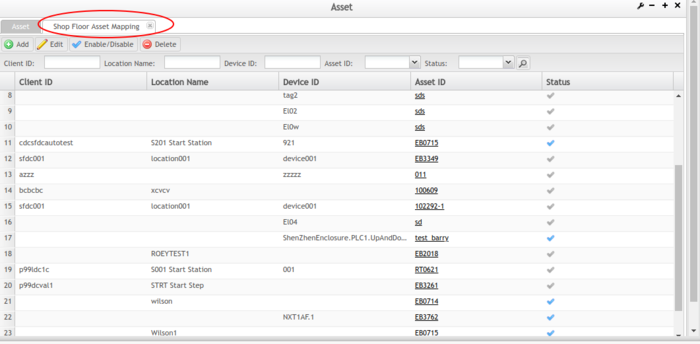
In order for the system to get the Production data and target data, users must map the Asset to the Location in the OEE Configuration system (Shop Floor Control > Configuration > CMMS Asset > Asset Mapping).
- Go to: Shop Floor Control > Configuration > CMMS Asset > Asset Mapping.
- Add Client ID andLocation Name.
- Select Asset ID with the drop-down feature.
Note: Mapping configuration is completed only once.
Figure 26: Shop Floor and Asset Mapping
- Client ID: The Shop Floor ID.
- Location Name: Enter the MES101 Location. Location maps Asset status to defined target values in order to capture OEE Configuration Quality and Performance data.
- Device ID: The Device ID for the MES101 Location, such as NetDC, Emulator.
- Asset ID: Asset that is defined in CMMS > Asset.
- Status: Active mapping in the blue tick, inactive mapping in the gray tick.
Fuji Integration - Fuji Host Interface
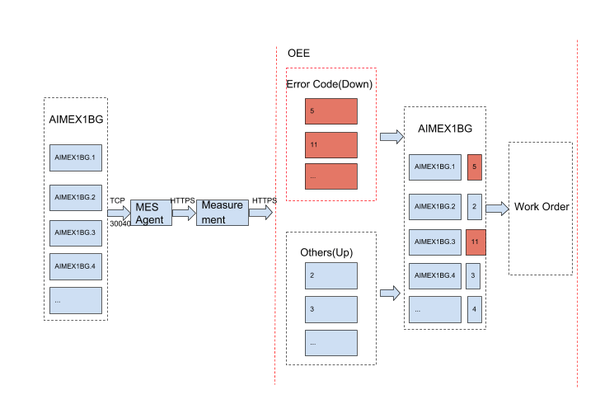
Factories with Fuji AMEX & NXT machinery utilize theMESAgent application to sync Fuji machine downtime raw data and error codes with the OEE Configuration database.
The below diagram lists the process that Fuji Interface follows to collect the data.
Figure 27: Collect Data from Fuji
Fuji Host Interface - the OEE Configuration system can retrieve the machine Up, Down/Reason through the Fuji Host Interface/MESAgent Client automatically. The Fuji Host Interface up/down, down reason is the same as the PLC up/down, down reason signal which comes from the machine automatically. When using this approach, the Fuji Host Interface can only be used along with the NXT & Aimex modules.
Following are the steps to run the Fuji Interface:
- Install Fuji Host Interface at the production Fujitrax PC. The Host Interface application is included in the Fuji installation CD with installation instructions.
- Install the MESAgent Client (42q Application) in the production Fujitrax PC. It will keep listening to the machine Up & Down/Reason signals from the Fuji Host Interface and will forward it to the 42Q OEE Configuration system.
Note: The Fuji Host Interface and MESAgent are installed by the Administrator or Support team.
PLC Interface Overview
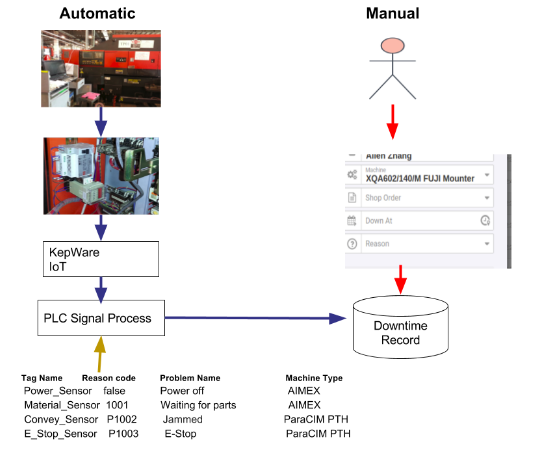
OEE Configuration application availability of Layer 2 drivers (Kepware) to perform data capture from Machines or PLCs and transfer to 42Q Via Rapid IIoT.
Kepware IIoT will be set up to monitor the downtime reason code tag. Once the machine is down, IIoT will detect the reason code tag value change and send a signal (which includes the reason code and timestamp when reason code changes) to 42Q OEE Configuration downtime process, then 42Q OEE Configuration process will process this signal and mark corresponding downtime record with corresponding problem code mapped to this specific reason code. The following diagram illustrates the configuration steps.
Figure 28: Collect Data from PLC
The OEE Configuration system can retrieve the asset’s Up/Down and Reason signals from a PLC Connection, thus removing the need to record reasons (Report Downtime) and manually enter work time (From/To) and Finished/Good Quality.
PLC Integration Steps
- Install a third-party middleware (such as Kepware) software to communicate with the PLC and forward payloads to 42Q IIoT APIs.
- Work with the 42Q automation engineering to test and set up the PLC connection.
- Set up the machine downtime Error Code (to map Asset’s Problem Code) at the OEE Configuration Configuration module.
- Once mapped, users may view Downtime Root Cause Analysis Reports, Downtime Problem Reports, Downtime Trend Analysis Reports, and others in OEE Configuration Reports.
Note: Steps 1 and 2 are completed by the Administration or Support team.
Note: OEE value will be recalculated with the new downtime or performance/quality data
If users fill in the missing new downtime, then the system will recalculate the OEE value based on the new downtime. If the MES101 API is down, the system will try to get the previous OEE Performance & Quality data automatically. If the Target UPH value is missing, the system will recalculate the OEE value again after users correct the value. The backend recalculation job will run automatically.
Glossary
- MTBF: Mean time between failures (MTBF) is the predicted elapsed time between inherent failures of a system during operation.MTTR: Mean time to failure (MTTF), measures the average time between failures.
- MTTR: Mean time to failure (MTTF), measures the average time between failures.
- Quality: An OEE Configuration variable that depicts the number of good products divided by the number of bad products. It is commonly referred to as the first pass yield.
- Availability: Machine Downtime, according to duration. Takes into account all machine downtime to include minor stoppages, slow production, and idling. Calculated as: Operation Time/Planned Production Time = Availability.
- OEE Configuration: Overall Equipment Effectiveness is a manufacturing metric that identifies the percentage of productive manufacturing time according to Quality, Performance, and Availability. It is the single best metric for identifying losses, benchmarking progress, and improving the productivity of manufacturing equipment. Calculated as: Availability x Performance x Quality = OEE Configuration.
- Performance: A measure of productivity, specifically the speed at which parts are built. Calculated as: Actual Rate/Standard Rate = Performance.
- PLC: Programming Logic Control.
- Quality: The percentage of parts that meet quality standards without rework. It is commonly referred to as the first pass yield. Calculated as: Good Units/Total Units = Quality.
- UPH: (Units Per Hour). is a throughput metric portrayed as a number. UPH is typically assigned to high-volume processes. Answer the question: How many units are built in this process per hour?
- Client: The firmware, software, or hardware system used to capture and send data from assets on the factory floor to the 42Q API. Commonly used clients include Fuji AIMEX, and PLCs. This concept is directly connected to Rapid IIoT.
- MESAgent: It is an interface (MESAgent, Fuji-OEE Configuration interface) application to collect Fuji data to the 42Q OEE Configuration system.
