42Q-MES0113-C 42Q Live
42Q Home > Reporting > 42Q Live
Introduction
42Q Live provides users a view of data reports to gain insight into critical lines on the shop floor. The 42Q solution gathers yield percentage data to determine the line’s status based on the configured target yield. If the line’s current yield is lower than its target yield, the line’s status will change to critical. Being able to view this information in an intuitive monitor layout increases plant visibility and ensures that issues can be addressed quickly as they arise.
Prerequisites
- Shop Floor ID defined in Shop Floor ID Maintenance
- All Locations are set up and defined in Location Maintenance
- All Devices set up and defined in Device Maintenance
- MFG Lines with all scanners and escalation levels have been set up MFG Line Maintenance
42Q Live
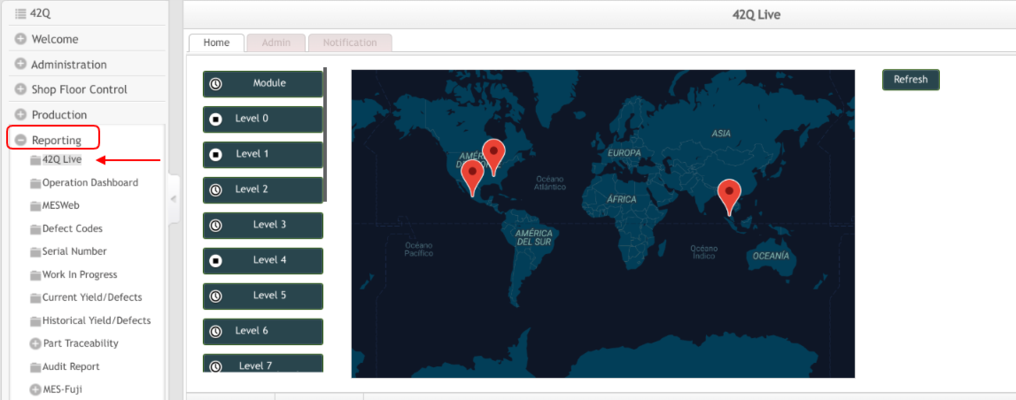
To access 42Q Live go to; Reporting > 42Q Live
Figure 1: Access
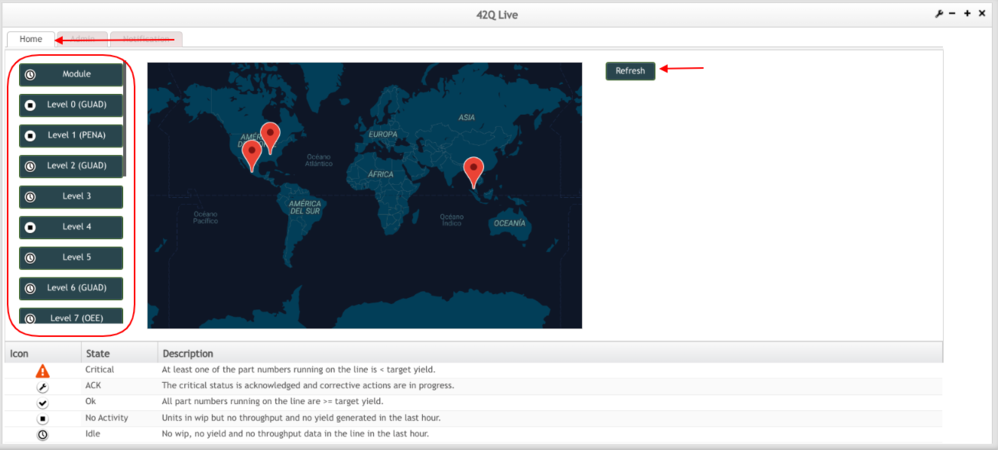
On the main page, users will be able to see three tabs, Home, Admin, and Notification, which will be fully explained below.
Home Tab
The Home tab is the main page in 42Q Live. Here, users can select the desired level from the list on the left side of the screen.
Note: In order to have levels available to select, they must be created and configured in the MFG Line.
Once created, the levels will be available on the Home tab of 42Q Live after a short interval. The bottom of the Home tab displays the key for the icons used in the layout monitor. TheseState Icons display on the monitor based on the configuration in MFG Line Maintenance.
To open the fullscreen layout monitor, select the desired level. The layout monitor for the specified level will open in a new tab.
Figure 2: Home Tab
Note: If the status of the levels has changed, use the Refresh button to update.
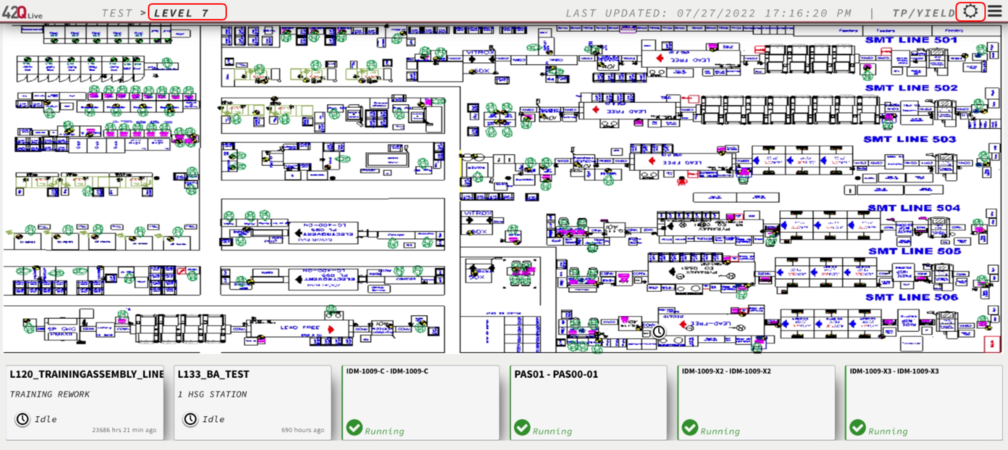
42Q Live Monitor
The 42Q Live Monitor displays line information for the selected Level of the floor. At the bottom of the screen, a carousel of information cards will display all of the configured lines for that level. Cards on the carousel can be selected to display detailed information about the selected line. In addition to the cards, the icons on the shop floor illustrate the line’s current status and can also be selected to view information about that specific line. Each card will display the Name and process associated with the line, as well as it is status and the last update. To view more detailed information about a specific line, select a card from the carousel. The card will expand to display the following information:
- The Name of the line and the Process
- Part Number
- The Throughput of the Line
- The number of items in WIP
- The Target Yield and the Current Yield
Note: The theme can also be changed to either Day or Night by selecting the icon in the Top Right Corner. The icon will display a moon if the layout is currently using the Night theme or the sun if it is using the Day theme.
Figure 4: 42Q Live - Day Theme
Figure 5: 42Q Live - Night Theme
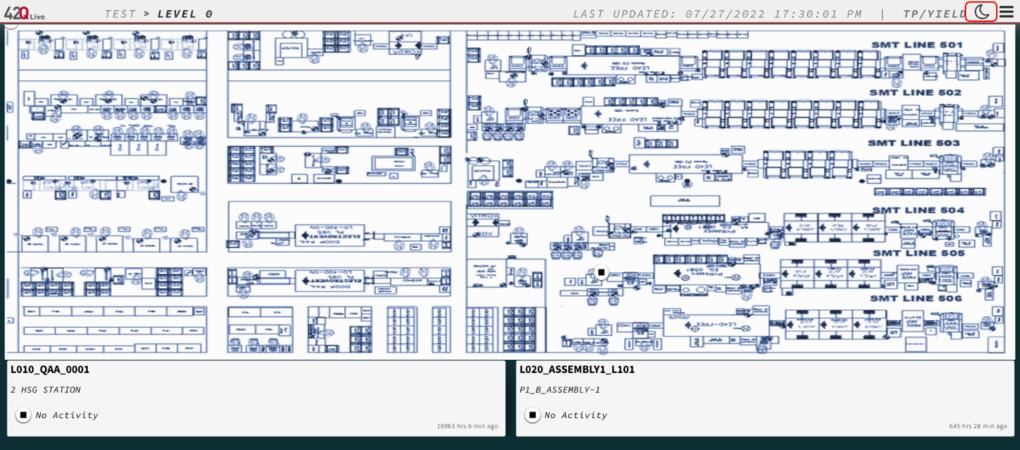
Note: The layout is refreshed at an interval specified in the Admin tab. Any changes made to the MFG Line configuration will refresh based on this interval.
Local Configuration
The top left of the monitor screen displays a navigation pane that is used to navigate between levels by selecting the desired level, as pictured in the figure above.
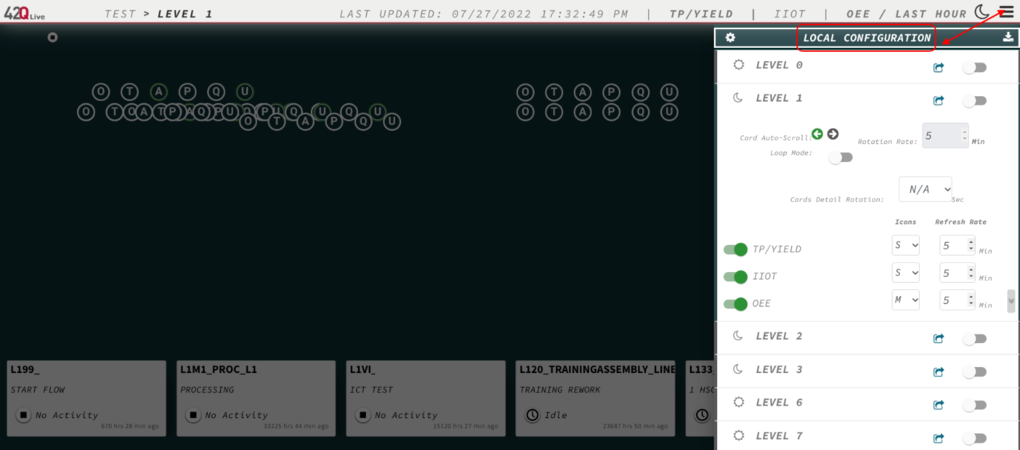
The Local Configuration can be viewed by clicking on the ![]() Configuration Menu icon.
Configuration Menu icon.
The Local Configuration screen is displayed:
Figure 6: Local Configuration
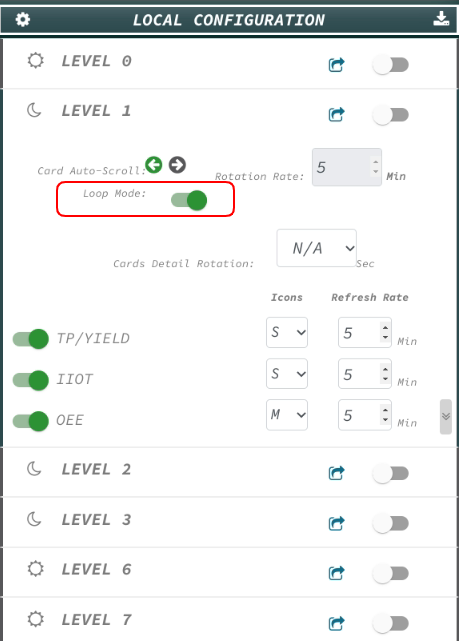
From the Local Configuration the user is able to perform some actions such as Download Saved Configuration, Enable/Disable Layers, Choose the size of the icons (small, medium, or large), Update Refresh Rate, Change Card scroll to left/right, Enable/Disable Loop Mode, by default, the option is turned on, that means that it will continue scrolling consistently right to left, and just starting over with the first card placed behind the last card.
If the Loop Mode is enabled and the user clicks on an event bottom card before the last card is displayed, the rotation starts again. Once the first card is rotating again and the card can expand to display detailed information:
Figure 7: Loop Mode
Once the first card is rotating again and the last card has not been reached, the card cannot be clicked. It does not expand to display details until the last card is reached and the complete cycle is done.
If the Loop Mode is disabled, the Monitor event button cards rotate to reach the end of the cards and it does not start again, it returns back to the first event card moving fast from left to right.
GUI Functions
All available Levels are noted on the top left of the screen. In the example above, only Level 1 is available.
GUI capabilities are described below. (Refer to the above figure for a numbered reference).
 Return to Level Icon: Select this GUI to view the Level only and remove the configuration page.
 Toggle Switch: Enable/disable the rotation between layers. When enabled, all layers selected for the Level will rotate across the screen, according to the defined time. When disabled, only the cards will display.
 Card Auto Scroll: Use the arrows to select which direction cards should move (left/right).
- Rotation Rate: Select the time (minutes or seconds) between each layer rotation. To switch from Minutes (Min) to Seconds (Sec) and vice versa.
- Layers: Select the layers to display on this Level by moving the Layer’s toggle switch off (grey) or on (green). Available layers include: Asset, Throughput/Yield, and OEE Configuration.
- Icons: Select the size of the Layer’s Icons. Options include Small, Medium, or Large. The figure below shows medium-sized gauge icons selected for the OEE Configuration Layer.
- Refresh Rate: Select the time period (minutes) for the system to refresh the monitor with new data. Different rates can be applied to different layers.
For OEE Layer, the OEE, TEEP, A, P, Q, and up/down status, and for TP/Yield Layer: Line name, Process, and line status.
Layers
42Q Live offers 3 Layers of data:
- Assets: displays cycle time status (green - asset is performing at expected levels; yellow - asset is performing below optimal levels and requires attention; red - asset is performing severely below level, and may be stopped.) Assets status is determined by comparing scanning activity (throughput and cycle time) during a set period of time to target yield values predefined in target maintenance.
- TP/Yield: (also referred to throughout this document as MES 101 layer) shows throughput and yield values for the selected level, and the current status of each production line (ok, acknowledged, on hold, critical, and idle.)
Note: The MES101 and Asset target values are defined in the Target Maintenance portal, using the soms_target table.
- OEE Configuration: shows OEE Configuration statistics for the specific asset; OEE Configuration layers are color-coded according to predefined target ranges (red = levels are below defined OEE Configuration target values; yellow = approaching cautionary target values; green = within acceptable OEE Configuration target values).
Note: OEE Configuration target values are defined in the Target Maintenance portal, using the OEE Configuration_target_ table.
OEE Layer
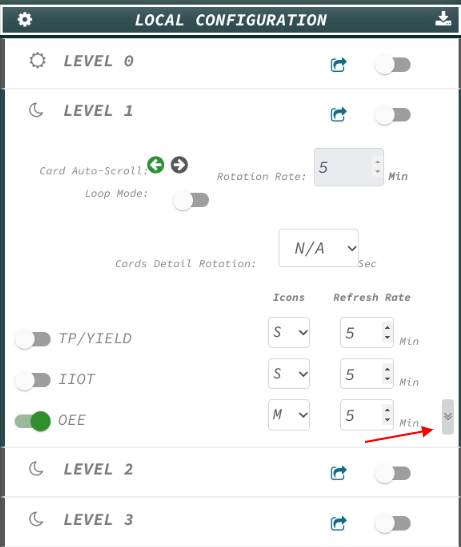
For levels that contain an OEE layer, there exists an OEE Layer Configuration menu that can be expanded:
To configure theOEE Configuration Layer, expand the screen by selecting the double arrow icon. ![]()
Figure 8: Configuration Drop-down Option
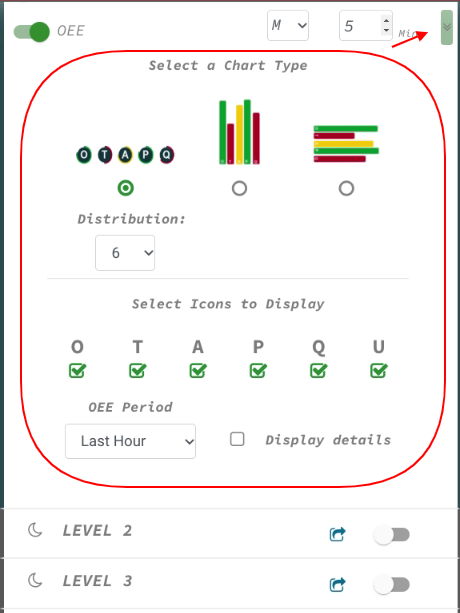
Once expanded, options are displayed regarding chart types, the number of columns, icons to display, time period, and additional details:
Figure 9: Chart Organization
OEE Configuration Values
Select this chart type to display OEE Configuration variables (OEE Configuration, TEEP, Availability, Performance, Quality) as a circular gauge chart. See Configuration Option #12 for more display options for OEE Configuration gauge charts. O = OEE Configuration
T = TEEP
A = Availability
P = Performance
Q = Quality
U = Utilization
Target Value Configuration
42Q Live compares current shop floor data against predefined target values and displays those values in intuitive charts. Because products can vary dramatically from plant to plant, 42Q provides users the option to define targets to match their unique production requirements. Users can change the target ranges for each icon in 42Q Live. This provides managers the option to quickly view the critical status according to target guidelines set for their unique products. By default, the system sets all target values at 100%. Users have the option to customize the target value depending on the needs of their plant. Target values must be configured in the same database as 42Q Live.
Note: Target values will also define the way charts are displayed in MESWeb Reports.
To configure OEE_Target values:
- Navigate to the Target Maintenance portal (Shop Floor Control > Configuration > Target Maintenance).
- Filter by OEE_Target in the search bar on the top right of the screen.
Note: If OEE Configuration categories/headings have not been previously defined, users will need to select the add button, then upload OEE Configuration headings in a .csv formatted document.
- Read more about theOEE Configuration target configuration in OEE_Target UPH.
Range Configuration
By defining target ranges, users are able to customize how OEE Configuration values display in 42Q Live. For example, Plant A may want OEE Configuration values of 80% or lower to display as critical (red); whereas, Plant B is only concerned when OEE Configuration values fall below 70%; Plant B wants OEE Configuration values between 70% - 80% to display as yellow on dashboard reports.
This section details how to set meaningful target values so that dashboards display according to the plant’s unique production goals.
Setting Target Ranges for 42Q Live: A Screen Printer Use Case
The following illustration shows the OEE Configuration values for a Screen Printer as they display in 42Q Live.
Figure 10: Target Ranges in 42Q Live
The OEE Configuration value reads red, signifying to line supervisors that the screen printer in this location requires immediate attention. Because the Target selected was 95%, any number falling beneath 95% would signal critical status (red).
If the target OEE Configuration value for this screen printer had been set at 75% and the cautionary (yellow) value had been set at 60%, the OEE Configuration gauge chart would appear yellow because the present OEE Configuration value of 70% falls between 60% - 75%.
Likewise, if the critical value had been set at 60% and a cautionary value was set at 50%, this 70% reading would display green, indicating the screen printer asset is behaving as expected.
Set Target Values
The following fields are available to customize target ranges. Refer to the list below to complete each field. (See also: Figure: Configure Target Ranges in Target Maintenance.)
- Asset Name: Specify a name to identify the Asset. Asset Names cannot be duplicated within the same level/module.
- OEE Configuration: Specify the OEE Configuration target for the specific asset. OEE Configuration values => OEE Configuration will be displayed as green in the 42Q Live monitor, indicating that the asset is performing at an acceptable level according to OEE Configuration metrics.
- OEE Configuration Yellow: Specify the minimum acceptable value;OEE Configuration values between OEE Configuration Target and OEE Configuration Yellow will display as yellow in the monitor, indicating to line supervisors that the asset requires monitoring, but not immediate action. If the actual OEE Configuration value < OEE Configuration Yellow, it will display as red on the monitor.
![]() TIP: OEE Configuration = changes the green endpoint of the meter gauge.
TIP: OEE Configuration = changes the green endpoint of the meter gauge.
TIP: OEE Configuration Yellow = changes the low yellow display.
- TEEP: Specify the TEEP target for a specific asset;values => the TEEP target will be displayed as green in the 42Q Live monitor.
- TEEP Yellow: Specify the minimum acceptable TEEP value; values between the TEEP target and TEEP Yellow will display as yellow on the monitor. If the value < TEEP Yellow it will display as red on the monitor.
- A: Specify the A (Availability) target for a specific asset; values => Availability target will be displayed as green on the monitor.
- A Yellow: A (Availability) Yellow specifies the minimum acceptable Availability value; values that fall between the availability target selected and A Yellow will display as yellow on the monitor. Values< A Yellow will display as red on the monitor.
- P: Specify theP (Performance) target for the specific asset; values => P will be displayed as green in the 42Q Live monitor.
- P Yellow: Specify the minimum acceptable Performance value; values betweenP Target and P Yellow will display as yellow on the monitor. If the actual P value <P Yellow target value, it will display as red on the monitor.
- Q: Specify the Q (Quality) target value for a specific asset; values =>Q will be displayed as green on the monitor.
- Q Yellow: Specify the minimum acceptable Q (Quality) value; values between the Q target value and Q Yellow will display as yellow on the monitor. If value < Q Yellow then it will display as red on the monitor.
- Level: Specify the asset’s level or module in 42Q Live.
Figure 11: Specify 42Q Live Level in Target Maintenance
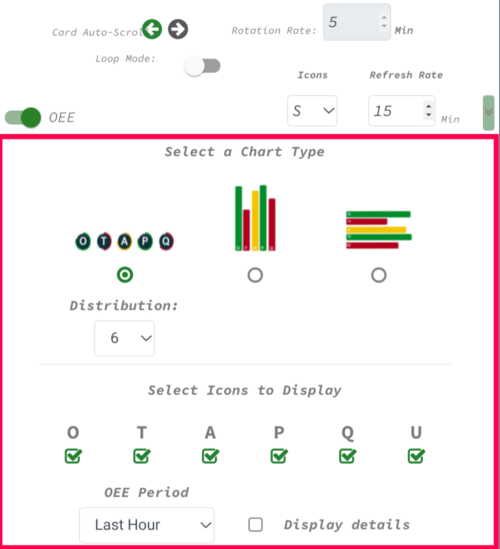
Users can expand more options settings to access the configuration options section by clicking the down arrow provided.
Once expanded, options are displayed regarding chart types, the number of columns, icons to display, time period, and additional details:
Figure 9: Chart Organization
Note: The Target Yield is automatically set at 95%.
Figure 10: Detailed information
To view the selected line’s history,
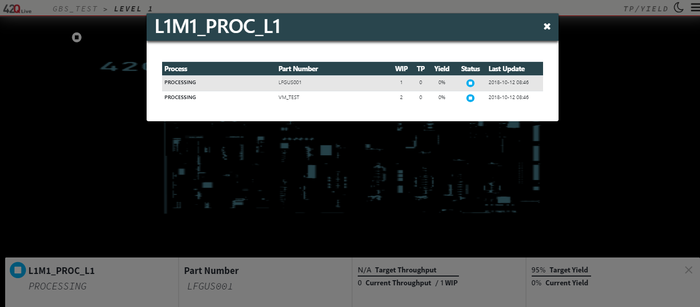
- Select the line to open the detailed view, then click on the card again. A pop-up window will display all of the processes and part numbers running on the line in order of priority.
The priority list is as follows:
- Critical
- ACK
- Hold
- OK
- Idle
- To return to the detailed view, select the OK button at the bottom of the pop-up window.
Figure 11: Expanded View
Admin Tab
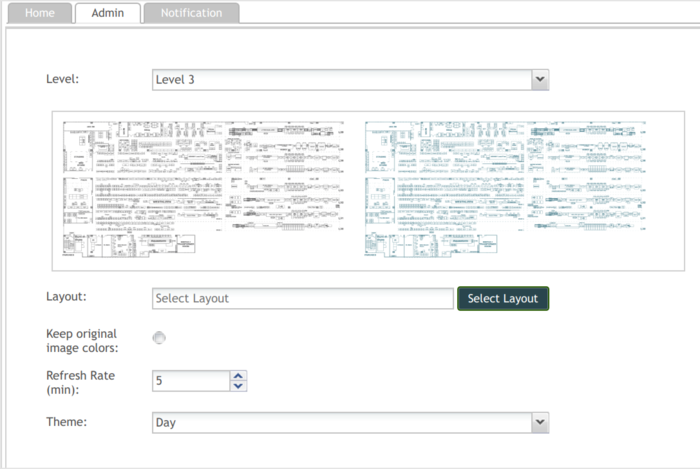
The Admin Tab is used to set up the layout of the 42Q Live layout monitor. Here, the layout image is uploaded and all settings regarding the layout’s look can be selected for the desired level. The Admin tab contains the following functions:
- Level drop-down to select the level that the configuration will apply to.
- A preview box to preview the uploaded layout.
- Layout selection - Select the layout (image) to use.
Note: The recommended file size is or greater. Image files must be in PNG format. If the resolution is lower than the recommended size, an icon will display instructing the user to use a higher resolution image if available.
- Keep the original colors radio button.
- Refresh Rate(min)
- Theme drop-down: Day/Night.
Figure 12: Admin Tab
To set up a layout:
- Select a Level from the Level drop-down.
- Select the Select Layout button. The user’s computer file explorer window will display. Once a layout has been selected, a preview will display in the box above.
- If desired, select the Keep original image colors radio button.
Note: This feature will keep the original color scheme of the image. If left unchecked, the image color scheme will be converted to the color scheme of 42Q Live.
- Select how often, in minutes, that 42Q Live should refresh.
- Select either the Day or the Night theme from the Theme drop-down menu.
- Once all desired changes have been made, select Save.
Notification Tab
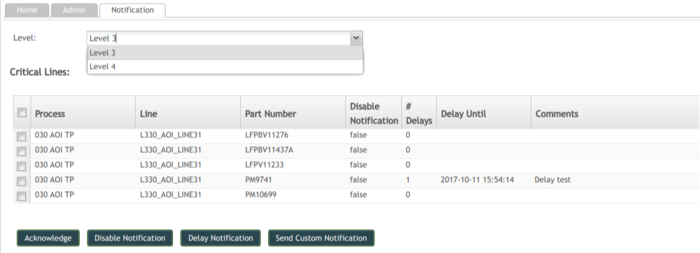
The Notification tab displays all critical lines for the selected level and is used for managing notifications for critical lines. The notification emails are configured when setting up the lines in MFG. Line Maintenance. Once the Level has been selected, the list of critical lines for that level will display under the Critical Lines heading.
The Critical Lines list displays the following columns:
- Process - The process associated with the line.
- Line - The line in critical status.
- Part Number - The Part Number associated with the line.
- Disable Notification - Displays either “true” or “false” depending on whether notifications have been disabled for the selected line.
- # of Delays - The number of times the notification has been delayed.
- Delay Until - The specified time that the notification will be delayed.
- Comments - Selecting a field under the Comments column will allow the user to enter a comment.
After selecting a line from the list, users have the following four options:
- Acknowledge - By selecting this option the user with the right permissions can change the status from Critical to Acknowledge. The status ACK (Acknowledge) will remain until the lines return to Ok status.
- Disable Notification - Users with the appropriate roles can select this to cancel the notification. This is useful if there is a planned outage and no one needs to be notified.
- Delay Notification - The Delay Notification option is used to delay the notification for a specified amount of delays before it is escalated.
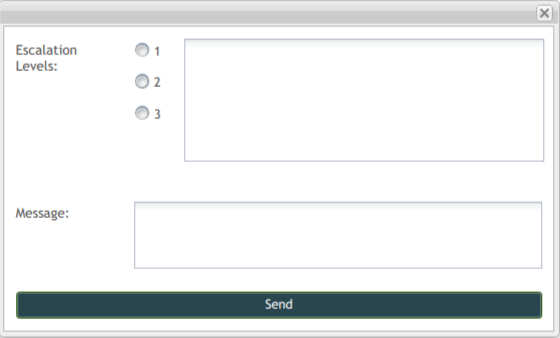
- Send Custom Notification - This option is used to send a custom notification message to the selected escalation levels. Selecting the Send Custom Notification button displays a pop-up window.
Figure 14:Custom Notification pop-up window
To send a custom notification:
- Select the desired escalation level from the Escalation Levels radio button. When an escalation level is selected, the email addresses associated with that level will display in the field to the right.
- Enter the message to be sent in the Message field.
- Select Send. A “Success” pop-up message will display if the notification was sent successfully.
