42Q-MES0113-C 42Q Live
42Q Home > Reporting > 42Q Live
This edition applies to MES 15.4 and all subsequent releases and modifications until otherwise indicated in new revisions.
Contents
Overview
42Q Live is an update to the existing SOMS monitor with a new look and feel. In this portlet, users can view data reports to gain insight into critical lines on the shop floor. The 42Q solution gathers yield percentage data to determine the line’s status based on the configured target yield. If the line’s current yield is lower than its target yield, the line’s status will change to critical. Being able to view this information in an intuitive monitor layout increases plan visibility and ensures that issues can be addressed quickly as they arise.
NOTE: In order to gather data, the MFG. Line(s) must be configured with all scanners and escalation levels. For more information on configuring the MFG. Line, see SOP-5-I-MES0009-C MFG. Line Maintenance.
42Q Live
Home Tab
The Home tab is the main page in 42Q Live. Here, users can select the desired level from the list on the left side of the screen. In order to have levels available to select, they must be created and configured in SFDC > MFG. Line. The bottom of the Home tab displays the key for the icons used in the layout monitor.
- To open the fullscreen layout monitor, select the desired level. The layout monitor for the specified level will open in a new tab.
NOTE: If the status of the levels has changes, use the refresh button to update.
Figure 1: Home Tab
700px
42Q Live Monitor
The 42Q Live monitor displays line information for the selected Level of the floor. On the bottom of the screen, a carousel of 6 information cards displays all of the configured lines for that level. Cards on the carousel can be selected to display detailed information about the selected line. In addition to the cards, the icons on the shop floor illustrate the line’s current status and can also be selected to view information about that specific line.The layout is refreshed on a interval specified in the Admin tab.
Figure 3:42Q Live - Day Theme
700px
Figure 4:42Q Live - Night Theme
700px
The top left of the monitor screen displays a navigation pane that is used to navigate between levels by selecting the desired level, as pictured in the figure above. The theme can also be changed to either Day or Night by selecting the icon in the top Right Corner. The icon will display a moon if the layout is currently using the Night theme or a sun if it is using the Day theme.
The bottom of the monitor displays a moving carousel of cards that display information about the configured lines. Each card will display the Name and process associated with the line, as well as its status and the last update. To view more detailed information about a specific line, select a line from the carousel. The card will expand to display the following information:
- The Name of the line and the Process
- Part Number
- The Throughput of the Line
- The number of items in WIP
- The Target yield and the Current Yield
Figure 5: Detailed Information
700px
To view the selected line’s history,
1. Select the line to open the detailed view, then click on the card again. A pop up window will display the line’s history.
The priority list is as follows:
- Critical
- ACK
- Hold
- OK
- Idle
2. To return to the detailed view, select the OK button at the bottom of the pop up window.
Figure 6: Expanded View
700px
Configuration
Admin Tab
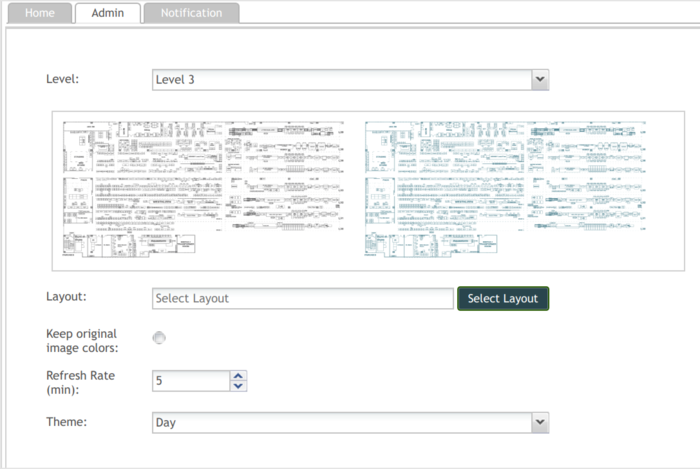
The Admin tab is used to set up the layout of 42Q Live layout monitor. Here, the layout image is uploaded and all settings regarding the layout’s look can be selected for the desired level. The Admin tab contains the following functions:
- Level drop-down to select the level that the configuration will apply to.
- A preview box to preview the uploaded layout.
- Layout selection - Select the layout (image) to use.
NOTE: The recommended file size is or greater. Image files must be in PNG format. If the resolution is lower than the recommended size, an icon will display instructing the user to use a higher resolution image if available.
- Keep original colors radio button.
- Refresh Rate(min)
- Theme drop-down: Day/Night.
To setup a layout:
- Select a Level from the Level drop-down.
- Select the Select Layout button. The user’s computer file explorer window will display. Once a layout has been selected, a preview will display in the box above.
- If desired, select the Keep original image colors radio button.
NOTE: This feature will keep the original color scheme of the image. If left unchecked, the image color scheme will be converted to the color scheme of 42Q Live.
- Select how often, in minutes, that 42Q Live should refresh.
- Select either the Day or the Night theme from the Theme drop-down menu.
- Once all desired changes have been made, select Save.
Notification Tab
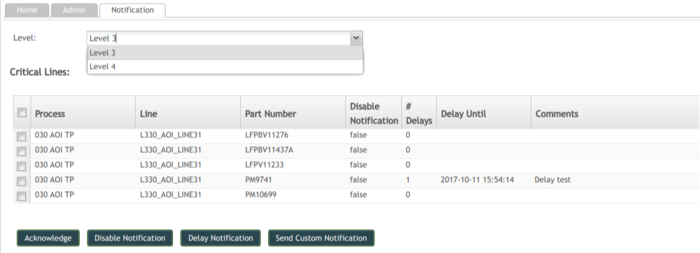
The Notification tab is displays all critical lines for the selected level and is used for managing notifications for critical lines. The notification emails are configured when setting up the lines in MFG. Line Maintenance. Once the Level has been selected, the list of critical lines for that level will display under the Critical Lines heading.
The Critical Lines list displays the following columns:
- Process - The process associated with the line.
- Line - The line in critical status.
- Part Number - The Part Number associated with the line.
- Disable Notification - Displays either “true” or “false” depending on whether notifications have been disabled for the selected line.
- # of Delays - The number of times the notification has been delayed.
- Delay Until - The specified time that the notification will be delayed until.
- Comments - Selecting a field under the Comments column will allow the user to enter a comment.
After selecting a line from the list, users have the following four options:
- Acknowledge - By selecting this option the user with the right permissions can change the status from Critical to Acknowledge. The status ACK (Acknowledge) will remain until the lines returns to Ok status.
- Disable Notification - Users with the appropriate roles can select this to cancel the notification. This is useful if there is a planned outage and no one needs to be notified.
- Delay Notification - The Delay Notification option is used to delay the notification for a specified amount of delays before it is escalated.
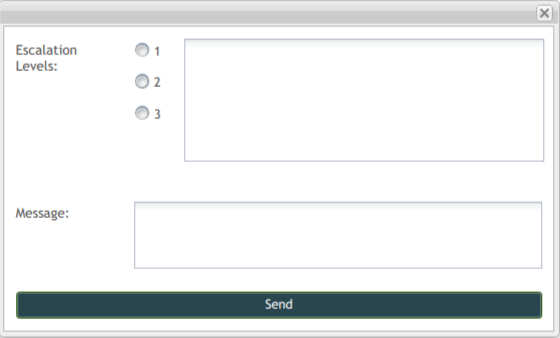
- Send Custom Notification - This option is used to send a custom notification message to the selected escalation levels. Selecting the Send Custom Notification button displays a pop up window.
Figure 9:Custom Notification pop-up window

To send a custom notification:
- Select the desired escalation level from the Escalation Levels radio button. When an escalation level is selected, the email addresses associated with that level will display in the field to the right.
- Enter the message to be sent in the Message field.
- Select Send. A “Success” pop up message will display if the notification was sent successfully.
Document Revision History
| Date | Author | Title | Version | Change Reference |
| 11/8/17 | Lucas Hopkins | Technical Writer | A | This is the first version of 42Q Live for the wiki. |

