SOP-42Q-MES0055 MESWeb Reports
42Q Home > Reporting > MESWeb Reports
Contents
- 1 Introduction
- 2 Access Level
- 3 MESWeb Reports
- 4 Parameters
- 5 Results
- 6 Tools
- 7 Predefined Reports
- 7.1 Default Reports
- 7.1.1 Custom Reports
- 7.1.2 Shop Order Report
- 7.1.3
- 7.1.4 Shop Order Summary Report
- 7.1.5 Top Defect Evolution Report
- 7.1.6 WIP Distribution Report
- 7.1.7 Yield & Defect Report
- 7.1.8 Yield Evolution Report
- 7.1.9 Yield Serials Report
- 7.1.10 Unit History Report
- 7.1.11 Part Order Summary Report
- 7.1.12 RTY Report
- 7.1.13 Workstation Monitor Report
- 7.1.14 WIP Serials Report
- 7.1.15 Solder Paste Status Report
- 7.1 Default Reports
- 8 SOMS Reports
- 9 QCP Checklist
- 10 Crew Activity Reports
- 11 Labor Tracking Reports
- 12 Location Activity Report
- 13 Customer Active User Report
Introduction
MESWeb is a powerful business intelligence application designed from the ground up to simplify reporting from manufacturing execution systems, and empower end-users with a streamlined and full-featured web interface. The application includes an ad hoc report design tool that allows users to create basic, customized reports from heterogeneous data sources.
MESWeb provides access to technical information through a real-time reporting database to avoid negatively impacting production system performance. In its standard configuration, some of the reports based on MDS include the following, and new reports continue to be created:
- Work in Progress (WIP Distribution)
- Yield, Defect, and Repair analysis
- Serial Number historical details (Unit History)
- Evolution Reports (including moving averages) – Top Defect Evolution and Yield Evolution
- Throughput information
These reports have the ability to filter and search the data per common attributes such as Customer, Part Number, Process, Date and Time range, Shifts, Evolution Intervals, etc. These default reports provide a significant level of visibility to manufacturing processes. MESWeb is also the strategic platform for all MES reporting needs and it can be used with any system as the following databases are available:
- ERP
- Postgres
- MySQL
- SQL
- ODBC
Access Level
MESWeb has five distinct access levels:
Administrator (System Administrator)
The System Administrator has full access to MESWeb Central and Execution – all plants, all reports, and all customers. Basically, Administrator access includes the capabilities of all of the levels (Security Manager, Report Manager, and Data Source Manager). This access will be given to BSAs and global support personnel. An administrator can perform the following functions:
- Access the "Access Control" module
- Create, Edit, and Delete Locations
- Create, Edit, and Delete Data Sources
- Create, Edit, and Delete Data Source types
- Create new custom reports globally
- Copy, Edit, and Delete existing custom reports globally
- Publish custom reports globally
- Manage permissions for all MESWeb locations
Security Manager (Local Administrator)
The Security Manager has full access to the plant(s) where he/she has been designated as the local Administrator for the MESWeb tool. The main responsibilities of this role are to organize permissions and manage customers. A Security Manager is able to:
- Visualize the Central MESWeb module in the MES Portal
- Access the "Access Control" module
- Grant permissions to him/herself and others from the Security Manager level to all lower levels
- Manage customers (add customers and map part numbers to them)
Report Manager
The Report Manager has access to "Reports" and "Report Groups" modules in the specific location(s) where he/she was designed as Report Manager. Inside those modules, a Report Manager is able to:
- Create custom reports and publish them only in his/her location
- Edit or Delete existing customer reports in his/her location
Note: Deleting is not possible if the report is published elsewhere
- Create Report Groups
- Add Reports to Report Groups
Data Source Manager
The Data Source Manager is responsible for creating and updating Data Sources and Data Source types.
A Data Source Manager is able to:
- Create, Edit, and Delete Data Sources
- Create, Edit, and Delete Data Source types
User (Execution Module only) Section Name
The User role is able to execute only those reports specifically granted access to him/her, and may not create new reports or modify existing reports. Administrators may restrict user access only to data belonging to specific customers and data sources.
MESWeb Reports
MESWeb has been designed to be easy to use. The process of executing a MESWeb report involves following only a few simple steps. Instructions for these steps may currently be found in two locations:
- In the MES wiki (navigate to Reporting > MESWeb) on the respective pages for each report.
- On the MESWeb report page (accessible via the 42Q Portal)
Note: Users who wish to read instructions for one or more specific reports are referred to the two aforementioned locations. Items that are important to the general use of MESWeb Reports are reviewed here.
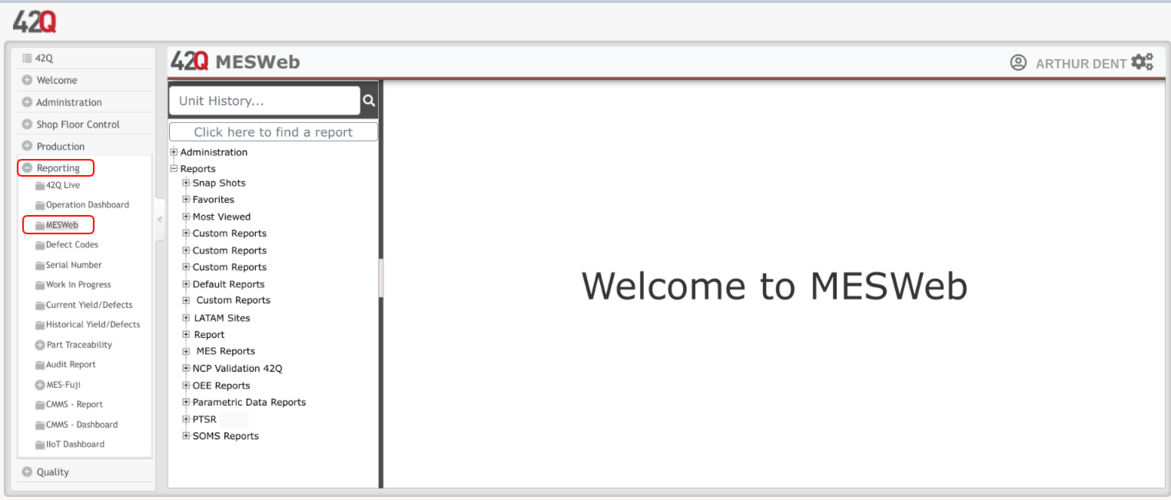
To access the MESWeb Reports page users must have access to the 42Q Portal. Once logged in, users must navigate to Reporting > MESWeb.
The user is directed to the MESWeb Report page. At this point, the user’s web browser should be displaying content similar to that seen in the following image:
Figure 1: Accessing MESWeb Reports
Users can access MESWeb Reports from this page by navigating and selecting the option of the Report that they need.
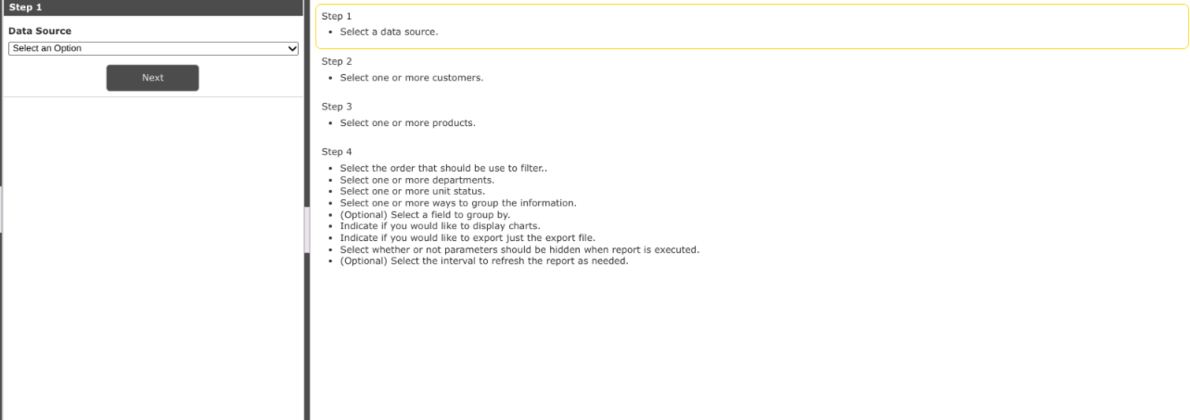
The following image shows the appearance of a typical report page in MESWeb, although the steps can change depending on the parameters of the report.
Note: The instructions are provided on the right side of the page, whereas all user actions are performed in the window on the left side of the page.
Figure 2: Report Page
Parameters
As already has been said before, steps mainly work as filters to be used to execute the report. A step can contain x parameters, also, a step may or may not be the parent of another subsequent step. Take Customer and Part numbers as examples. In a previous step, the user selects the customer and the part numbers related to the selected customers will be shown.
MESWeb has a collection of parameters highly configurable by the user to help to filter the information, such as;
- Dropdown List - This manages a list where only one single option is selected.
- Checkbox - A check box is used for true/false parameters.
- Radio Buttons - Radio buttons allow the user to select one option from the list. Every option selectable is mutually exclusive. This also can be used to show different parameters.
- Date - A date parameter is used to select a specific date. This is a variant that also allows the user to select the time.
- Date Range - The date range is a parameter that allows selecting a range between two dates. (A variant that also allows the to user selects the time).
- Listbox - In a list box, multiple options can be selected. All checkbox allows to user to select every option available on the list. Users can filter options using the checkboxes Starts With, Contains, and Ends With after the user has selected the option and written some text in the text box has to click on the
icon to refresh the list.
The (highlighted down-arrow) icon moves all of the options in the "Available" list to the "Selected" list.
The (down-arrow) icon moves only the selected option in the "Available" list to the "Selected" list.
The (up-arrow) icon moves only the selected option in the "Selected" list back into the "Available" list, thus removing it from the "Selected" list.
The (highlighted up-arrow) icon moves all of the options in the "Selected" list back to the "Available" list, thus removing all options from the "Selected" list.
- Multi-Line Text Box - It allows adding lines as necessary.
Results
Grids
Once a report is executed, a grid with the results will appear on the right side.
Figure 3: Grids
Selected Parameters
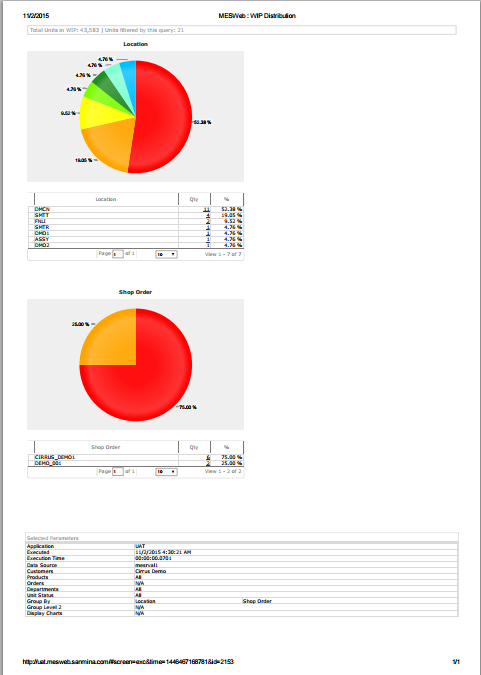
The selected parameters will appear downside. This contains all the parameters that the user has selected and other useful information such as how many times the report took the application and the execution day.
Figure 4: Selected Parameters
Actions
There are three principal actions that can be done with the report s results: Print, Export, and Share.
This option allows the user to print the report.
Figure 5: Print Reports
After selecting Print, a dialog box appears. Select Print to display the report’s results.
Figure 6: Print Result
Export
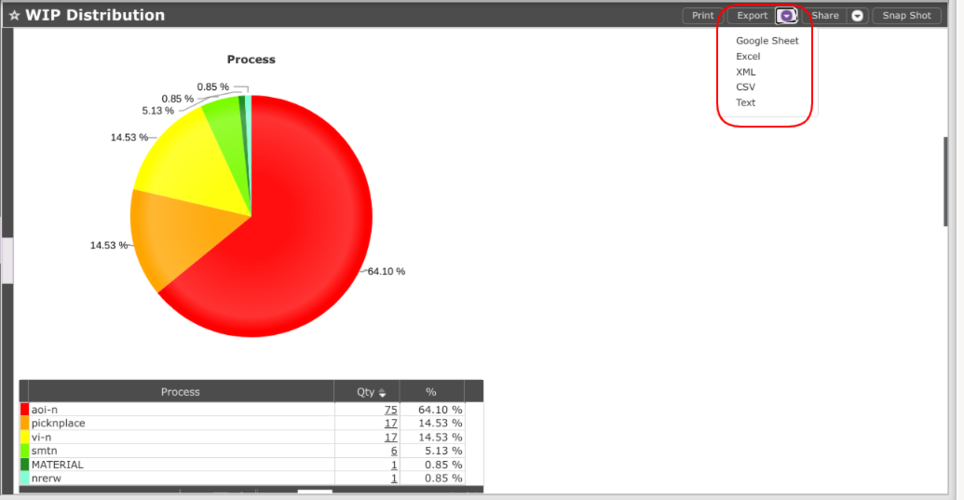
The Export button downloads a file to the user's PC.
Figure 7: Export Report
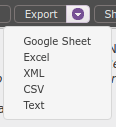
The report can be saved in several formats, according to the user's needs Google Sheets, Excel, XML, CSV, andText.
Follow the steps below to export to google sheet:
Step 1: Select the Google Sheet option in the drop-down menu:
Figure 8: Export Report
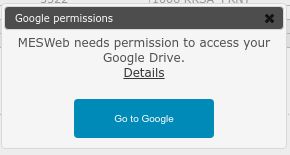
Step 2: Configure the Google permissions by selecting the correct option:
Figure 9: Export Report
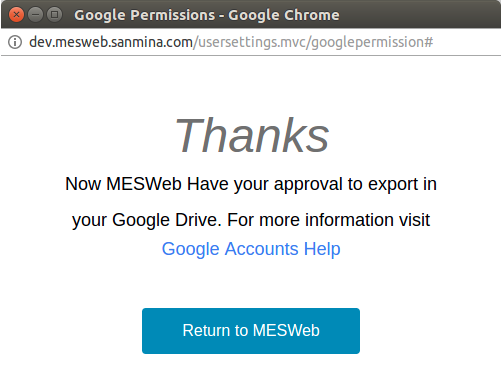
Step 3: A message will be displayed when the configuration is done:
Figure 10: Export Report
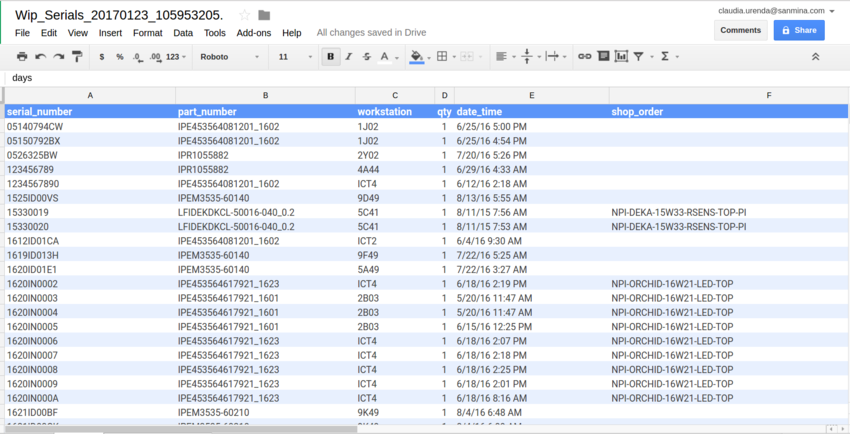
Step 4: See the report exported in the selected format:
Figure 11: Export Report
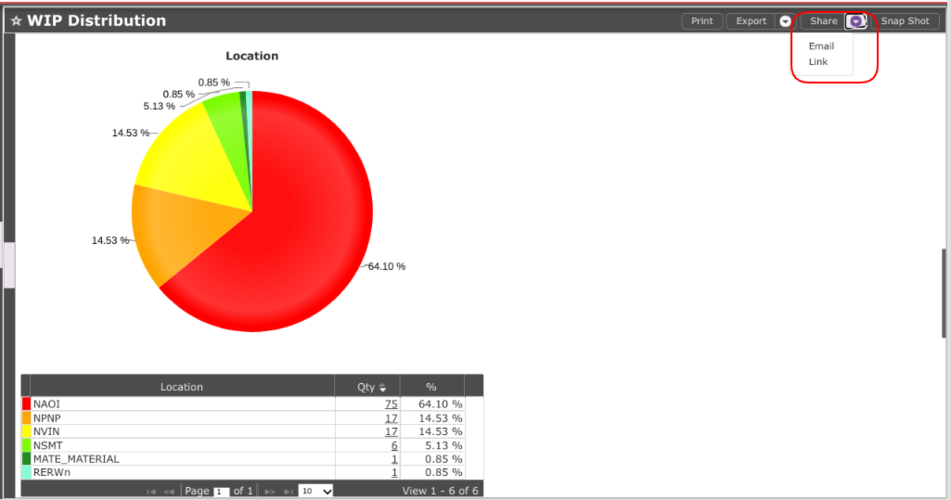
This option is used to share the report's results. The user can share the report via Email or as a Link.
Figure 12: Share Report Result
Drilldowns
Drilldowns occur when a link is selected by the user in order to drill down or further expand the data. To access Drilldown reports, select the parent link. This report will generate another report using a parameter passed by the selected link from the first report. This second report will use the default configuration (i.e., WEB format and pagination) to generate the data. WIP serials, a default report that shows the serial numbers and other information, have a Drilldown to Unit History. Drilldowns can be identified by their format; they are all underscored.
Figure 13: Drilldown Reports
Tools
Snap Shots
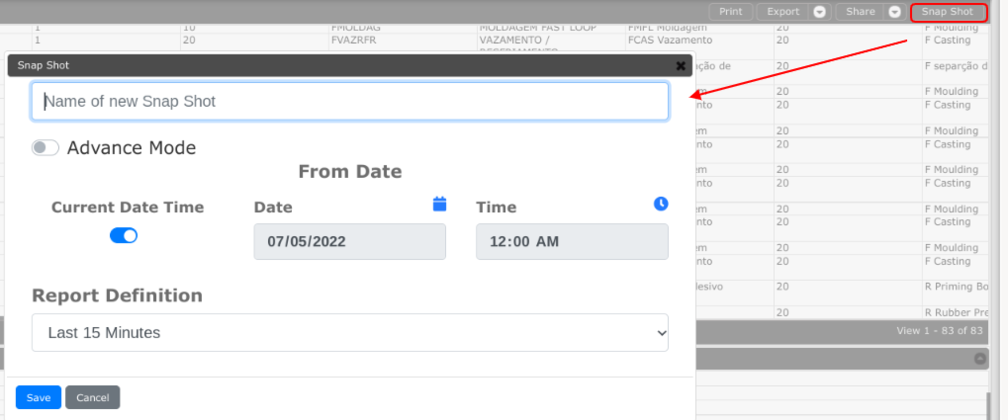
This tool allows users to schedule a report with selected parameters saved at a certain time and sent to certain users.
Figure 14: Snapshot
Follow the steps below to create a Schedule:
1. Select the configuration icon in the top right corner of the page
2. Select Snap Shots within the list menu to open the Snap Shots window
Figure 15: SnapShot Schedule
3. Select the plus-sign icon to the left of the SnapShot to expand.
4. Select the plus-sign icon to the far right on the schedule bar to open the Schedule Configuration form.
Figure 16: SnapShot Additional Information
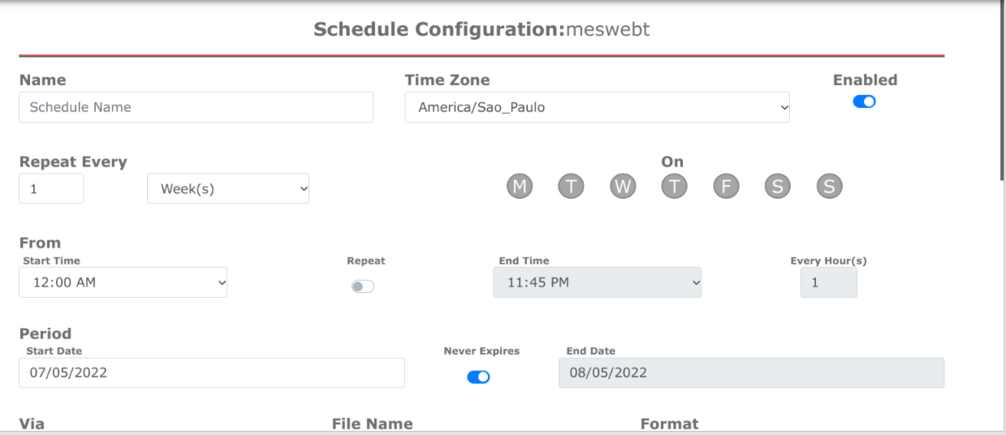
The Schedule Configuration form appears where the user can enter specific information, such as Name, Time Zone, and Frequency, about the schedule.
| The Frequency section allows the user to establish the timing settings for running a report. |
Figure 17: Schedule Configuration
In Schedule Information, Name, enabled and Time zone can be modified. In Repeat Every, the user can set all settings on when the report is going to run.
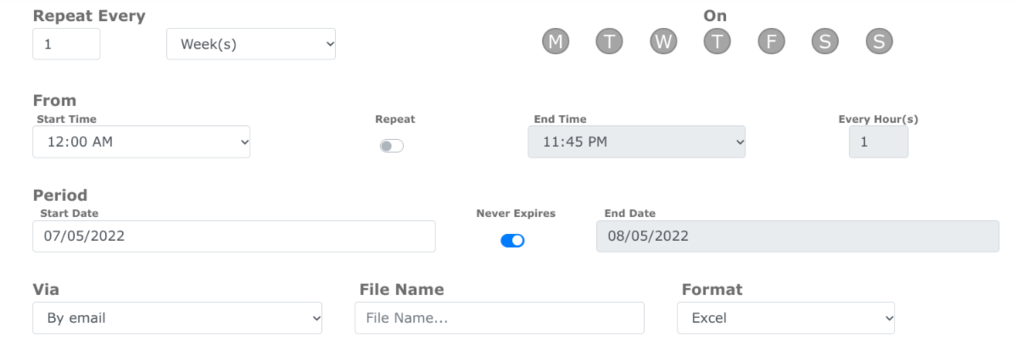
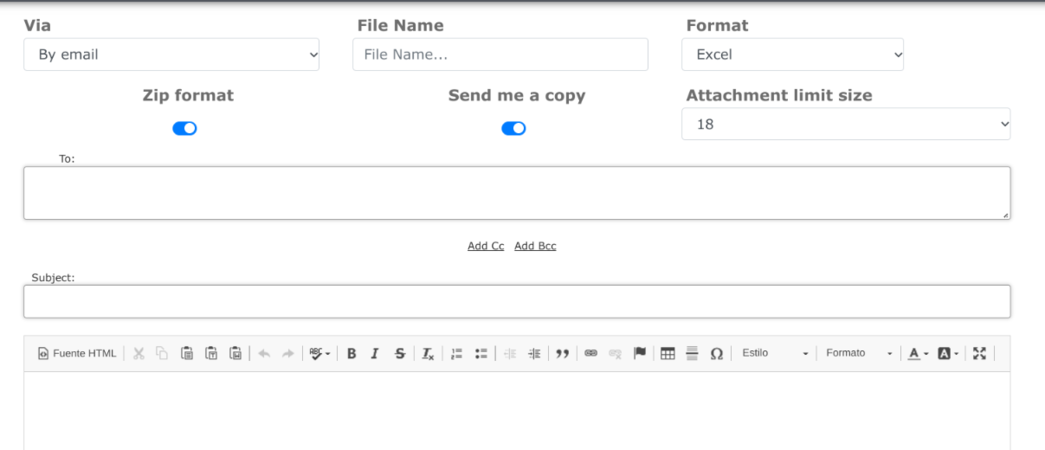
The Period section allows the user to set a date range for execution or repetition. Users can also select how would they like the report to be delivered by choosing from the available options in the Delivery options section.
Figure 18: Duration and Delivery Options
In the example above, the report will be delivered via email in Excel format.
Figure 19: Sending
This form is shown when users select Email on Delivery Options.
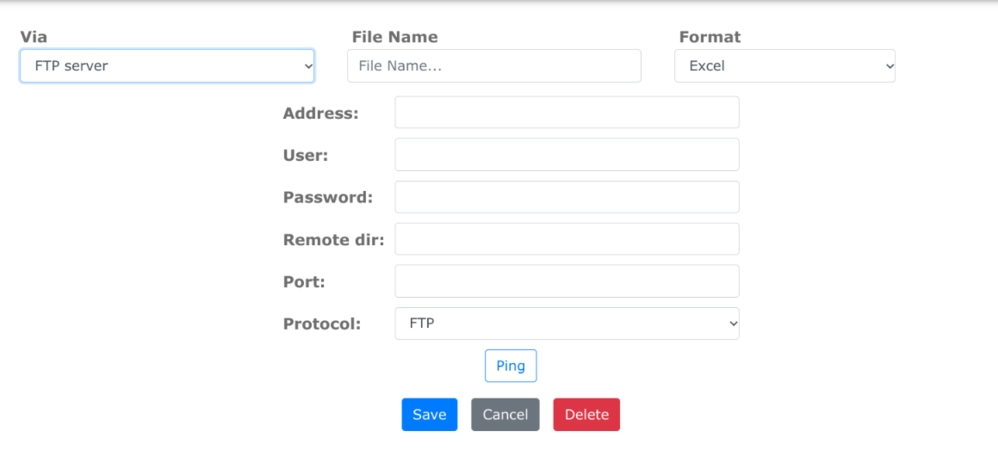
Figure 20: Sending via FTP Server
Once the FTP information has been entered and set up, the user can Save, Cancel, or Delete the scheduled report
Most Viewed and Favorites
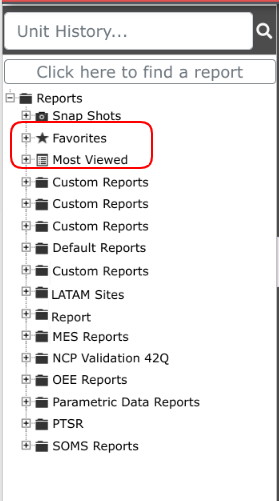
MESWeb will automatically save the most viewed reports. This will be shown within the Most Viewedgroup as well as every report has a star on the header that allows the user to save reports on the Favorites group.
Figure 21: Most Viewed and Favorites
Predefined Reports
Predefined Reports are reports that cannot be changed in the Report Builder. These reports have more complex functions and are more complete. They can also be viewed graphically.
Sometimes, the user can see sub-reports in a Predefined Report. The most common Predefined Report is the Unit History Report, which allows the user to query data from multiple tables.
Default Reports
Custom Reports
Custom Reports is a categorization of report types that users can create. Custom reports perform that function of default reports and allow users to be more specific and narrow in their searches within the application.
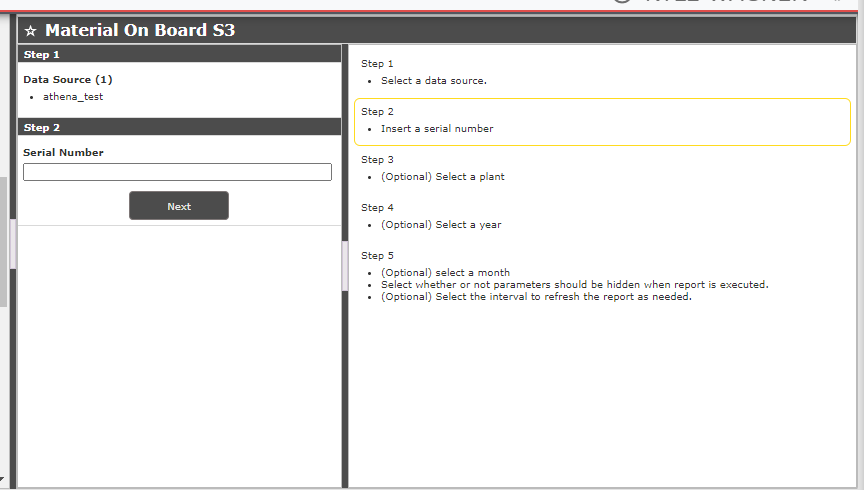
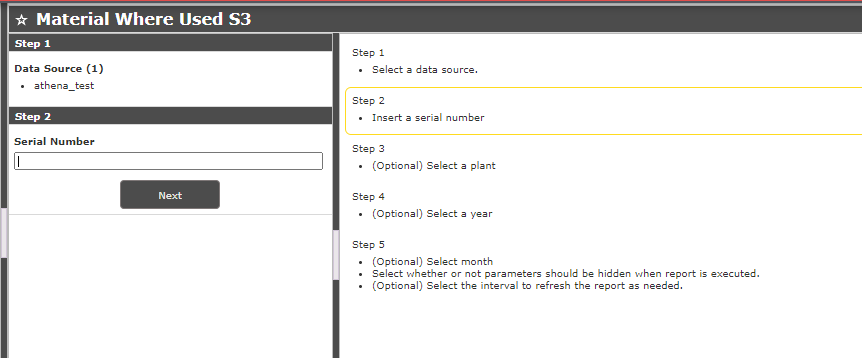
See the steps below the steps to generate a Custom Report by Serial Number:
- Select a data source.
- Insert a serial number.
- (Optional) Select a plant.
- (Optional) Select a year.
- (Optional) Select a month.
- Select whether or not parameters should be hidden when the report is executed.
- (Optional) Select the interval to refresh the report as needed.
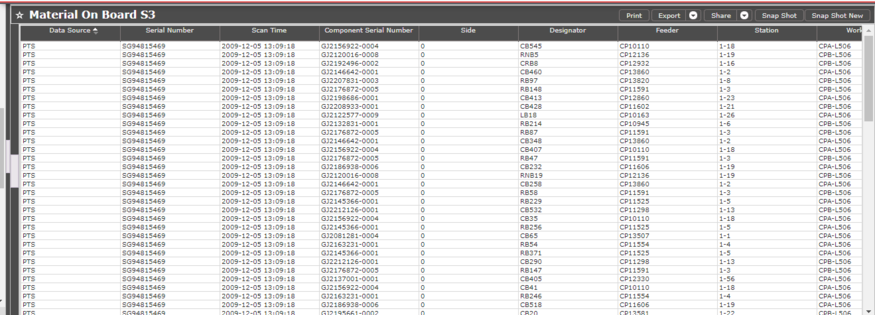
The report result is:
Figure 22: Report 1 - Material on Board S3
Note: This report will be able to use the serial number for finding its use in all of the materials from PTSR and Fujitrax databases, and show its scan board data and material information.
See the steps below the steps to generate a Custom Report by Date Period:
- Select a data source.
- Insert a serial number.
- (Optional) Select a plant.
- (Optional) Select a year.
- (Optional) Select a month.
- Select whether or not parameters should be hidden when the report is executed.
- (Optional) Select the interval to refresh the report as needed.
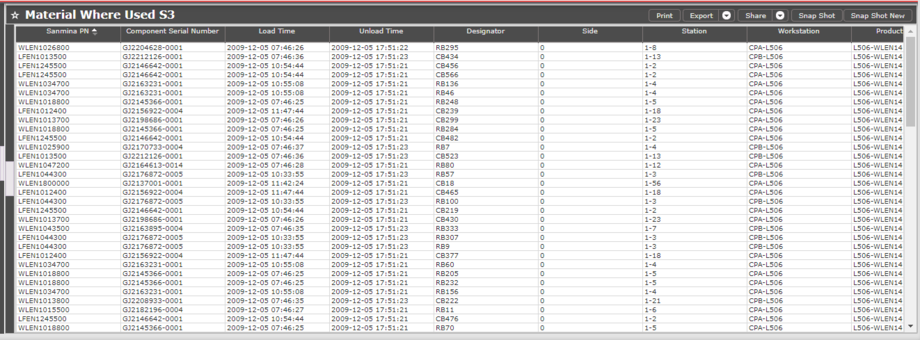
The report result is:
Figure 23: Report 2 - Material Where Used S3
Note: This report will be able to use a scanning date period to retrieve its serial number.
Shop Order Report
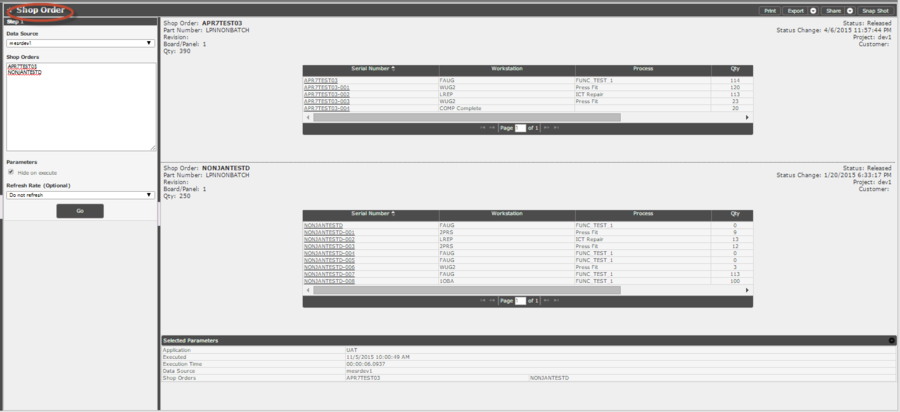
The Shop Order Report presents details for one or more shop orders along with all serials associated with them. It is important for users to track shop orders, and in order to do so, a user needs to be able to see the details of the units that comprise the shop order.
Follow the steps below to generate a Shop Order Report:
1. Select a Data Source
2. Enter up to 1000 Shop Order Numbers
3. Select whether or not parameters should be hidden when the report is executed
4. (Optional) Select the interval to refresh the report as needed
The report result is:
Figure 24: Shop Order Report
Shop Order Summary Report
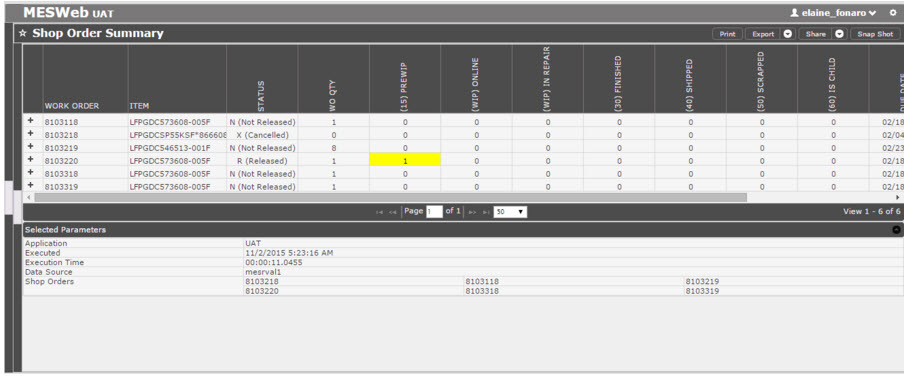
The Shop Order Summary Report displays information about the part numbers, the order status, and the quantity of units in each status of a shop order.
Follow the steps below to execute the Shop Order Summary Report:
1. Select a Data Source
2. Enter up to 100 Shop Orders (only one per line)
3. Select whether or not parameters should be hidden when the report is executed
4. (Optional) Select the interval to refresh the report as needed
The report result is:
Figure 25: Shop Order Summary Report
By entering one or several Shop orders this report will display information about, their part numbers, order status, and the quantity of units in each status.
Top Defect Evolution Report
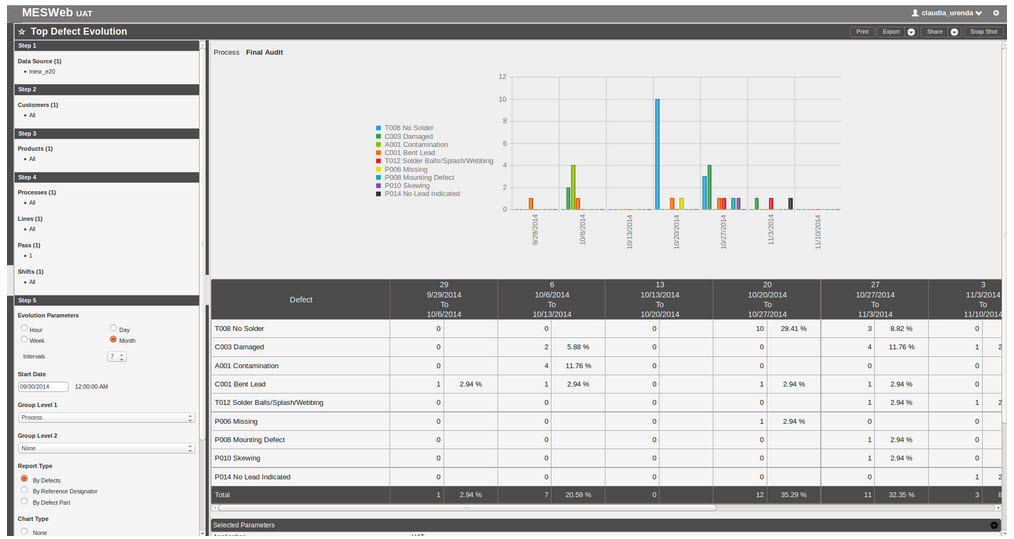
The Top Defect Evolution Report allows users to have a better view of defects registered in MESR for one or more products. Those defects are classified by defect name, which produces a sum (number of defects and percent defect from total) of defects found in a given range for the specific defect. This report also lists the defect total based on a range of time.
Follow the steps below to generate a Top Defect Evolution Report:
1. Select a Data Source
2. Select one or more Customers
3. Select one or more Products
4. Select one or more Processes
5. Select one or more Lines
6. Select a Pass to view
7. Select one or more Shifts
8. Set the values for the Evolution Parameter
9. Select Start Date
10. Select which field to group by first
11. (Optional) Select which field to group by the second
12. Select the type of report you want to run
13. Indicate if you would like to view graphs, and, if so, select the type
14. Select whether or not parameters should be hidden when the report is executed
15. (Optional) Select the interval to refresh the report as needed
The report result is:
Figure 26: Top Defect Evolution Report
WIP Distribution Report
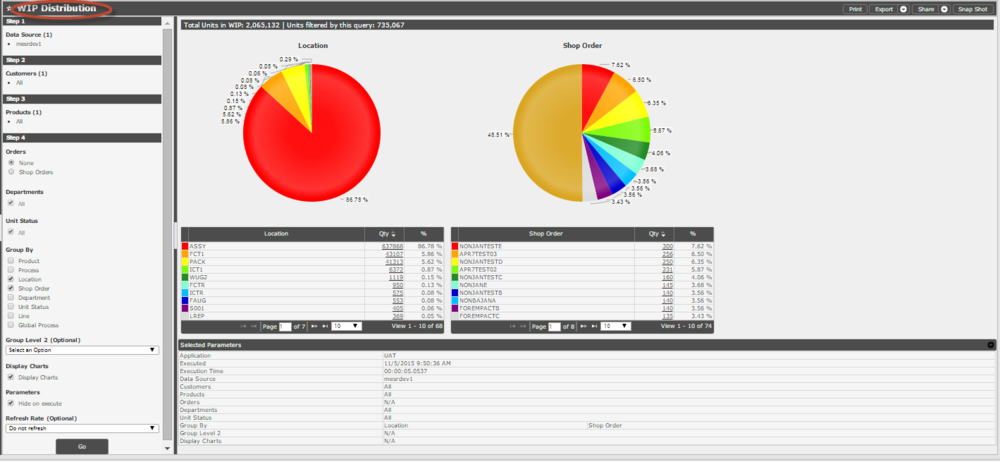
The WIP Distribution Report is designed to take the parameters specified by the user and return the number of units that are currently in WIP based on those parameters. The WIP Distribution Report can group results in several ways, depending on the user's preferences. The top level of the results offers the ability to drill down to the unit details. The WIP Distribution Report aims to give users the ability to get a snapshot of where their plant s workload is distributed.
Follow the steps below to generate a WIP Distribution Report:
1. Select a Data Source
2. Select one or more Customers
3. Select one or more Products
4. (Optional) null
5. Select one or more Departments
6. Select one or more Unit Statuses
7. (Optional) Select one or more Processes
8. Select one or more Workstations
9. Select whether or not parameters should be hidden when the report is executed
10. (Optional) Select the interval to refresh the report as needed
Figure 27: WIP Distribution Report
Yield & Defect Report
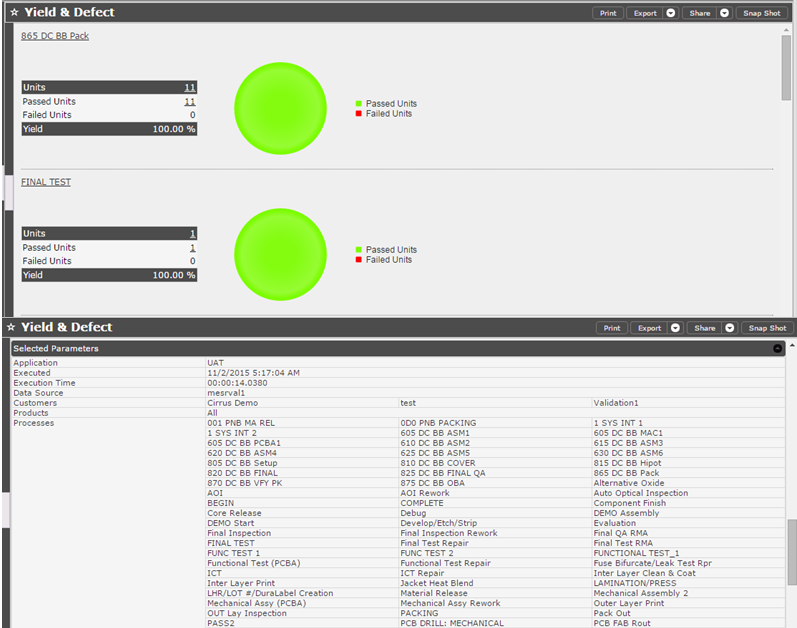
The purpose of the Yield & Defect Report is to give users a high-level overview of progress. It lists the total number of units with activity, pass/fail quantity, and the yield for each process that is selected (filtered by other parameters as well). From there users can see details about the most common defects for a given process as well as details about each unit.
Managers can use this information to pinpoint the areas on the floor that require their attention and discover why. To execute this report, the user must be in Execution Module, where he/she should select the Reports menu and navigate to Default Reports Yield & Defect Report.
Follow the steps below to generate a Yield & Defect Report:
1. Select a Data Source
2. Select one or more Customers
3. Select one or more Products
4. Select one or more Processes
5. Select one or more Lines
6. Select a Pass to view
7. Select one or more Shifts
8. Select one or more Workstations
9. Enter a Date Range or select one or more Orders
10. Select a field to group by
11. (Optional) Select a second field to group by
12. Choose whether to include moving units
13. Indicate if you would like to consider "No Fault Found" as passes
14. Indicate if you would like to view graphs
15. Select whether or not parameters should be hidden when the report is executed
16. (Optional) Select the interval to refresh the report as needed
The report result is:
Figure 28: Yield & Defect Report
Yield Evolution Report
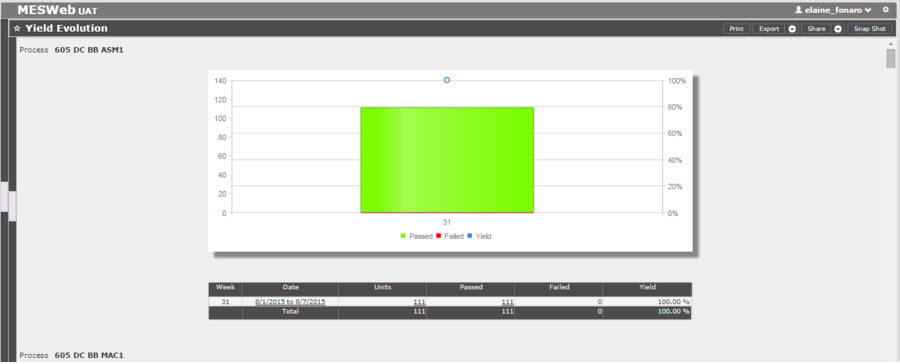
This report displays the percentage of success of the product for a determined period (Hour/Day/Week/Month). Users can view charts of this data and have tabular data presenting the hour/date/unit/passed/yield of a product. This data is presented via "All Products".
A Drilldown report, which offers more details about the product, is available for unit/passed/failed. To execute this report, the user must be in Execution Module, where he/she should select the Reports menu and navigate to Default Reports Yield Evolution Report.
Follow the steps below to generate a Yield Evolution Report:
1. Select a Data Source
2. Select one or more Customers
3. Select one or more Products
4. Select one or more Processes
5. Select one or more Lines
6. Select a pass to view
7. Select one or more Shifts
8. Set the values for the Evolution Parameter
9. Select Start Date
10. Select which field to group by first
11. (Optional) Select which field to group by the second
12. Choose whether to include moving units
13. Indicate if you would like to display charts
14. Select whether or not parameters should be hidden when the report is executed
15. (Optional) Select the interval to refresh the report as needed
The report result is:
Figure 29: Yield Evolution Report
Yield Serials Report
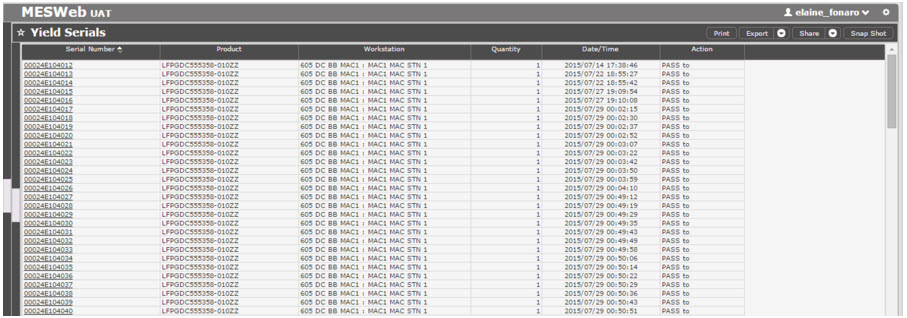
The Yield Serials Report displays the following information: Serial Number, Product, Workstation where the action occurred, Serial Quantity, Date of Action, and the Action.
Follow the steps below to generate a Yield Serials Report:
1. Select a Data Source
2. Select one or more Customers
3. Select one or more Products
4. Select one or more Processes
5. (Optional) Select one or more Lines
6. Select a pass to view
7. (Optional) Select one or more Shifts
8. (Optional) Select one or more Global Processes
9. (Optional) Select one or more Workstations
10. (Optional) Filter data by a Date Range
11. (Optional) Select number of Shop Orders
12. Select one or more Actions
13. Select whether or not parameters should be hidden when the report is executed
14. (Optional) Select the interval to refresh the report as needed
The report result is:
Figure 30: Yield Serials Report
Unit History Report
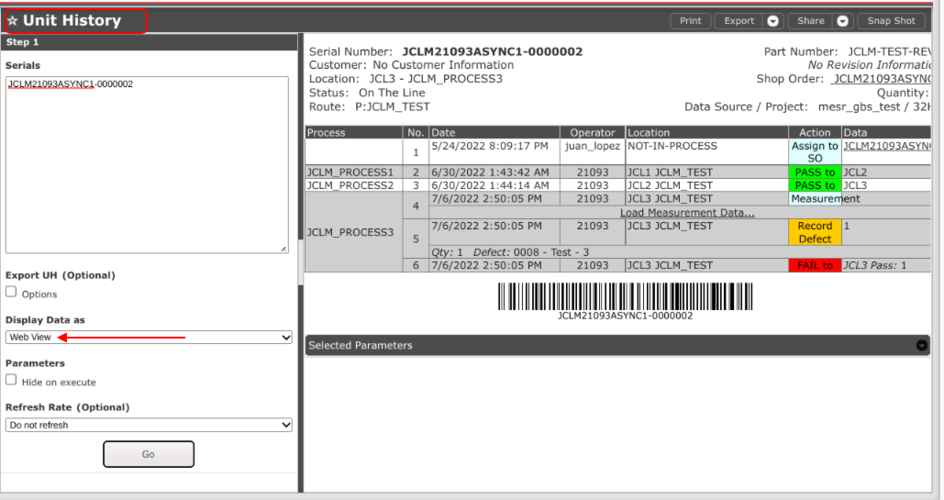
The Unit History Report gives detailed information about a specific unit and all its activities throughout its lifecycle. This allows users to see information about a specific unit and its activity.
Follow the steps below to generate a Unit History Report:
1. Enter up to 150 Serials
2. Select whether or not parameters should be hidden when the report is executed
3. (Optional) Select the interval to refresh the report as needed
Figure 31: Unit History
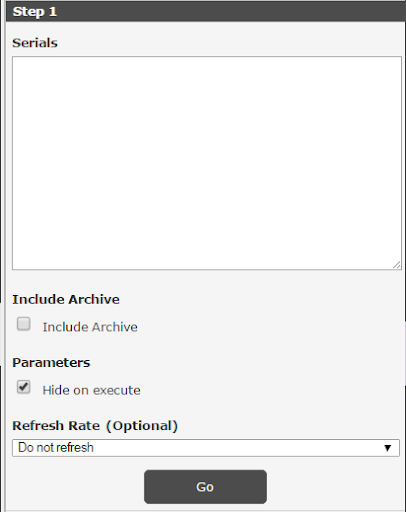
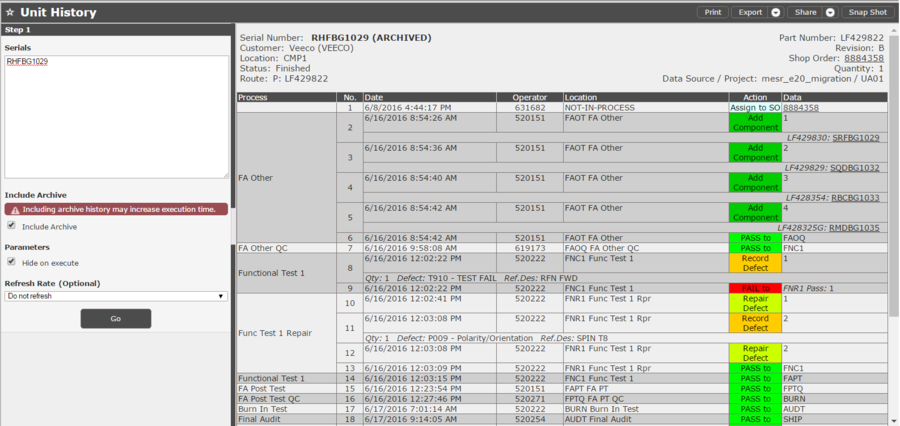
Unit History Report now has the capability to query data from MES Archive integrated into the report.
The Archive parameter was added to the report whether to query archive data or only be notified when searched serials have already been archived.
Figure 32: Unit History
When the report is executed with the Include Archive parameter selected, it will query Archive data for all searched serials that have been archived. Archived serials will be labeled as such, and data will be presented in the same format as regular serials. Both archived and regular serials can be searched at the same time.
A Report executed with Include Archive selected
Figure 33: Unit History
When the report is executed with the Include Archive parameter unselected, serials that have been archived will be labeled as such, and the user will be given the option to click the link in order to get the data from Archive. This is to prevent a longer execution time in case the user is unaware serials have been already archived.
A report executed with Include Archive unselected
Figure 34: Unit History
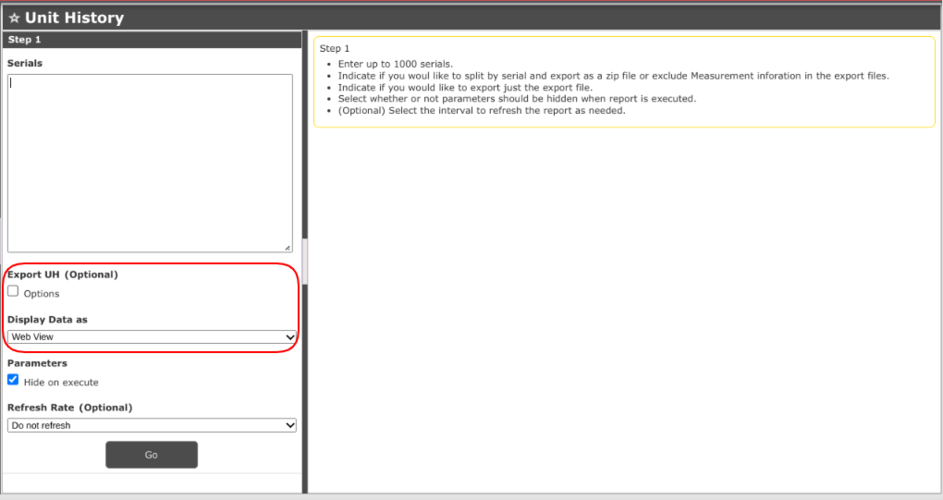
Export UH
Allows the user to export the report with the selected format without the render on the screen and to improve the performance.
'Figure 35: Export UH'
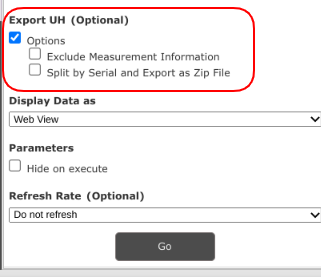
Export UH contains two options to export the file;' Exclude Measurement Information'and'Split by Serial and Export'as a'ZIP file. '
'Figure 36: Options for Export UH'
Note:If the users choose to split by serial and export as a Zip if they are multiple serial numbers, the Zip file will create a folder with all the numbers in a file.
'Display Data as'would allow users to choose from several different kinds of files to download/ view;'Web view, Excel File, Google Sheet, XML File CSV File, and Text File'.
Unit History With Multimedia File
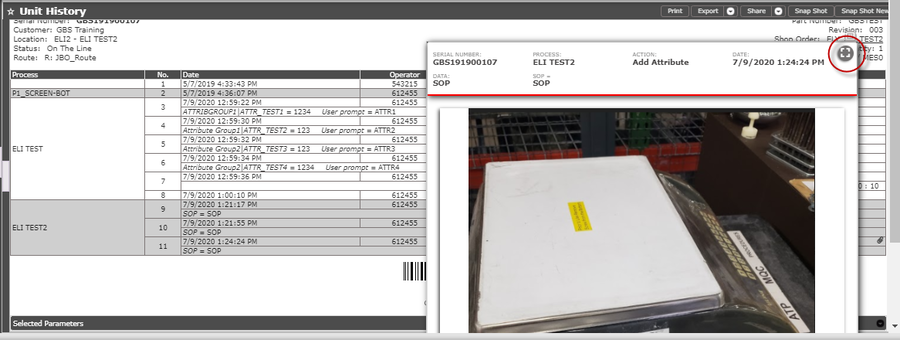
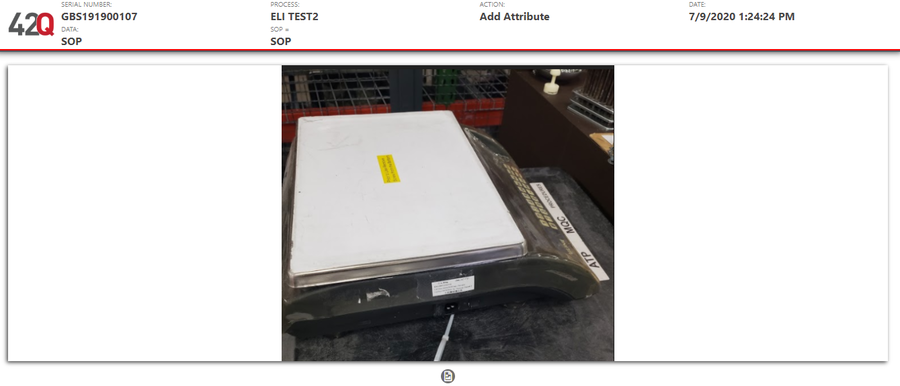
Production Workbench supports Multimedia Data Collection (PDF, Imagen, and Video) and users can take photos using their computer or tablet camera and upload any multimedia file.
This will reflect in the Unit History report, where the user is able to see the image upload for the SN.
For more information about Multimedia files, refer to Production Workbench SOP.
'Figure 37: Unit History with Multimedia File Attached'
Clicking on the image icon, the attached file will be displayed:
'Figure 38: Expanded Image'
Select the expand icon to see just the image.
'Figure 39: Uploaded Image Details'
Part Order Summary Report
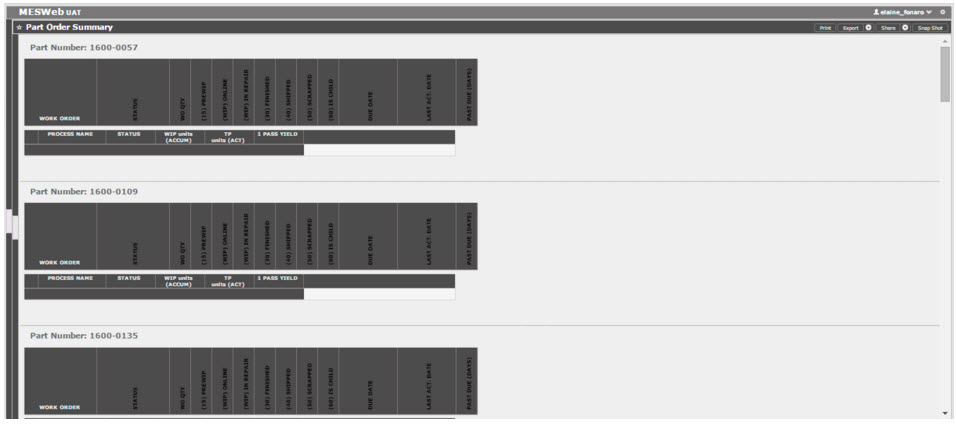
This report displays the following information about works orders: Part Number, Status, Quantity, and Serial Quantity. It also shows the due date, last activity, and how many days have passed before the due date.
Follow the steps below to generate a Part Order Report:
1. Select a Data Source
2. Enter up to 500 Part Numbers (one per line)
3. Select whether or not parameters should be hidden when the report is executed
4. (Optional) Select the interval to refresh the report as needed
'Figure 38: Part Order Summary'
RTY Report
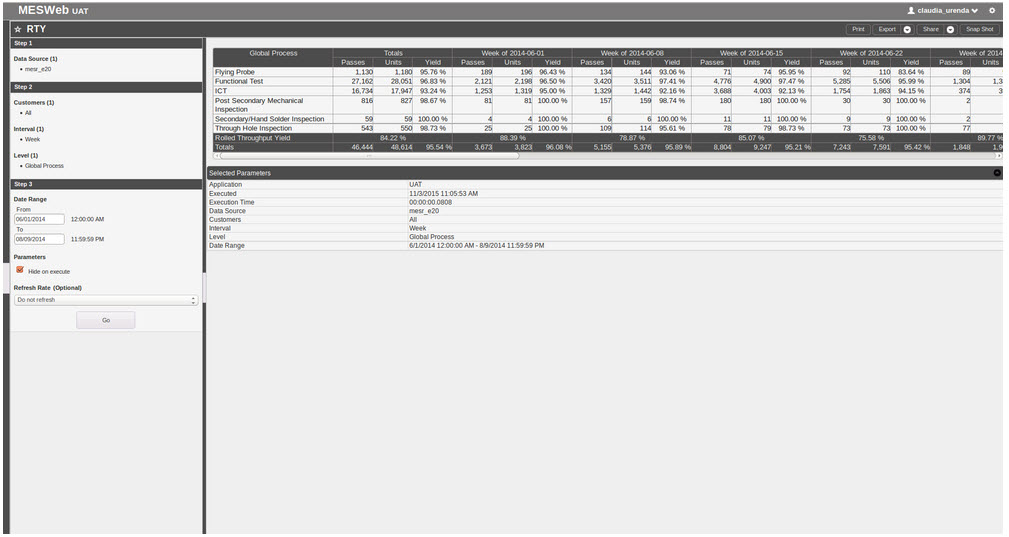
RTY shows how many activities were created by a Global Process. The report can display the results by month, week, or day.
Follow the steps below to generate an RTY Report:
1. Select a Data Source
2. Select one or more Customers
3. Select the Data Range (Start and End Dates)
4. Select whether or not parameters should be hidden when the report is executed
5. (Optional) Select the interval to refresh the report as needed
'Figure 39: RTY Report'
Workstation Monitor Report
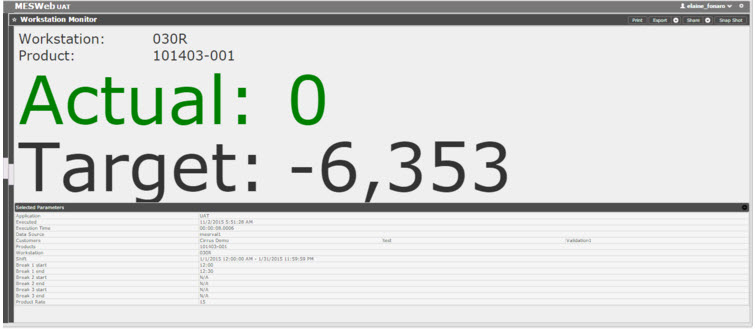
The Workstation Monitor Report shows how many units have been processed on a particular station.
| Follow the steps below to generate a Workstation MonitorReport: |
1. Select a Data Source
2. Select a Customer
3. Select a Product
4. Select a Workstation
5. Select the Date and Time Range for the Shift
6. Enter the start time for the first break (format: HH:mm)
7. Enter the end time for the first break (HH:mm)
8. (Optional) Enter the start time for the second break (HH:mm)
9. (Optional) Enter the end time for the second break (HH:mm)
10. (Optional) Enter the start time for the third break (HH:mm)
11. (Optional) Enter the end time for the third break (HH:mm)
12. Enter UPH target.
13. Select whether or not parameters should be hidden when the report is executed
14. (Optional) Select the interval to refresh the report as needed
'Figure 40: Workstation Monitor'
WIP Serials Report
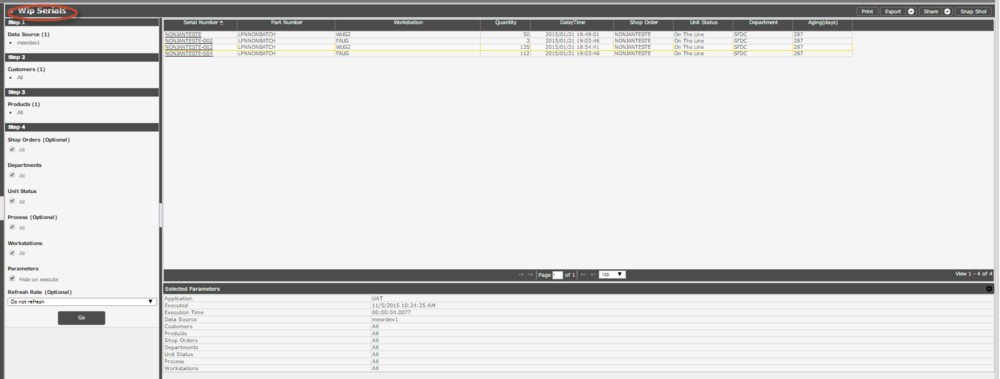
The WIP (Work in Process) Serials Report displays all the serial numbers that are in production.
Follow the steps below to generate a WIP Serial Report:
1. Select a Data Source
2. Select one or more Customers
3. Select one or more Products
4. Select the order that should be used to filter the results
5. Select one or more Departments
6. Select one or more Unit Status
7. Select one or more ways to group the information
8. (Optional) Select a field to group by
9. Indicate if you would like to display charts or not
10. Select whether or not parameters should be hidden when the report is executed
11. (Optional) Select the interval to refresh the report as needed
The report result is:
'Figure 41: WIP Serials'
Solder Paste Status Report
The Solder Paste Status Report details the status of any items with the Solder Paste inventory,specified by part and serial numbers. It shows the current status, with timestamp data.
See the steps below the steps to generate a Solder Paste Status Report
- Select a data source
- (Optional) Select a Solder Paste P/N
- (Optional) Select a Solder Paste S/N
- (Optional) Select a Solder Paste Status
- Select a date range
- Select whether or not parameters should be hidden when the report is executed.
- (Optional) Select the interval to refresh the report as needed.
The report result is:
'Figure 42: Solder Paste Status Report Result'
SOMS Reports
The SOMS Global Status Report is designed to start with a high-level overview of a plant's current operating status. The user can see the current number of units that are in the WIP, the yield for the current and previous days, and the throughput for the current and previous days for each of the plant's levels. Users also have the ability to drill down into a single level to see the same information broken out by line and process. The report is designed to give a quick snapshot of the health of a plant operation.
Follow the steps below to generate a SOMS Report:
1. Select a Data Source
2. (Optional) Enter the Mfg Line Name
3. (Optional) Enter the Scanner ID
4. (Optional) Enter the Multi-Pass Location Name
5. Select whether or not parameters should be hidden when the report is executed
6. (Optional) Select the interval to refresh the report as needed
'Figure 43: SOMS Setup'
QCP Checklist
'The QCP Checklist is a new functionality that allows the MESWeb users to access a set of questions and answers done previously in Production Workbench.'
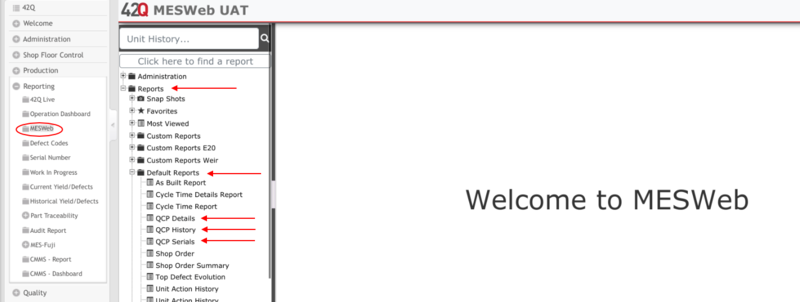
To enter the QCP Checklist the user must go to MESWeb>Reports>Default Reports,there, three different reports are available: QCP History, QCP Details, and QCP Serials.
'Figure 44: QCP Default Reports'
'Note: The user can access QCP History', QCP Details, and QCP Serialsby selecting them.
QCP History
'QCP History' is divided into four steps which allow the user to see the following parameters:
- 'Step 1: Data Source'
- 'Step 2:QCP Name'
- 'Step 3: Part Number, Process, Location, Employee, Obsoletes'
- 'Step 4: Data range.'
Note:These configurations are showing on the left side of the screen, as displayed in the following image:
'Figure 45: QCP History Steps'
The parameters mentioned above allow the user to have a customized search of the QCP Checklists, all of them are optional, except for Step 1:SourceandStep 4: Data Range; as shown in the image below.
The Data Range allows the user to search the previously filled/answered QCP checklists in the selected date ranges; once the user fills in the dates and time, they can click the Gobutton.
'Figure 46: Data Range'
The QCPinformation will be displayed on the screen, with their respective configuration; name, version, part number, etc.
'Figure 47: Data Range List'
'This list shows the Effective Date and the Expiration Date, it also shows the State of the QCP; this can be either Active or Expired, and the Employee ID from the user who filled the QCP checklist.'
Note:The Effective Date and the Expiration Date information is associated with every Serial Number, scanned between the active period of the checklist and before it expires.
QCP Details
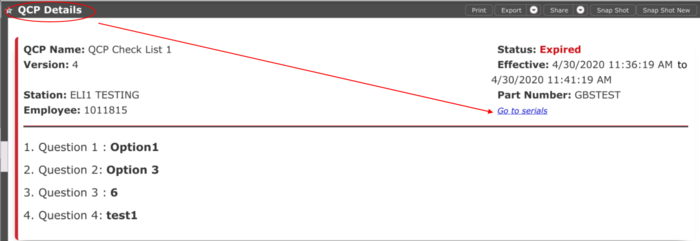
'QCP' Detailsallows the user to see and customize the information placed into the QCP checklist; Name, Status, Employees Id, etc. It also allows the user to see the questions and their respective answers.
The user can drill down from QCP Historyto QCP Details,by selecting the QCP Name in the list.
'Note:' The QCP Details have the same steps and the same parameters as QCP History (only the format is different).
'Figure 48: QCP Details'
'Note': The color on the sidebar, changes according to the status; Red= Expired, Green= Active
QCP Serials
To access the QCP Serials, the user can select the option from the QCP Details page, as displayed in the following image:
'Figure 49: QCP Serials'
Once this option is selected, the screen will display the QCP Serials,allowing the users to see the list of serials and their respective information, Serial Number, Part Number, Process, Location QCP name, and the QCP version.
'Figure 50: QCP Serials'
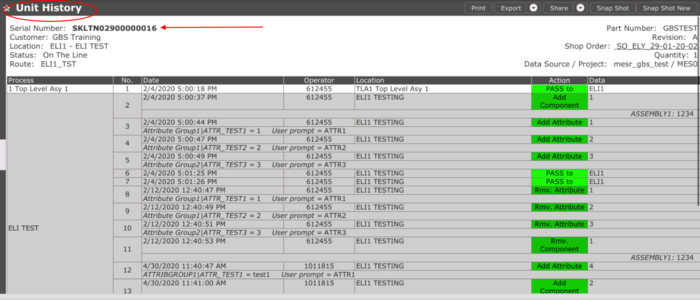
By selecting the Serial Number, shown on the image above; the user is able to see the Unit history.
This allows the user to see detailed information about the Serial Numbers and all their activity throughout their lifecycle.
'Figure 51: Unit History'
Crew Activity Reports
The Crew Activity Reportis a new functionality that allows the MESWebusers (Regular and Crew Users) to view the information and activities related to a specific Crew or Crew members.
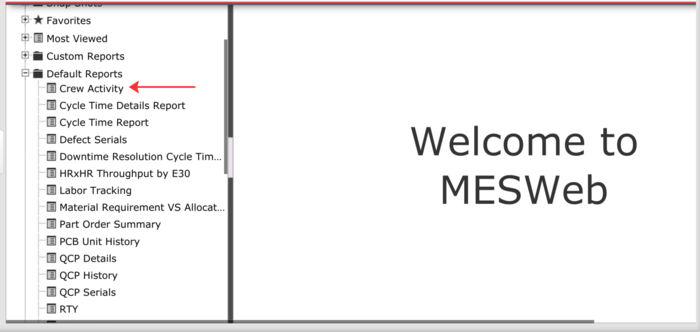
To enter the Crew Activity Reportthe user must go to MESWeb> Reports> Default Reports> Crew Activity.
'Figure 52: MESWeb Crew Activity'
'Note: The user can access Crew Activity Reports by selecting them and inserting information for each step provided.'
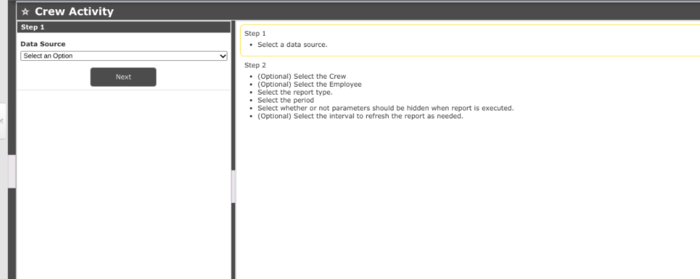
'Figure 53: Crew Activity - Data Source'
- 'Choose the Data Source provided with the drop-down menu of Data Source.'
- 'In order to choose a Data Source, users must select the customer. Users can search for a specific member report that may be available by “Crew” or by “Employee Number”. '
'Users can conduct searches by inserting information in the optional boxes. Users can search by using three options to find searches:'
- '‘Starts With’ option: Allows users to search using the first few letter(s) of the name.'
- '‘Contains’ option: Allows users to search with letters that are contained within the name.'
- '‘Ends With’ option: Allows users to search using the last few letter(s) of the name.'
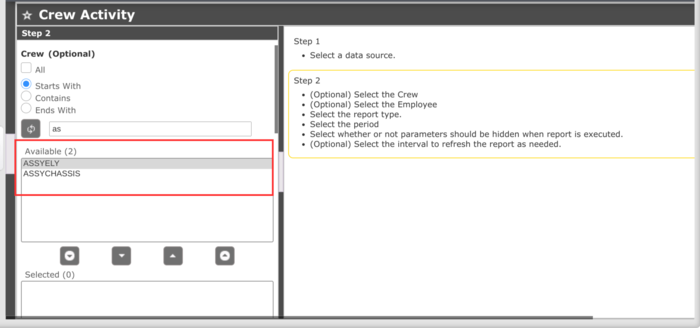
'Figure 54: Crew Activity - Crew'
Once the user types in the first few or last few letters to search, click the ‘Refresh’ button. Add the desired choice from the ‘Available’ list into the ‘Selected’ list by clickingthe downward arrow.
'Note: A specific Crew name should be selected in order to display the Report Type. '
The available options for crews are filtered for the crew name options.
'Figure 55: Add/Remove'
'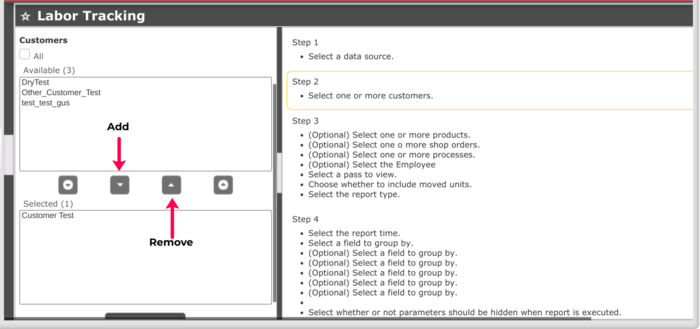
'Note: The down arrow will add the selected into the ‘Selected’ box below. The upward arrow will remove the selected from the ‘Selected’ box.'
'Figure 56: Crew Activity - Report Type'
- 'Next, select the Report Type desired. The options are as follows: '
- 'Crew Activity '
- 'Crew Status'
- 'Insert' the desired time period using the ‘From’and ‘To’ options and selecting the time for each.
- Setting a time period will allow users to see all the activities for a specific crew name selected. Note:Checking the box for the “Hide on execute” parameters option will hide the parameters once the report is executed.
- 'Click ‘Go’. The reports will be displayed as follows based on the Report Type chosen : '
Crew Activity
When the Crew Activity report is selected, the final form will allow users to view a specific crew name and description concerning information about when the user logged in and logged out.
'Figure 57: Report Type - Crew Activity'
- 'Crew Status '
- When the Crew Status report is selected, the final form will allow users to view information concerning crew members names, description, employee ID, and name.
'Figure 58: Report Type - Crew Status '
Labor Tracking Reports
'MESWeb's Labor Tracking report allows administrators to track employee labor records from a 90-day span. Administrators can then Print, Export, Share via Email/Link, or create a Snapshot. '
To access the 'Labor Tracking report,the user must go to MESWeb > Reports > Default Reports > Labor Tracking.'
'Figure 59: Labor Tracking - Data Source '
- 'Choose the data source from the ‘Data Source’ drop-down menu. '
- 'Click ‘Next’.'
'Figure 60: Labor Tracking - Customers'
- A list of customers will be displayed once the data source is selected.
- 'Select the customer desired. Once the customer is chosen, it will appear within the'‘Selected’ box.
- 'Click “Next”. '
'Figure 61: Labor Tracking - Products'
- Within Step 3,users will have four optional parameters to conduct a search. Those options are as follows :
- 'By selecting one or more optional Products.'
- 'By selecting one or more optional Shop Orders.'
- 'By selecting one or more optionalProcesses.'
- 'By selecting the optional Employee.'
'Figure 62: Labor Tracking - Shop Orders'
Users can search by‘Shop Order’by inserting the Shop Order number into the box provided and clicking the refresh button.
'Figure 63: Labor Tracking - Processes'
Users can search by ‘Processes’by inserting the processes title into the box provided and clicking the refresh button.
'Figure 64: Labor Tracking - Employee'
Users can search by Employee by inserting the Employee number into the box provided and clicking the refresh button.
'Figure 65: Labor Tracking - Report Type'
'Report Types: ' For Labor Tracking,there are different Report Types such as Employee Efficiency, Labor Tracking, Shop Order Direct, and Indirect Details. Each one of those reports supports different filters to consume the information of the activity tables.
- Upon choosing the desired Report Type, click ‘Next’.
'Figure 66: Labor Tracking - Report Time'
- Depending on the previous Report Type chosen, users will then be able to continue with Step 4 by selecting the options desired in each drop-down menu.
- 'Select' the Report Time. Options are as follows :
- 'Hours '
- 'Minutes '
- 'Select the field toGroup By, which has a given option based on the Report Type chosen.'
- 'Insert the desired time period using the ‘'From'’ and'‘To’ options and selecting the time for each.
Note: Checking the box for the“Hide on execute” parameters option will hide the parameters once the report is executed.
'Click' ‘Go’. The reports will be displayed as follows based on the Report Type chosen :
- 'Employee Efficiency'
When the Employee Efficiencyreport is '‘Grouped By’Employee and/or Shift, the final form will allow users to view:'
- 'The specific time that a member was working on a certain activity.'
- 'Good': quantity of units passed in the period of time selected by each employee.
- 'Scrap': quantity of units scrapped in the period of time selected by each employee.
- 'Standard Hours': the average time or number of hours that takes to manufacture a unit or assembly.
- 'Actual Indirect Hours': total time of indirect activities recorded against specific department/work center throughout Labor Tracking.
- 'Actual Direct Hours': elapsed time between the clock in and clock out of Labor activities.
- 'Actual Total Hours': comes from the calculation of total hours of indirect/direct activities recorded by employees against a department.
- 'Run Earned Hours': comes from the calculation of actual good parts produced (passed units) * quoted parts per hour (standard run hours).
- 'Run Efficiency Percentage: results from the calculation of Actual Total Hours/(Standard Hours * Throughput) *100.'
- 'Utilization Percentage: comes from the calculation of (Direct Hours/Actual Total Hours) * 100. '
'Figure 67: Report Type - Employee Efficiency Example (left side)'
'Figure 67.1: Report Type - Employee Efficiency Example (right side)'
Labor Tracking
When the Labor Tracking report is ‘Group By’ Shop Order, Product, Employee, Shift, Process, and/or Location, the final form will allow users to view the Shop Order, Product, Employee, Shift, Process, or Location and the direct hours associated with each.
'Figure 68: Report Type - Labor Tracking Example'
- 'Shop Order Direct'
- When the Shop Order Direct report information is‘Group By’ Shop Order, Employee, Shift, and/or Process the final form will allow users to view the employees and the direct hours spent on specific activities.
' Figure 69: Report Type - Shop Order Direct Example'
- 'Indirect Details'
- When the Indirect Detailed reports are ‘Group By’ Employeeand/or Shift, the final form will allow users to view information regarding employees and direct hours spent on specific activities.
' Figure 70: Report Type - Indirect Details Example'
Location Activity Report
The Location Activity Reportprovides users a list of locations that had any activity recorded (e.g. when a unit is scanned and passed to another location).
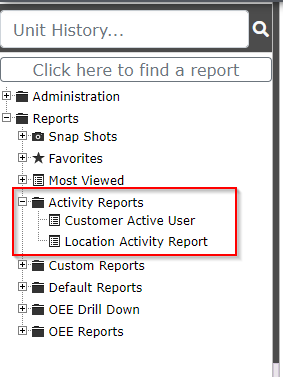
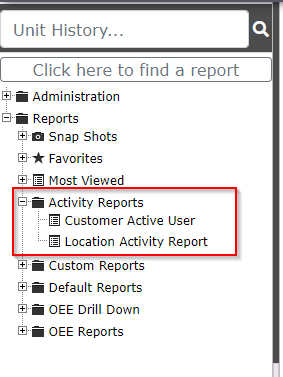
'To access this report navigate to Reporting > MESWeb > Activity Reports > Location Activity Report'
'Figure 71: Location Activity Report'
- Select a data source.
- Select the Mfg Line.
- Set the date range to search for location activities within that date range The date range limit is 90 days.
- Click on the Gobutton. A list of locations containing assigned processes, counters of the pass to, and counters of activity.
'Note: Pass to count' is how many units passed from that location and the Activity countis how many activities were recorded at that location (quantity of attributes or commands that are entered). The report only provides the list of locations that have Pass to count or Activity countvalues greater than 0.
'Figure 72: Location Activity Report Generated'
Customer Active User Report
The Customer Active User Report allows the extraction of active billable users who logged into the 42Q system. The report also provides users with the total billable user count. A billable user is the one who is assigned to a billable profile or is assigned to a non-billable profile but has access to reports other than Unit History Reports.
'To access this report navigate to Reporting > MESWeb > Activity Reports > Customer Active User Report'
'Figure 73: Customer Active User Report'
- Select a data source.
- Select a Client-Server.
- Select an Iportal Site.
- Select a MESWeb Application.
- 'Profile (Optional)' allows users to filter reports by different profiles.
- Set the date range to search for which the report should be generated. The date range limit is 31 days.
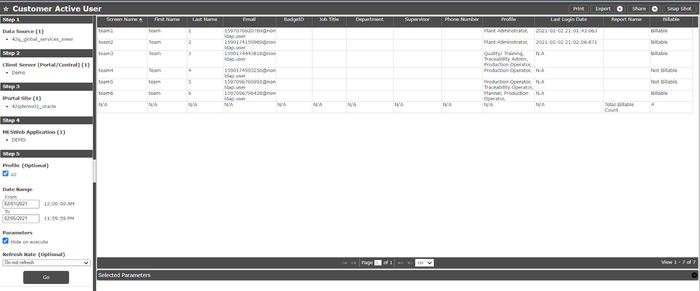
- Click on the Gobutton. A list of all the active users in the selected date range will be displayed. The last row of the report shows the count of total billable users.
'Figure 74: Customer Active User Report Generated'
