Difference between revisions of "SOP-42Q-MDS0029 CMMS Dashboard"
| Line 34: | Line 34: | ||
*'''WFB (Waiting for Buy Off)''' | *'''WFB (Waiting for Buy Off)''' | ||
| − | <u>'''NOTE'''</u>: Plants predefine status types to reflect their company’s work flow. Configuration of machine assets is completed in the '''CMMS Asset''' portal: '''Shop Floor Control > Configuration > CMMS Asset'''.<br> | + | <u>'''NOTE'''</u>: Plants predefine status types to reflect their company’s work flow. Configuration of machine assets is completed in the '''CMMS Asset''' portal: '''Shop Floor Control > Configuration > CMMS Asset'''.<br> |
| + | |||
| + | ==== Asset Type Display ==== | ||
| + | |||
| + | Icons in the Dashboard portal display brilliant, contrasting colors; coordinating color schemes and icon sizes are selected by default. If desired, users may adjust the appearance of the dashboard. Users may change'''color'''; '''text box width and height'''; '''asset name font size'''; and the update '''rate''' of the dashboard screen. To change any elements of the screen’s appearance, navigate to the '''Style Set''' panel. ('''<u>NOTE</u>''': '''Style Set Panel''' automatically displays after the '''Machine Status''' icon is selected. See '''Figure 2''', below.)<br> <br><br> | ||
Revision as of 13:55, 21 June 2017
42Q Home > Reporting > CMMS Dashboard

This edition applies to MES 15 Portal1.0 and all subsequent releases and modifications until otherwise indicated in new revisions.
CMMS Dashboard
CMMS Dashboard provides a dynamic visual overview of the production floor. Managers can view machine status, work order repair, and production line activity in real time. Typically, Dashboard is viewed on a large screen situated directly on the shop floor. CMMS Dashboard conveys information in a visually-pleasing, simple format. Assets are color coded according to their status. Dashboard screens are accessible via URL, thus eliminating extra steps navigating the CMMS portal.
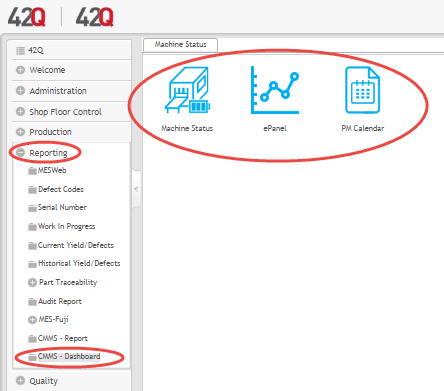
CMMS Dashboard is located in 42Q’s Reporting section (Navigate to Reporting > CMMS Dashboard) and is comprised of three submodules: Machine Status; ePanel; and PM Calendar.
Figure 1: Dashboard Submodules
Machine Status Submodule
The Machine Status submodule displays the status of all assets on a production line. Asset status is color coded for quick information retrieval. The following machine status types are available for view:
- In Use (Running)
- Rejected
- Spare
- PM (Maintenance)
- Stop Down (Down and not running)
- Non-Stop Down (Down but still running)
- WFP (Waiting for Parts)
- WFB (Waiting for Buy Off)
NOTE: Plants predefine status types to reflect their company’s work flow. Configuration of machine assets is completed in the CMMS Asset portal: Shop Floor Control > Configuration > CMMS Asset.
Asset Type Display
Icons in the Dashboard portal display brilliant, contrasting colors; coordinating color schemes and icon sizes are selected by default. If desired, users may adjust the appearance of the dashboard. Users may changecolor; text box width and height; asset name font size; and the update rate of the dashboard screen. To change any elements of the screen’s appearance, navigate to the Style Set panel. (NOTE: Style Set Panel automatically displays after the Machine Status icon is selected. See Figure 2, below.)
