Difference between revisions of "How to create CPK/PPK charts"
| Line 1: | Line 1: | ||
| − | = <span class="mw-headline" id="Summary"><span class="mw-headline" id="Summary"><span class="mw-headline" id="Summary"><span class="mw-headline" id="Summary"><span class="mw-headline" id="Summary"><span class="mw-headline" id="Summary"><span class="mw-headline" id="Summary"><span class="mw-headline" id="Summary"><span class="mw-headline" id="Summary"><span class="mw-headline" id="Summary"><span class="mw-headline" id="Summary"><span class="mw-headline" id="Summary"><span class="mw-headline" id="Summary"><span class="mw-headline" id="Summary"><span class="mw-headline" id="Summary">Summary</span></span></span></span></span></span></span></span></span></span></span></span></span></span></span> = | + | = <span class="mw-headline" id="Summary"><span class="mw-headline" id="Summary"><span class="mw-headline" id="Summary"><span class="mw-headline" id="Summary"><span class="mw-headline" id="Summary"><span class="mw-headline" id="Summary"><span class="mw-headline" id="Summary"><span class="mw-headline" id="Summary"><span class="mw-headline" id="Summary"><span class="mw-headline" id="Summary"><span class="mw-headline" id="Summary"><span class="mw-headline" id="Summary"><span class="mw-headline" id="Summary"><span class="mw-headline" id="Summary"><span class="mw-headline" id="Summary"><span class="mw-headline" id="Summary">Summary</span></span></span></span></span></span></span></span></span></span></span></span></span></span></span></span> = |
This How-To Create CPK/PPK Charts document will teach users how to '''create''' a new monitor as well as '''set up''' a '''Data Strategy Collection''', '''Standard Control Chart''', '''Available Charts''', and '''Actions''', applied to the new monitor. | This How-To Create CPK/PPK Charts document will teach users how to '''create''' a new monitor as well as '''set up''' a '''Data Strategy Collection''', '''Standard Control Chart''', '''Available Charts''', and '''Actions''', applied to the new monitor. | ||
| Line 19: | Line 19: | ||
| | ||
| − | = <span class="mw-headline" id="How_to_create_a_new_monitor_with_a_CPK.2FPPK_chart"><span class="mw-headline" id="How_to_create_a_new_monitor_with_a_CPK.2FPPK_chart"><span class="mw-headline" id="How_to_create_a_new_monitor_with_a_CPK.2FPPK_chart"><span class="mw-headline" id="How_to_create_a_new_monitor_with_a_CPK.2FPPK_chart"><span class="mw-headline" id="How_to_create_a_new_monitor_with_a_CPK.2FPPK_chart"><span class="mw-headline" id="How_to_create_a_new_monitor_with_a_CPK.2FPPK_chart"><span class="mw-headline" id="How_to_create_a_new_monitor_with_a_CPK.2FPPK_chart"><span class="mw-headline" id="How_to_create_a_new_monitor_with_a_CPK.2FPPK_chart"><span class="mw-headline" id="How_to_create_a_new_monitor_with_a_CPK.2FPPK_chart"><span class="mw-headline" id="How_to_create_a_new_monitor_with_a_CPK.2FPPK_chart"><span class="mw-headline" id="How_to_create_a_new_monitor_with_a_CPK.2FPPK_chart"><span class="mw-headline" id="How_to_create_a_new_monitor_with_a_CPK.2FPPK_chart"><span class="mw-headline" id="How_to_create_a_new_monitor_with_a_CPK.2FPPK_chart"><span class="mw-headline" id="How_to_create_a_new_monitor_with_a_CPK.2FPPK_chart">How to create a new monitor with a CPK/PPK chart</span></span></span></span></span></span></span></span></span></span></span></span></span></span> = | + | = <span class="mw-headline" id="How_to_create_a_new_monitor_with_a_CPK.2FPPK_chart"><span class="mw-headline" id="How_to_create_a_new_monitor_with_a_CPK.2FPPK_chart"><span class="mw-headline" id="How_to_create_a_new_monitor_with_a_CPK.2FPPK_chart"><span class="mw-headline" id="How_to_create_a_new_monitor_with_a_CPK.2FPPK_chart"><span class="mw-headline" id="How_to_create_a_new_monitor_with_a_CPK.2FPPK_chart"><span class="mw-headline" id="How_to_create_a_new_monitor_with_a_CPK.2FPPK_chart"><span class="mw-headline" id="How_to_create_a_new_monitor_with_a_CPK.2FPPK_chart"><span class="mw-headline" id="How_to_create_a_new_monitor_with_a_CPK.2FPPK_chart"><span class="mw-headline" id="How_to_create_a_new_monitor_with_a_CPK.2FPPK_chart"><span class="mw-headline" id="How_to_create_a_new_monitor_with_a_CPK.2FPPK_chart"><span class="mw-headline" id="How_to_create_a_new_monitor_with_a_CPK.2FPPK_chart"><span class="mw-headline" id="How_to_create_a_new_monitor_with_a_CPK.2FPPK_chart"><span class="mw-headline" id="How_to_create_a_new_monitor_with_a_CPK.2FPPK_chart"><span class="mw-headline" id="How_to_create_a_new_monitor_with_a_CPK.2FPPK_chart"><span class="mw-headline" id="How_to_create_a_new_monitor_with_a_CPK.2FPPK_chart">How to create a new monitor with a CPK/PPK chart</span></span></span></span></span></span></span></span></span></span></span></span></span></span></span> = |
SPC monitors should be created under an existing monitor group. To create a monitor, users must follow the following steps listed below: | SPC monitors should be created under an existing monitor group. To create a monitor, users must follow the following steps listed below: | ||
| Line 103: | Line 103: | ||
| | ||
| − | == <span class="mw-headline" id="How_to_generate_a_CPK.2FPPK_chart_using_.E2.80.98Auto_Collection_from_Unit.E2.80.99"><span class="mw-headline" id="How_to_generate_a_CPK.2FPPK_chart_using_.E2.80.98Auto_Collection_from_Unit.E2.80.99"><span class="mw-headline" id="How_to_generate_a_CPK.2FPPK_chart_using_.E2.80.98Auto_Collection_from_Unit.E2.80.99"><span class="mw-headline" id="How_to_generate_a_CPK.2FPPK_chart_using_.E2.80.98Auto_Collection_from_Unit.E2.80.99"><span class="mw-headline" id="How_to_generate_a_CPK.2FPPK_chart_using_.E2.80.98Auto_Collection_from_Unit.E2.80.99"><span class="mw-headline" id="How_to_generate_a_CPK.2FPPK_chart_using_.E2.80.98Auto_Collection_from_Unit.E2.80.99"><span class="mw-headline" id="How_to_generate_a_CPK.2FPPK_chart_using_.E2.80.98Auto_Collection_from_Unit.E2.80.99"><span class="mw-headline" id="How_to_generate_a_CPK.2FPPK_chart_using_.E2.80.98Auto_Collection_from_Unit.E2.80.99"><span class="mw-headline" id="How_to_generate_a_CPK.2FPPK_chart_using_.E2.80.98Auto_Collection_from_Unit.E2.80.99"><span class="mw-headline" id="How_to_generate_a_CPK.2FPPK_chart_using_.E2.80.98Auto_Collection_from_Unit.E2.80.99"><span class="mw-headline" id="How_to_generate_a_CPK.2FPPK_chart_using_.E2.80.98Auto_Collection_from_Unit.E2.80.99"><span class="mw-headline" id="How_to_generate_a_CPK.2FPPK_chart_using_.E2.80.98Auto_Collection_from_Unit.E2.80.99"><span class="mw-headline" id="How_to_generate_a_CPK.2FPPK_chart_using_.E2.80.98Auto_Collection_from_Unit.E2.80.99"><span class="mw-headline" id="How_to_generate_a_CPK.2FPPK_chart_using_.E2.80.98Auto_Collection_from_Unit.E2.80.99"><span class="mw-headline" id="How_to_generate_a_CPK.2FPPK_chart_using_.E2.80.98Auto_Collection_from_Unit.E2.80.99"><span class="mw-headline" id="How_to_generate_a_CPK.2FPPK_chart_using_.E2.80.98Auto_Collection_from_Unit.E2.80.99">How to generate a CPK/PPK chart using ‘Auto Collection from Unit’</span></span></span></span></span></span></span></span></span></span></span></span></span></span></span></span> == | + | == <span class="mw-headline" id="How_to_generate_a_CPK.2FPPK_chart_using_.E2.80.98Auto_Collection_from_Unit.E2.80.99"><span class="mw-headline" id="How_to_generate_a_CPK.2FPPK_chart_using_.E2.80.98Auto_Collection_from_Unit.E2.80.99"><span class="mw-headline" id="How_to_generate_a_CPK.2FPPK_chart_using_.E2.80.98Auto_Collection_from_Unit.E2.80.99"><span class="mw-headline" id="How_to_generate_a_CPK.2FPPK_chart_using_.E2.80.98Auto_Collection_from_Unit.E2.80.99"><span class="mw-headline" id="How_to_generate_a_CPK.2FPPK_chart_using_.E2.80.98Auto_Collection_from_Unit.E2.80.99"><span class="mw-headline" id="How_to_generate_a_CPK.2FPPK_chart_using_.E2.80.98Auto_Collection_from_Unit.E2.80.99"><span class="mw-headline" id="How_to_generate_a_CPK.2FPPK_chart_using_.E2.80.98Auto_Collection_from_Unit.E2.80.99"><span class="mw-headline" id="How_to_generate_a_CPK.2FPPK_chart_using_.E2.80.98Auto_Collection_from_Unit.E2.80.99"><span class="mw-headline" id="How_to_generate_a_CPK.2FPPK_chart_using_.E2.80.98Auto_Collection_from_Unit.E2.80.99"><span class="mw-headline" id="How_to_generate_a_CPK.2FPPK_chart_using_.E2.80.98Auto_Collection_from_Unit.E2.80.99"><span class="mw-headline" id="How_to_generate_a_CPK.2FPPK_chart_using_.E2.80.98Auto_Collection_from_Unit.E2.80.99"><span class="mw-headline" id="How_to_generate_a_CPK.2FPPK_chart_using_.E2.80.98Auto_Collection_from_Unit.E2.80.99"><span class="mw-headline" id="How_to_generate_a_CPK.2FPPK_chart_using_.E2.80.98Auto_Collection_from_Unit.E2.80.99"><span class="mw-headline" id="How_to_generate_a_CPK.2FPPK_chart_using_.E2.80.98Auto_Collection_from_Unit.E2.80.99"><span class="mw-headline" id="How_to_generate_a_CPK.2FPPK_chart_using_.E2.80.98Auto_Collection_from_Unit.E2.80.99"><span class="mw-headline" id="How_to_generate_a_CPK.2FPPK_chart_using_.E2.80.98Auto_Collection_from_Unit.E2.80.99"><span class="mw-headline" id="How_to_generate_a_CPK.2FPPK_chart_using_.E2.80.98Auto_Collection_from_Unit.E2.80.99">How to generate a CPK/PPK chart using ‘Auto Collection from Unit’</span></span></span></span></span></span></span></span></span></span></span></span></span></span></span></span></span> == |
To generate a CPK/PPK chart using the '''Auto Collection from Unit''' option, follow the below step list: | To generate a CPK/PPK chart using the '''Auto Collection from Unit''' option, follow the below step list: | ||
| Line 181: | Line 181: | ||
| | ||
| − | == <span class="mw-headline" id="How_to_generate_a_CPK.2FPPK_chart_using_.E2.80.98Manual_Collection_via_SPC_UI.E2.80.99"><span class="mw-headline" id="How_to_generate_a_CPK.2FPPK_chart_using_.E2.80.98Manual_Collection_via_SPC_UI.E2.80.99"><span class="mw-headline" id="How_to_generate_a_CPK.2FPPK_chart_using_.E2.80.98Manual_Collection_via_SPC_UI.E2.80.99"><span class="mw-headline" id="How_to_generate_a_CPK.2FPPK_chart_using_.E2.80.98Manual_Collection_via_SPC_UI.E2.80.99"><span class="mw-headline" id="How_to_generate_a_CPK.2FPPK_chart_using_.E2.80.98Manual_Collection_via_SPC_UI.E2.80.99"><span class="mw-headline" id="How_to_generate_a_CPK.2FPPK_chart_using_.E2.80.98Manual_Collection_via_SPC_UI.E2.80.99"><span class="mw-headline" id="How_to_generate_a_CPK.2FPPK_chart_using_.E2.80.98Manual_Collection_via_SPC_UI.E2.80.99"><span class="mw-headline" id="How_to_generate_a_CPK.2FPPK_chart_using_.E2.80.98Manual_Collection_via_SPC_UI.E2.80.99"><span class="mw-headline" id="How_to_generate_a_CPK.2FPPK_chart_using_.E2.80.98Manual_Collection_via_SPC_UI.E2.80.99">How to generate a CPK/PPK chart using ‘Manual Collection via SPC UI’</span></span></span></span></span></span></span></span></span> == | + | == <span class="mw-headline" id="How_to_generate_a_CPK.2FPPK_chart_using_.E2.80.98Manual_Collection_via_SPC_UI.E2.80.99"><span class="mw-headline" id="How_to_generate_a_CPK.2FPPK_chart_using_.E2.80.98Manual_Collection_via_SPC_UI.E2.80.99"><span class="mw-headline" id="How_to_generate_a_CPK.2FPPK_chart_using_.E2.80.98Manual_Collection_via_SPC_UI.E2.80.99"><span class="mw-headline" id="How_to_generate_a_CPK.2FPPK_chart_using_.E2.80.98Manual_Collection_via_SPC_UI.E2.80.99"><span class="mw-headline" id="How_to_generate_a_CPK.2FPPK_chart_using_.E2.80.98Manual_Collection_via_SPC_UI.E2.80.99"><span class="mw-headline" id="How_to_generate_a_CPK.2FPPK_chart_using_.E2.80.98Manual_Collection_via_SPC_UI.E2.80.99"><span class="mw-headline" id="How_to_generate_a_CPK.2FPPK_chart_using_.E2.80.98Manual_Collection_via_SPC_UI.E2.80.99"><span class="mw-headline" id="How_to_generate_a_CPK.2FPPK_chart_using_.E2.80.98Manual_Collection_via_SPC_UI.E2.80.99"><span class="mw-headline" id="How_to_generate_a_CPK.2FPPK_chart_using_.E2.80.98Manual_Collection_via_SPC_UI.E2.80.99"><span class="mw-headline" id="How_to_generate_a_CPK.2FPPK_chart_using_.E2.80.98Manual_Collection_via_SPC_UI.E2.80.99">How to generate a CPK/PPK chart using ‘Manual Collection via SPC UI’</span></span></span></span></span></span></span></span></span></span> == |
This option enables users to push data to SPC using the SPC UI instead of using the Production Workbench Interface. | This option enables users to push data to SPC using the SPC UI instead of using the Production Workbench Interface. | ||
| Line 267: | Line 267: | ||
| | ||
| − | == <span class="mw-headline" id="How_to_generate_a_CPK.2FPPK_chart_using_.E2.80.98Automatic_Collection_via_SPC_API.E2.80.99"><span class="mw-headline" id="How_to_generate_a_CPK.2FPPK_chart_using_.E2.80.98Automatic_Collection_via_SPC_API.E2.80.99"><span class="mw-headline" id="How_to_generate_a_CPK.2FPPK_chart_using_.E2.80.98Automatic_Collection_via_SPC_API.E2.80.99"><span class="mw-headline" id="How_to_generate_a_CPK.2FPPK_chart_using_.E2.80.98Automatic_Collection_via_SPC_API.E2.80.99"><span class="mw-headline" id="How_to_generate_a_CPK.2FPPK_chart_using_.E2.80.98Automatic_Collection_via_SPC_API.E2.80.99"><span class="mw-headline" id="How_to_generate_a_CPK.2FPPK_chart_using_.E2.80.98Automatic_Collection_via_SPC_API.E2.80.99"><span class="mw-headline" id="How_to_generate_a_CPK.2FPPK_chart_using_.E2.80.98Automatic_Collection_via_SPC_API.E2.80.99"><span class="mw-headline" id="How_to_generate_a_CPK.2FPPK_chart_using_.E2.80.98Automatic_Collection_via_SPC_API.E2.80.99">How to generate a CPK/PPK chart using ‘Automatic Collection via SPC API’</span></span></span></span></span></span></span></span> == | + | == <span class="mw-headline" id="How_to_generate_a_CPK.2FPPK_chart_using_.E2.80.98Automatic_Collection_via_SPC_API.E2.80.99"><span class="mw-headline" id="How_to_generate_a_CPK.2FPPK_chart_using_.E2.80.98Automatic_Collection_via_SPC_API.E2.80.99"><span class="mw-headline" id="How_to_generate_a_CPK.2FPPK_chart_using_.E2.80.98Automatic_Collection_via_SPC_API.E2.80.99"><span class="mw-headline" id="How_to_generate_a_CPK.2FPPK_chart_using_.E2.80.98Automatic_Collection_via_SPC_API.E2.80.99"><span class="mw-headline" id="How_to_generate_a_CPK.2FPPK_chart_using_.E2.80.98Automatic_Collection_via_SPC_API.E2.80.99"><span class="mw-headline" id="How_to_generate_a_CPK.2FPPK_chart_using_.E2.80.98Automatic_Collection_via_SPC_API.E2.80.99"><span class="mw-headline" id="How_to_generate_a_CPK.2FPPK_chart_using_.E2.80.98Automatic_Collection_via_SPC_API.E2.80.99"><span class="mw-headline" id="How_to_generate_a_CPK.2FPPK_chart_using_.E2.80.98Automatic_Collection_via_SPC_API.E2.80.99"><span class="mw-headline" id="How_to_generate_a_CPK.2FPPK_chart_using_.E2.80.98Automatic_Collection_via_SPC_API.E2.80.99">How to generate a CPK/PPK chart using ‘Automatic Collection via SPC API’</span></span></span></span></span></span></span></span></span> == |
In this option, users can input the data using two different applications: '''IIoT''' and '''PWB'''. | In this option, users can input the data using two different applications: '''IIoT''' and '''PWB'''. | ||
| Line 316: | Line 316: | ||
| | ||
| − | === <span class="mw-headline" id="Push_data_via_IIOT"><span class="mw-headline" id="Push_data_via_IIOT"><span class="mw-headline" id="Push_data_via_IIOT"><span class="mw-headline" id="Push_data_via_IIOT"><span class="mw-headline" id="Push_data_via_IIOT"><span class="mw-headline" id="Push_data_via_IIOT"><span class="mw-headline" id="Push_data_via_IIOT"><span class="mw-headline" id="Push_data_via_IIOT">Push data via IIOT</span></span></span></span></span></span></span></span> === | + | === <span class="mw-headline" id="Push_data_via_IIOT"><span class="mw-headline" id="Push_data_via_IIOT"><span class="mw-headline" id="Push_data_via_IIOT"><span class="mw-headline" id="Push_data_via_IIOT"><span class="mw-headline" id="Push_data_via_IIOT"><span class="mw-headline" id="Push_data_via_IIOT"><span class="mw-headline" id="Push_data_via_IIOT"><span class="mw-headline" id="Push_data_via_IIOT"><span class="mw-headline" id="Push_data_via_IIOT">Push data via IIOT</span></span></span></span></span></span></span></span></span> === |
To push data via IIOT, users must do the Measurement Configuration, to do so, follow the step list below: | To push data via IIOT, users must do the Measurement Configuration, to do so, follow the step list below: | ||
| Line 390: | Line 390: | ||
<br/> '''Figure 24: SPC Mapping Configuration''' | <br/> '''Figure 24: SPC Mapping Configuration''' | ||
| − | [[File:HTCC SPC Mapping Configuration.png|900px]]<br/> | + | [[File:HTCC SPC Mapping Configuration.png|900px|HTCC SPC Mapping Configuration.png]]<br/> |
| | ||
<ol start="14"> | <ol start="14"> | ||
<li>Select the '''Configuration Groups''' tab.</li> | <li>Select the '''Configuration Groups''' tab.</li> | ||
| − | <li>Select the | + | <li>Select the '''Configuration Groups''' icon.</li> |
</ol> | </ol> | ||
| Line 402: | Line 402: | ||
'''Figure 25: Parser Configuration Groups''' | '''Figure 25: Parser Configuration Groups''' | ||
| − | [[File:Parser Configuration Groups.png|900px | + | [[File:HTCC Parser Configuration Groups.png|900px]] |
| | ||
| Line 459: | Line 459: | ||
| | ||
| − | === <span class="mw-headline" id="Push_data_via_PWB"><span class="mw-headline" id="Push_data_via_PWB"><span class="mw-headline" id="Push_data_via_PWB"><span class="mw-headline" id="Push_data_via_PWB"><span class="mw-headline" id="Push_data_via_PWB"><span class="mw-headline" id="Push_data_via_PWB"><span class="mw-headline" id="Push_data_via_PWB"><span class="mw-headline" id="Push_data_via_PWB">Push data via PWB</span></span></span></span></span></span></span></span> === | + | === <span class="mw-headline" id="Push_data_via_PWB"><span class="mw-headline" id="Push_data_via_PWB"><span class="mw-headline" id="Push_data_via_PWB"><span class="mw-headline" id="Push_data_via_PWB"><span class="mw-headline" id="Push_data_via_PWB"><span class="mw-headline" id="Push_data_via_PWB"><span class="mw-headline" id="Push_data_via_PWB"><span class="mw-headline" id="Push_data_via_PWB"><span class="mw-headline" id="Push_data_via_PWB">Push data via PWB</span></span></span></span></span></span></span></span></span> === |
To push data via Production Workbench, please follow the step list below: | To push data via Production Workbench, please follow the step list below: | ||
Revision as of 17:58, 14 June 2023
Summary
This How-To Create CPK/PPK Charts document will teach users how to create a new monitor as well as set up a Data Strategy Collection, Standard Control Chart, Available Charts, and Actions, applied to the new monitor.
SPC (Statistical Process Control) is an industry-standard methodology for measuring and controlling quality during the manufacturing process.
The most notable advantages of using SPC are the following:
- Companies can dramatically reduce variability and scrap.
- Statistically improve productivity.
- Reduce costs.
- Uncover hidden process characteristics.
- Instantly react to process changes.
- Make real-time decisions on the shop floor.
How to create a new monitor with a CPK/PPK chart
SPC monitors should be created under an existing monitor group. To create a monitor, users must follow the following steps listed below:
- From the Monitor Group List page, select a group monitor, and then click the GO icon.
Figure 1: Monitor Group List Page
- From the Function List page, select Monitor Maintenance.
Figure 2: SPC Function List Page
- On the Monitor List page, select New.
Figure 3: SPC Monitor List Page
- Select Part or Family ID.
- Enter the Part Number or Family ID, and then use the arrow to add or delete the value.
- Select Location, Process, or Location Family.
- Enter the Location, Process, or Location Family, and then use the arrow to add or delete the value.
- Select Next to go to the next tab.
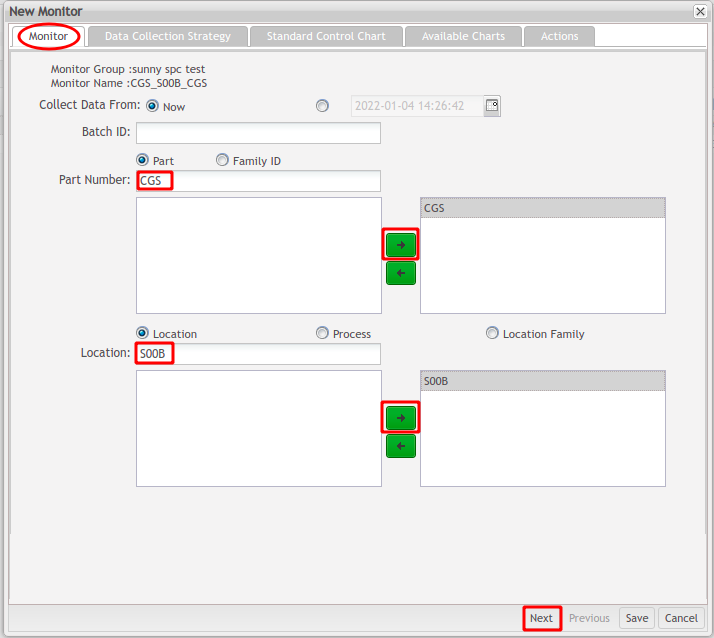
Figure 4: Monitor Tab
Collect Data From: Enable SPC to collect data from ‘Now’ or from a past date.
Part Number: The part number to be monitored by SPC.
Family ID: The Family ID is to be monitored by SPC.
Location: The location to be monitored by SPC.
Process: The process to be monitored by SPC.
Location Family: The location family is to be monitored by SPC.
Users can choose from three different options to collect data that will be used to generate a CPK/PPK chart: Auto Collection from Unit, Manual Collection via SPC UI, and Automatic Collection via SPC API.
- Auto Collection from Unit: This allows the SPC monitor to automatically collect data from the MDS service.
- Manual Collection via SPC UI: Use this option if the end-user needs to customize characteristics for their monitor.
- Automatic Collection via SPC API: Use this option if the end-user needs to customize characteristics for their monitor. The clients, such as PWB, IIOT can push the data to SPC via its monitor API as long as the characteristics in the parameters of the API endpoint exist and match this monitor, the continuous data control charts (such as X bar-R chart, I-MR chart, and CPK/PPK report) will plot.
How to generate a CPK/PPK chart using ‘Auto Collection from Unit’
To generate a CPK/PPK chart using the Auto Collection from Unit option, follow the below step list:
- Make sure the Location/Process with the part number users want to monitor has been associated with attributes in Shop Floor Configuration.
Figure 5: Attribute Define (Auto Collection from Unit)
- Create a new monitor and configure the Monitor Tab.
- Select the Characteristics to be monitored, and then use the arrow to add or delete the Characteristics.
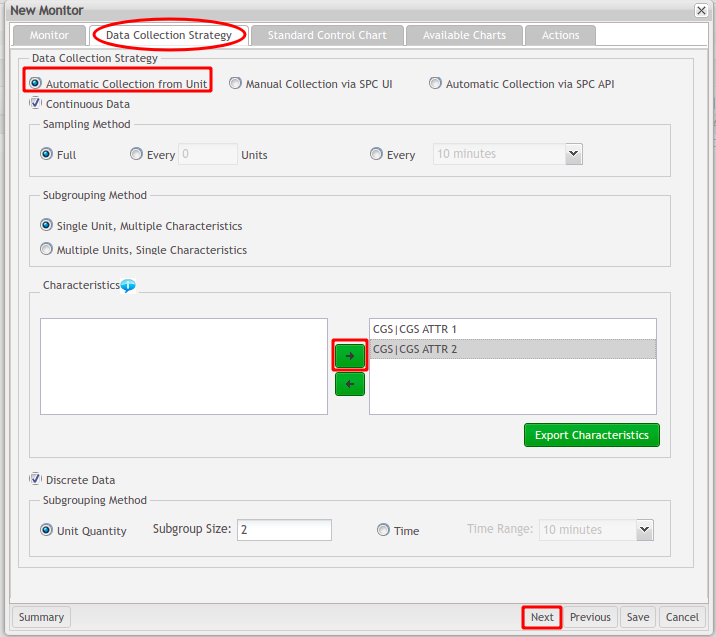
Figure 6: Data Collection Strategy Tab (Auto Collection from Unit)
Note: To access the Figure 6 page, a precondition must be met: Attributes need to be mapped to Location/Process in MES 101, then the end-users will be able to select attributes (Characteristics) in SPC.
Continuous Data: If users want to generate a CPK/PPK chart, this checkbox must be marked.
Single Unit, Multiple Characteristics: Supports the calculation of one unit, but for multiple characteristics.
Multiple Units, Single Characteristics: Supports the calculation of one characteristic, but for different serial numbers.
- Select Next to move to the next tab.
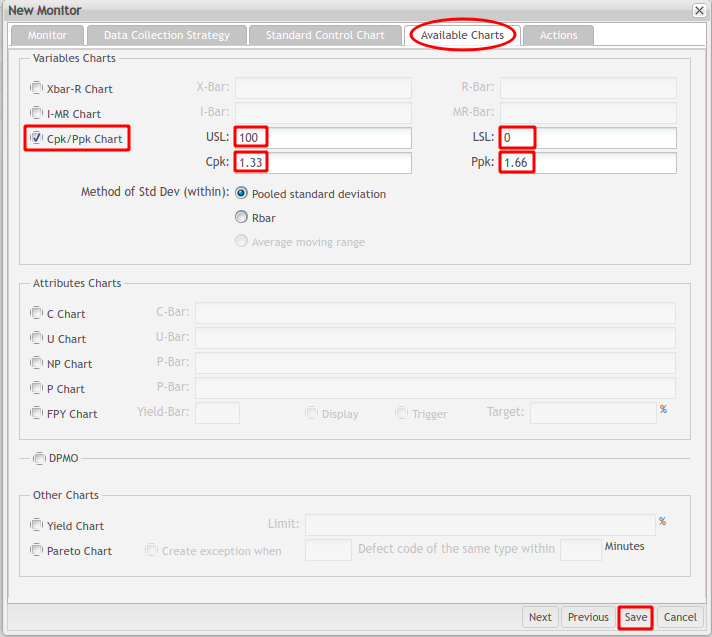
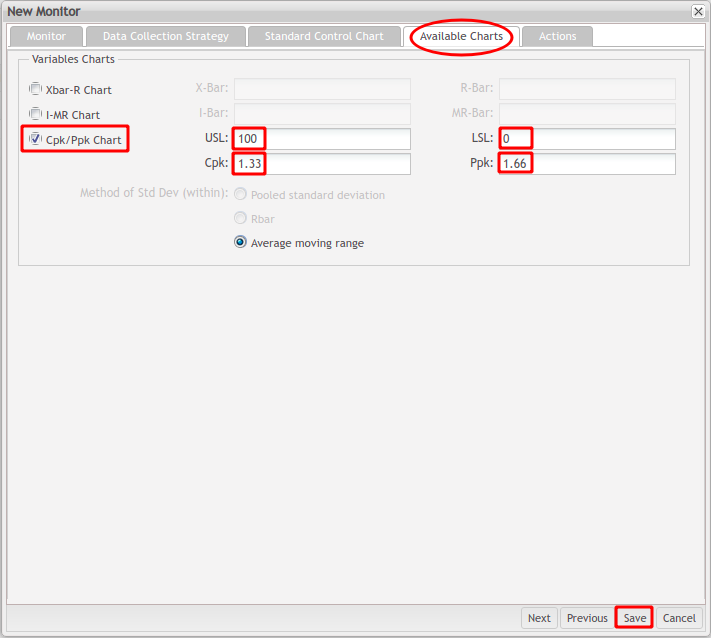
- Mark the Cpk/Ppk Chart checkbox.
- Enter the value for USL and LSL.
- Enter the value for Cpk and Ppk.
- Select the Method of Standard Deviation (within):
- Pooled standard deviation.
- Rbar (Average of subgroup ranges).
- Average moving range.
Note: When subgroup size > 1, SPC estimates σ within using one of the following methods: Pooled standard deviation or Rbar. SPC will choose the Pooled standard deviation by default as the Minitab.
When subgroup size = 1, Minitab estimates σ within using the "Average of moving range" method.
- Click Save to save all the New Monitor configurations.
Figure 7: Available Charts Tab (Auto Collection from Unit)
- Scan a serial number.
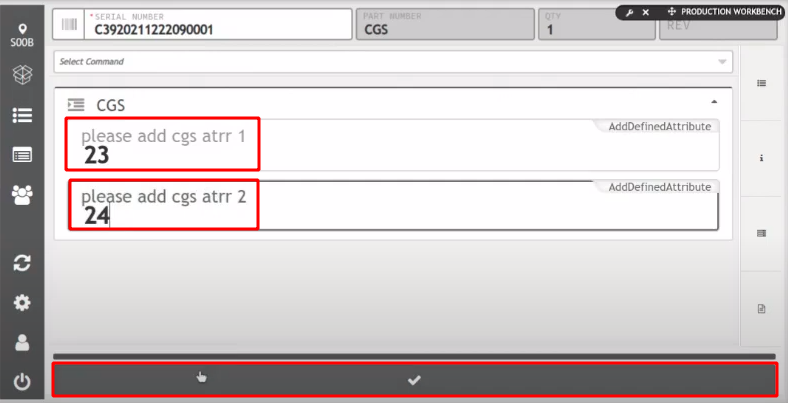
- Enter the attribute value in the Production Workbench portlet.
- To view the CPK/PPK chart, navigate to: Quality > SPC.
- Select the monitor, and then select the Chart button to view the chart.
Figure 9: CPK/PPK Chart Generated via PWB

How to generate a CPK/PPK chart using ‘Manual Collection via SPC UI’
This option enables users to push data to SPC using the SPC UI instead of using the Production Workbench Interface.
To generate a CPK/PPK chart using the Manual Collection via SPC UI option, follow the below step list:
- Create a New Monitor and configure the Monitor Tab.
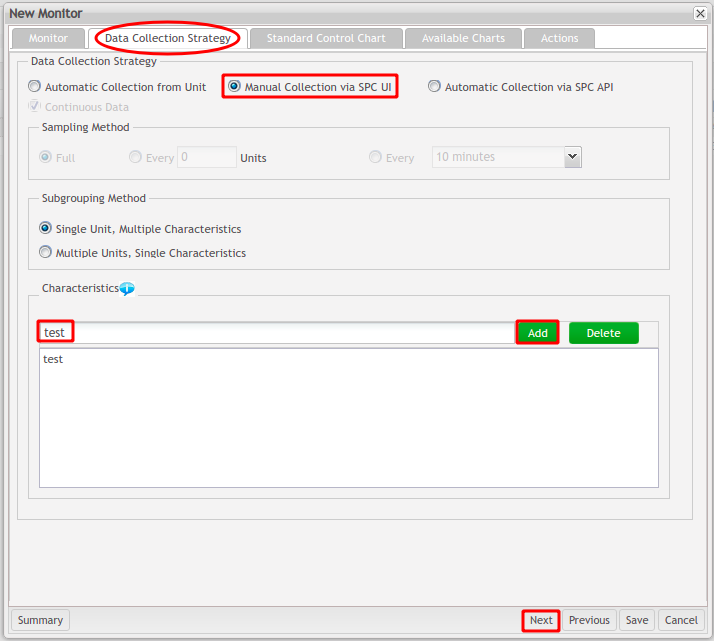
- Enter the Characteristic name manually, and then click Add.
- Select Next to move to the next tab.
- Single Unit, Multiple Characteristics: This is the default method.
- Multiple Units, Single Characteristics: This subgroup method is the enhancement from SPC V1.2.30. Multi-Units, a single characteristic that means Xbar-R Chart supports the calculation of one attribute, but for different serial numbers.
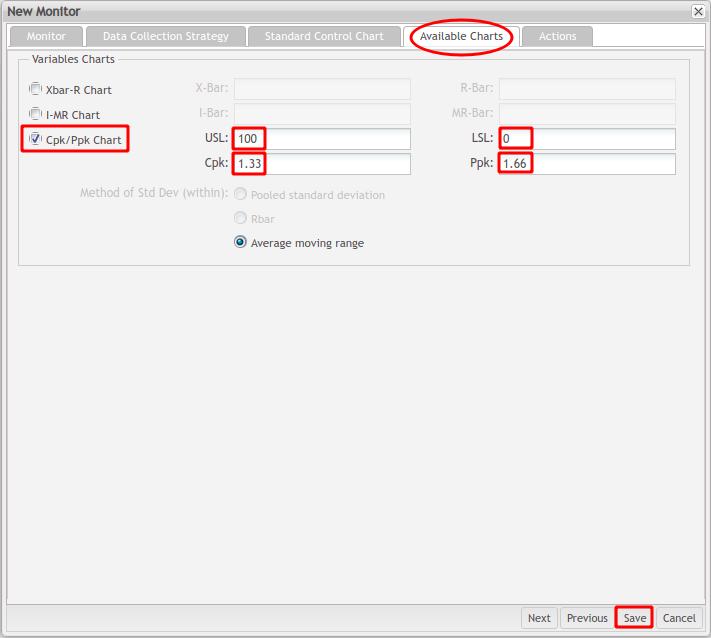
Figure 10: Data Collection Strategy Tab (Manual Collection via SPC UI)
- Mark the Cpk/Ppk Cart checkbox.
- Enter the value for USL and LSL.
- Enter the value for Cpk and Ppk.
- Select the Method of Standard Deviation (within):
- Pooled standard deviation.
- Rbar (Average of subgroup ranges).
- Average moving range.
Note: When subgroup size > 1, SPC estimates σ within using one of the following methods: Pooled standard deviation or Rbar. SPC will choose the Pooled standard deviation by default as the Minitab.
When subgroup size = 1, Minitab estimates σ within using the "Average of moving range" method.
- Click Save to save all the New Monitor configurations.
Figure 11: Available Charts Tab (Manual Collection via SPC UI)
- Select the Input button.
Figure 12: Input Data via SPC UI
- Enter the value for the test field.
- Enter the value for the Collected By field.
- Select the Save button.
Figure 13: Collect New Data Line Form

- Select Yes to save the entered data and generate the CPK/PPK chart.
Figure 14: Confirmation Message
- Select the Retrieve button to view the CPK/PPK chart.
Figure 15: CPK/PPK Chart Generated via SPC UI
How to generate a CPK/PPK chart using ‘Automatic Collection via SPC API’
In this option, users can input the data using two different applications: IIoT and PWB.
To generate a CPK/PPK chart using the Automatic Collection via SPC API option, follow the below step list:
- Create a New Monitor and configure the Monitor Tab.
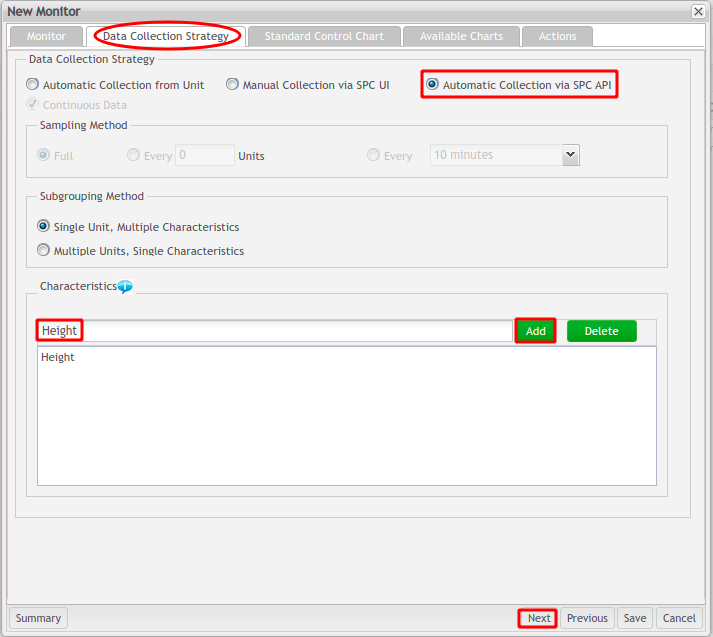
- Enter the Characteristic name manually, and then click Add.
- Select Next to move to the next tab.
Single Unit, Multiple Characteristics: This is the default method.
Multiple Units, Single Characteristics: This subgroup method is the enhancement from SPC V1.2.30. Multi-Units, a single characteristic that means Xbar-R Chart supports the calculation of one attribute but for different SNs.
Summary: After all settings are defined, users can select Summary to view the data collection strategy summary.
Figure 16: Data Collection Strategy Tab (Automatic Collection via SPC API)
- Mark the Cpk/Ppk Cart checkbox.
- Enter the value for USL and LSL.
- Enter the value for Cpk and Ppk.
- Select the Method of Standard Deviation (within):
- Pooled standard deviation.
- Rbar (Average of subgroup ranges).
- Average moving range.
Note: When subgroup size > 1, SPC estimates σ within using one of the following methods: Pooled standard deviation or Rbar. SPC will choose the Pooled standard deviation by default as the Minitab.
When subgroup size = 1, Minitab estimates σ within using the "Average of moving range" method.
- Click Save to save all the New Monitor configurations.
Figure 17: Available Charts Tab (Automatic Collection via SPC API)
Push data via IIOT
To push data via IIOT, users must do the Measurement Configuration, to do so, follow the step list below:
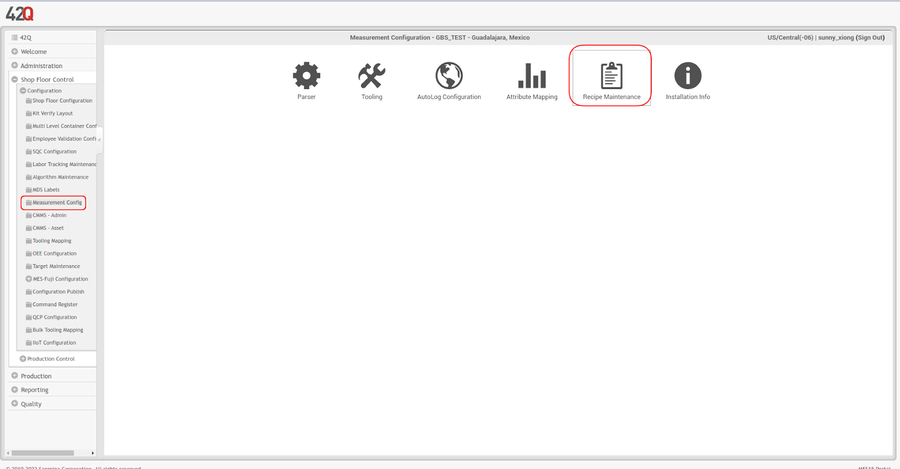
- Navigate to: Shop Floor Control > Configuration > Measurement Config and select the Recipe Maintenance icon.
Figure 18: Recipe Maintenance
- Click the New + icon to create a recipe for the process and part number.
Figure 19: Create a New Recipe
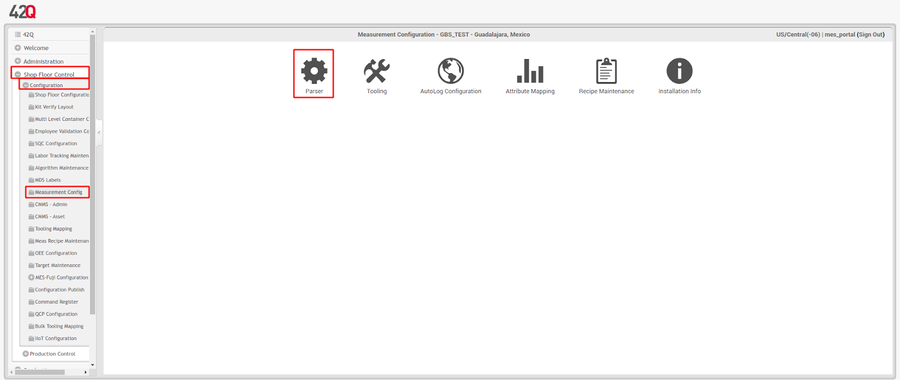
- Return to the Measurement Config menu, and then select the Parser icon.
Figure 20: Measurement Config Menu
- Choose a Parser, and then select the + icon.
- Select the Stations tab.
- Choose a Station Group, and then select the + icon.
- Select the New + icon to create a new station for the process that the user has previously chosen in the SPC monitor.
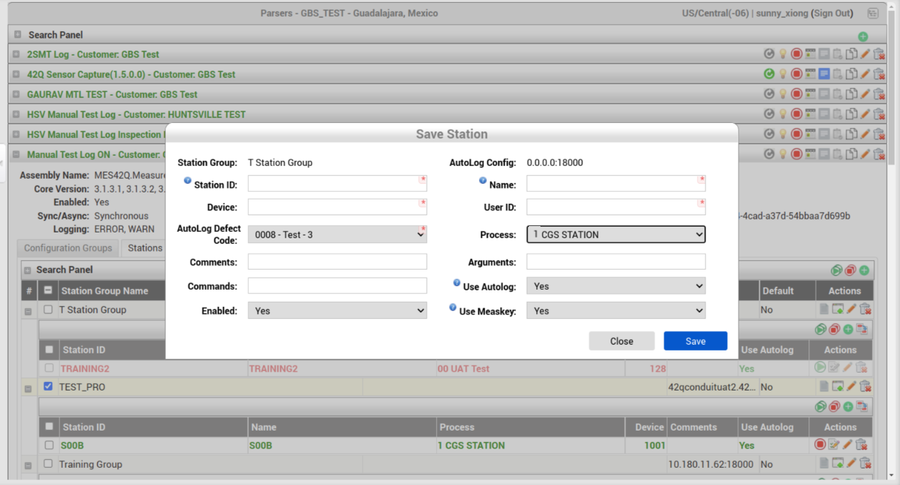
- Input the Station ID, Name, Device, User ID, and then choose the Process from the drop-down list.
- Select Save to save the station.
Figure 21: Save Station Form
Figure 22: Link the Process to a Location
- Select the Show Mappings icon.
Figure 23: Show Mappings Icon
- Click on the SPC Mapping tab.
- Select the Part Number, Process and Monitor Name.
- Select Save Mappings to save changes.
Figure 24: SPC Mapping Configuration
- Select the Configuration Groups tab.
- Select the Configuration Groups icon.
Figure 25: Parser Configuration Groups
- Create a group for SPC Integration.
- Add dynamic configuration for the group to communicate with SPC API.
Figure 26: SPC Integration Items
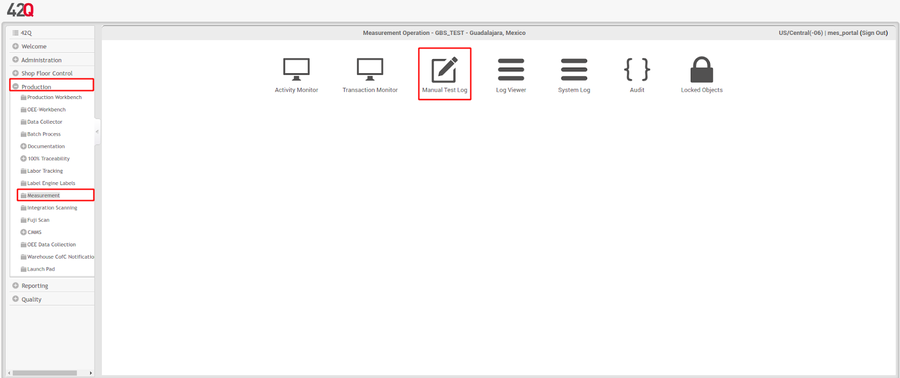
- Navigate to: Production > Measurement.
- Select Manual Test Log.
Figure 27: Measurement Menu
- Select the corresponding station.
Figure 28: Measurement Stations
- Enter several Serial Numbers and Values into this station.
- Click Submit.
Figure 29: Manual Test Log Serial Number Activities
- Navigate to: Quality > SPC.
- Select the monitor, and then select the Chart button to view the chart.
Push data via PWB
To push data via Production Workbench, please follow the step list below:
- Scan the serial number in the Production Workbench portlet.
- Select the command ‘Record Monitored Measurement’ to indicate the recording of multiple measurement data to SPC from Production Workbench. After this selection, some fields will be automatically populated, except for the Attribute Value that must be entered by the operator:
- SPC Monitor Name?.
- Attribute Name?.
- Attribute Value?: Enter the attribute value (this will be transmitted to SPC even if users do not input the end command).
Figure 30: Input Data via SPC API
Figure 31: CPK/PPK Chart Generated In via SPC API


