Difference between revisions of "SOP-42Q-MES0069 Statistical Process Control"
| Line 1,312: | Line 1,312: | ||
| | ||
| − | === <span class="mw-headline" id="Input_Data_for_Multiple_Monitors_At_Once"><span class="mw-headline" id="Input_Data_for_Multiple_Monitors_At_Once"> | + | |
| + | === <span class="mw-headline" id="Input_Data_for_Multiple_Monitors_At_Once"><span class="mw-headline" id="Input_Data_for_Multiple_Monitors_At_Once"><span class="mw-headline" id="Input_Data_for_Multiple_Monitors_At_Once"><span class="mw-headline" id="Input_Data_for_Multiple_Monitors_At_Once">Input Data for Multiple Monitors At Once</span></span></span></span> === | ||
Users can select and input data to multiple monitors at once, as long as all of the selected monitors' Collection Type is Manual. | Users can select and input data to multiple monitors at once, as long as all of the selected monitors' Collection Type is Manual. | ||
| Line 1,332: | Line 1,333: | ||
| | ||
| − | ==== <span class="mw-headline" id="Input_Attributes_for_The_Current_Monitor"><span class="mw-headline" id="Input_Attributes_for_The_Current_Monitor">'''<span class="mw-headline" id="Input_Attributes_for_The_Current_Monitor">Input Attributes for The Current Monitor</span>'''</span></span> ==== | + | ==== <span class="mw-headline" id="Input_Attributes_for_The_Current_Monitor"><span class="mw-headline" id="Input_Attributes_for_The_Current_Monitor"><span class="mw-headline" id="Input_Attributes_for_The_Current_Monitor">'''<span class="mw-headline" id="Input_Attributes_for_The_Current_Monitor">Input Attributes for The Current Monitor</span>'''</span></span></span> ==== |
On the Collect New Data page, users can enter attributes for multiple monitors at once. The Monitor drop-down list displays the currently selected monitor to be input data. Users can view Line, Monitor name, and Location of the current monitor on the top left the corner. Note that the allowed input of attributes is number only. | On the Collect New Data page, users can enter attributes for multiple monitors at once. The Monitor drop-down list displays the currently selected monitor to be input data. Users can view Line, Monitor name, and Location of the current monitor on the top left the corner. Note that the allowed input of attributes is number only. | ||
| Line 1,338: | Line 1,339: | ||
| | ||
| − | + | '''Note''': If a user has input values in at least one of the fields and selects Reset, an alert window displays with the warning message, 'You are about to reset all values. This action will delete all values of the current monitor. Are you sure you want to proceed?' Selecting Yes resets all entries for the current monitor to the default value. | |
| | ||
| Line 1,364: | Line 1,365: | ||
| | ||
| − | ==== <span class="mw-headline" id="Save_current_monitor.27s_attributes_data"><span class="mw-headline" id="Save_current_monitor.27s_attributes_data">'''<span class="mw-headline" id="Save_current_monitor.27s_attributes_data">Save current monitor's attributes data</span>'''</span></span> ==== | + | ==== <span class="mw-headline" id="Save_current_monitor.27s_attributes_data"><span class="mw-headline" id="Save_current_monitor.27s_attributes_data"><span class="mw-headline" id="Save_current_monitor.27s_attributes_data">'''<span class="mw-headline" id="Save_current_monitor.27s_attributes_data">Save current monitor's attributes data</span>'''</span></span></span> ==== |
On the '''Collect New Data''' page, if a user has finished inputting data to the current monitor, and selects Save, all the current monitor fields turn grey except the Monitor drop-down list and the user cannot edit any data. The current monitor name in the Monitor drop-down box changes to 'monitor_name (Saved)' where monitor_name is the name of the current monitor. Now the user can switch to another monitor to input attributes data to that monitor. | On the '''Collect New Data''' page, if a user has finished inputting data to the current monitor, and selects Save, all the current monitor fields turn grey except the Monitor drop-down list and the user cannot edit any data. The current monitor name in the Monitor drop-down box changes to 'monitor_name (Saved)' where monitor_name is the name of the current monitor. Now the user can switch to another monitor to input attributes data to that monitor. | ||
| Line 1,376: | Line 1,377: | ||
| | ||
| − | ==== <span class="mw-headline" id="Switch_to_Another_Monitor"><span class="mw-headline" id="Switch_to_Another_Monitor">'''<span class="mw-headline" id="Switch_to_Another_Monitor">Switch to Another Monitor</span>'''</span></span> ==== | + | ==== <span class="mw-headline" id="Switch_to_Another_Monitor"><span class="mw-headline" id="Switch_to_Another_Monitor"><span class="mw-headline" id="Switch_to_Another_Monitor">'''<span class="mw-headline" id="Switch_to_Another_Monitor">Switch to Another Monitor</span>'''</span></span></span> ==== |
To switch to another monitor to input attributes, click the Monitor drop-down box and select another monitor from the list | To switch to another monitor to input attributes, click the Monitor drop-down box and select another monitor from the list | ||
| Line 1,390: | Line 1,391: | ||
| | ||
| − | ==== <span class="mw-headline" id="Back_to_the_.27Monitor_List.27_page"><span class="mw-headline" id="Back_to_the_.27Monitor_List.27_page"><span class="mw-headline" id="Back_to_.27Monitor_List.27_page">Back to the 'Monitor List' page</span></span></span> ==== | + | ==== <span class="mw-headline" id="Back_to_the_.27Monitor_List.27_page"><span class="mw-headline" id="Back_to_the_.27Monitor_List.27_page"><span class="mw-headline" id="Back_to_the_.27Monitor_List.27_page"><span class="mw-headline" id="Back_to_.27Monitor_List.27_page">Back to the 'Monitor List' page</span></span></span></span> ==== |
To go back to the Monitor List page, select the [[File:New record button.png|new record button]] button. | To go back to the Monitor List page, select the [[File:New record button.png|new record button]] button. | ||
Revision as of 15:53, 5 November 2020
42Q Home > Quality > Statistical Process Control
This edition applies to MES15 Portal 1.0 and all subsequent releases and modifications until otherwise indicated in new revisions.
Contents
- 1 Notification
- 2 Introduction
- 3 Server Information Configuration
- 4 Monitor Group Maintenance
- 5 Monitor Maintenance
- 5.1 Brief Introduction and Preparation Work
- 5.2 Create a New Monitor
- 5.3 Search Monitor
- 5.4 Hide Inactive Monitors
- 5.5 Edit Monitor (Edit Monitor in Batch)
- 5.6 Edit Monitor in Batch
- 5.7 Manually Input Data to Monitor
- 5.8 Start, Stop, Disable, Enable, Delete Monitor
- 5.9 View Control Chart, Data & Write OCAP
- 5.10 View and Edit Data
- 5.11 Maintain Lock
- 5.12 View Monitor Details
- 5.13 View Monitor History
- 6 Email Maintenance
- 7 Location Family Maintenance
- 8 System Log Maintenance
- 9 SPC System Parameter Maintenance
- 10 Lock Maintenance
- 11 SPC TV Portlet
- 12 Roles & Permissions
- 13 Glossary
- 14 Document Revision History
Notification
CDC SPC team is dedicated to the development of new functions and bug fixes to provide our users with a more perfect SPC system. New versions will be periodically released.
This user manual is based on MES 15 Quality SPC 1.2.28 This manual does not apply to older or newer versions of SPC.
Introduction
SPC is an industry-standard methodology for measuring and controlling quality during the manufacturing process. It is a method for monitoring, controlling, and, ideally, improving a process through statistical analysis.
Based on statistical theories, SPC (Statistical Process Control) is applied to Sanmina’s manufacturing and production line for the purpose of quality control. SPC enables users to continuously monitor, analyze, and control the production process in real-time to reduce possible waste and improve process capability. Key tools used in SPC include control charts, monitor maintenance, email notifications, system configuration, line stoppage, etc. On the client-side, the SPC system includes two components: SPC portlet and SPC TV portlet.
Using the SPC, the Company can Dramatically reduce variability and scrap, statistically improve productivity, reduce costs, uncover hidden process characteristics, instantly react to process changes, and make real-time decisions on the shop floor.
See below the main features for SPC:
- Monitors can be easily “Stopped” & “Started”;
- Support BATCH units calculation for Yield and Pareto charts;
- Display Affected Serials for all charts displayed;
- Change chart background color for Out-of-Control condition;
- E-mail Notification send to specified recipients for Out-of-Control condition;
- Ability to export DPMO report;
- Control on production process route (MFG hold) base on Pareto chart;
- SPC Dashboard displays multiple monitors on TV in real-time;
SPC also provides some charts that help to see graphically some statistics:
- Attribute Control Charts – Process CONTROL (defects and defective units)
- Monitors Grouping data by Piece: P and NP charts
- Monitors Grouping data by Defect Points: C and U charts
- Monitors by BATCH: Yield (pie) and Pareto charts
- Others: FPY and DPMO (DPMO, DPMO-P, DPMO-A, DPMO-T, DPMO-C) charts
- Variables Control Charts – Process CAPABILITY control (SFDC attribute values)
If the combination of Monitor setup (Part Number + Process/Workstation) has attribute setup on SFDC (Attribute Maintenance) the attribute charts will be displayed on Monitor Maintenance screen with: X-Bar/R chart; I/MR chart; Cpk/Ppk
To get more information, see the next topics of this document.
Server Information Configuration
After SPC deployed to your web server, you need to set up a server and configure the server information from the Server Information page.
To access the Server Information page in the MES Portal, navigate to Administration > Server Information.
Figure 1: Server Information Page
Create SPC Server
To create an SPC server
- Select Add from the Server Information page.
Figure 2: Add SPC Server
- In the Add Server Information page, select SPC from the Program drop-down box.
- Complete all the fields and select Add to save the configuration to the database.
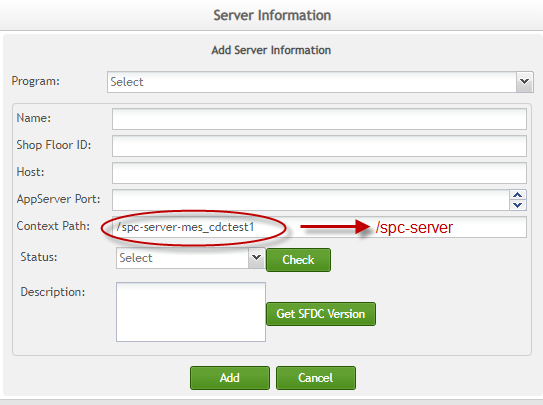
Figure 3:Add Server Information
Fields as seen in the above screenshot are explained in the following:
Name: The name of the SPC server
IP: The SPC server IP address
AppServer Port: The port that SPC server deploys on Tomcat server
Context Path: The patch that SPC server deployed on Tomcat server. After the system is refactored, the system should have only one program that supports all sites/plants, so the Context path of server information for each site/plant should be /spc-server.
Status: After you have completed all the field above, select a status from this drop-down box, and click the Check button to verify that the SPC server connection is working.
Edit SPC Server
To edit an existing server
- From the Server Information page, check the box of a server and click Edit.
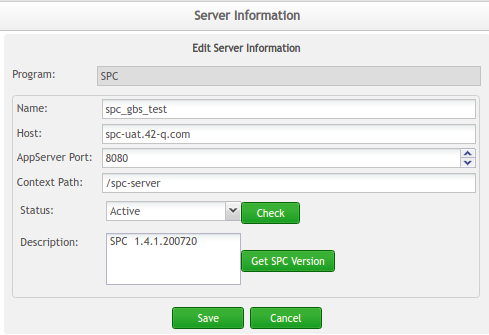
Figure 4: Edit Server Information
- In the Edit Server Information page, update the values of any field as needed.
- Select Save to save the updates to the database; otherwise, click the Cancel button if you want to quit the action without saving changes to the server.
Figure 5: Edit Server Information Fields
Delete SPC Server
To delete an existing server
- Select the server and click Delete in the toolbar.
Figure 6: Delete Server
View Existing SPC Server
On SPC portlet Server List page, you can view all existing SPC servers created in MES Portal Server Information portlet. In addition, users can choose a server and click Go to enter the server for further manipulation.
Figure 7: Existing Server List
Monitor Group Maintenance
MES 15 Quality SPC 1.2.28 uses the Monitor Group to maintain SPC monitors that collect data from different sources, such as DotLine Source, SFDC Archive (MDS), and SPI. However, MES 15 Quality SPC does not actually collect data from SPI, it collects data from the SFDC archive as an associated database schema and support is not fully ready yet. The Dot Line Source was added in Monitor Group Maintenance to support the Dot Line chart and the difference between the Dot Line chart and other charts is that the user transmits the data to the SPC through an API and this data has been calculated, and the SPC directly uses the data for display.
View Monitor Group
To view existing monitor groups
- In the MES portal, navigate to Quality > SPC. The SPC Welcome page is displayed. Select Enter.
Figure 8: SPC Welcome Page
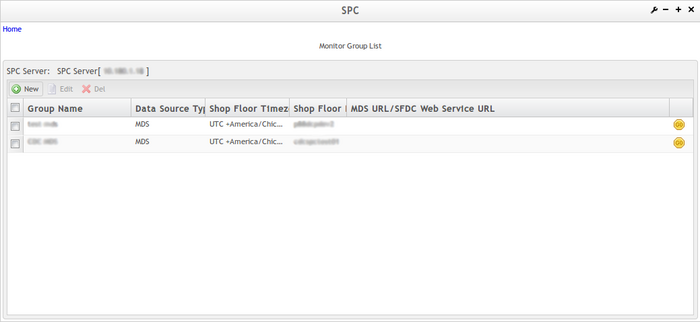
- In the Monitor Group List page, select an SPC engine from the drop-down box. By default, the first SPC engine will be selected.
- Once an SPC engine has been selected, the existing monitor groups that were created under the selected SPC engine will be displayed on the Monitor Group List page.
Figure 9: Monitor Group List
Create Monitor Group
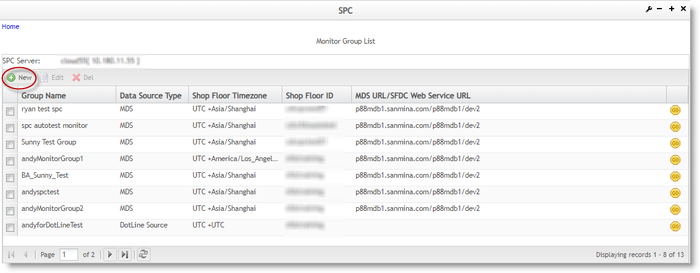
In MES 15 Quality SPC 1.2.28, every monitor is created under a monitor group. So before creating a monitor, a monitor group must be created first.To create a monitor group:
Figure 10: Creating a New Monitor Group
SPC opens the Add Monitor Group page.
- Enter the monitor group name in the Name field
Figure 11: Add Monitor Group
- Select MDS, SPI or DotLine Source from the Data Source Type drop-down box;
- Enter a Shop Floor ID, Shop Floor Time Zone, and IP (MDS).
Figure 12: Selecting Data Source Type
Figure 13: New Monitor Group Page - MDS
- If you need to send MFG Hold to stop the production line, you can enable the Send MFG Hold request to the checkbox.
Some of the fields in the above figures are explained as follows:
Shop Floor ID: Defines which SFDC that SPC should collect data from.
Shop Floor Time Zone: The time zone of the selected SFDC PC.
IP: Text field for the user to input the SFDC IP address to which MFG hold sends.
Note: Beginning with version 1.2.25, SPC program is deployed on the Amazon cloud server (in the USA). Users scan SNs on their local SFDC PC. So there will be a time zone difference between the SPC server and SFDC if they are not in the same time zone. SPC uses the value of this field to calculate the timezone of local SFDC, compares it with the Amazon cloud server time zone, calculates the time offset, and determines the right time for SPC monitor to retrieve data (create time + time offset) so that the scanned SNs data can display on monitor charts.
Send MFG Hold request to: This checkbox is not selected by default. It is optional. Users wanting SPC to send MFG Hold to stop the manufacturing line must check the Send MFG Hold to request to box and select one of the two radio buttons: MDS, SFDC. If MDS is selected, the MFG hold will be sent to MDS and then MDS sends MFG hold to local SFDCs.
Next, users will need to input the MDS URL which enables SPC to send the MFG hold to the right MDS service. Click the ![]() to test the web service connection.
to test the web service connection.
Figure 14: MDS URL Input
If MDS is selected, the SPC will directly send MFG hold to MDS. Also, users must enter the MDS web service URL in the text field.
Figure 15: SFDC Web Service Input
Figure 16: New Monitor Group Page - SPI
Figure 17: New Monitor Group Page - DotLine Source
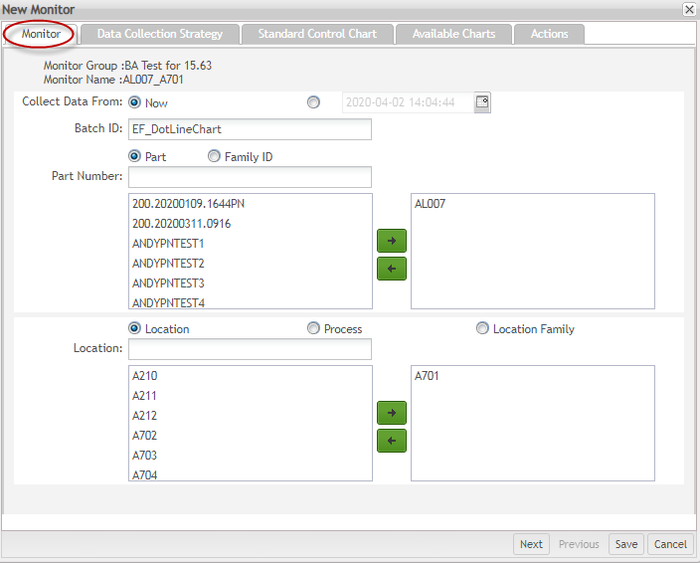
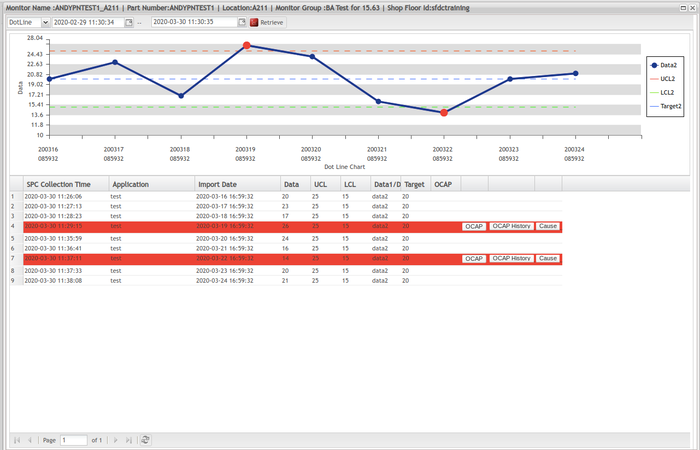
Note: Since some data are manually collected by users and these kinds of data could not be extracted from 42Q, these data have been calculated and an API was provided to collect the data and present it to users in the Dot Line Chart. Below see a sample Dot line chart. See below some rules to get the DotLine Chart:
- First users need to create a new monitor with the below info specified:
Specify which process, parts... will be used for this monitor to collect data.
Select Chart Type: Dot Line.
When Dot Line Chart is selected, Application & Data Column is enabled to let
users select which Application & Data Column will be used to display this chart.
- Group By: Disabled.
- Interval: Disabled.
- Rules & Actions: Enable.
- External Program will periodically pick data from Source Record by certain frequency and put into SPC by published;
API interface.
- SPC TV will select Monitor will display.
- Draw Chart: just like u/p chart current done in SPC.
X axis: time collected(Import Datetime), Format: MMDDmm
Y axis: Data, UCL (Upper Control Limit), LCL Lower Control Limit(), Target.
See the sequence below:
Figure 18: New Monitor DotLine Chart Monitor Tab
Figure 19: Data Collection Strategy Tab
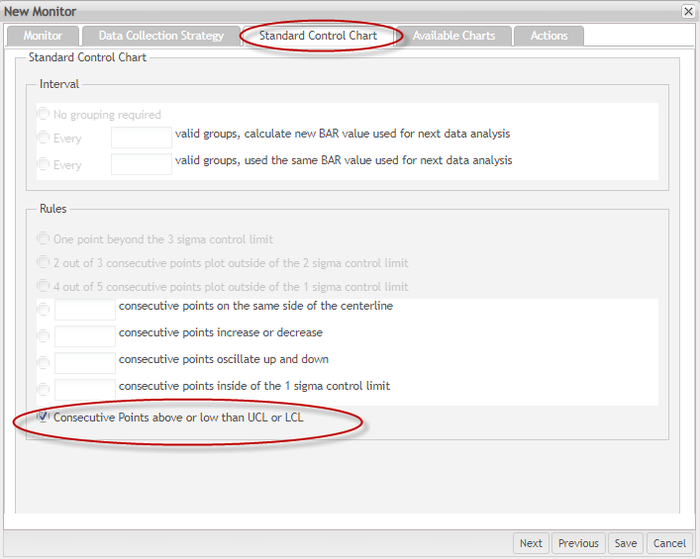
It is not allowed to update the Data Collection Strategy if the DotLine source type is selected because the Dot Line chart is not a control chart, so these rules cannot be applied to the Dot line chart. In order to achieve the feature of sending an alert e-mail or change the background color to red, a rule must be set.
A new rule according to the characteristics of the Dot line chart was added: Consecutive points above or lower than UCL or LCL.
Figure 20: New Monitor DotLine Chart Standard Control Chart Tab
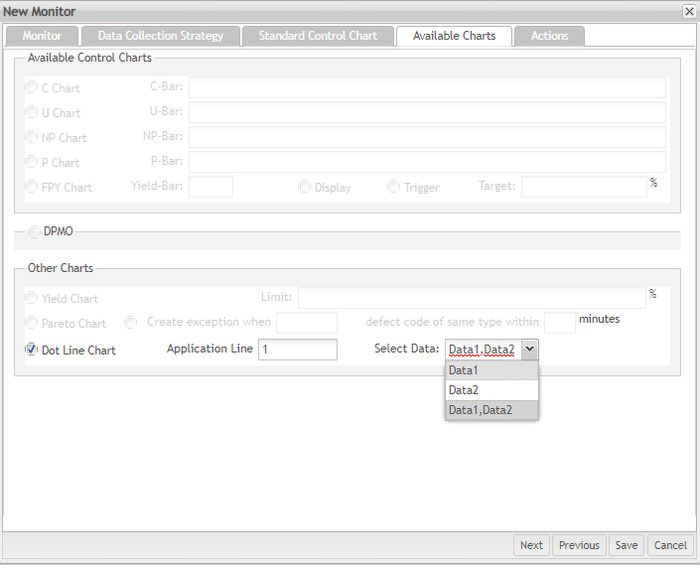
Figure 21: New Monitor DotLine Chart Available Charts Tab
Select Data in the Drop Down List low users to select bot data1 and data2 at the same time.
Data1 or Data2 can be understood as a group of data. Users can choose to display the two groups of data together in the dot line chart, or just display one group of data.
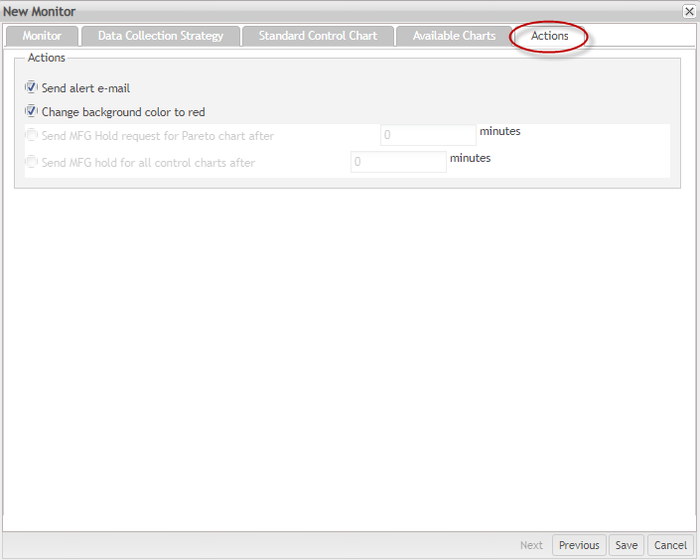
Figure 22: New Monitor DotLine Chart Actions Tab
And finally, users can select the following actions:
Send an alert email: This action sends an alert email to a specified person. Users can specify who would receive these alert emails in the Email Maintenance module.
Change the background color to red: If the exception was triggered, the background of an associated data record in this monitor will turn red.
See below a sample of DotLine Chart generated:
Figure 23: New Monitor Group Page - Sample of Dot Line Chart
Edit Monitor Group
To edit a monitor group
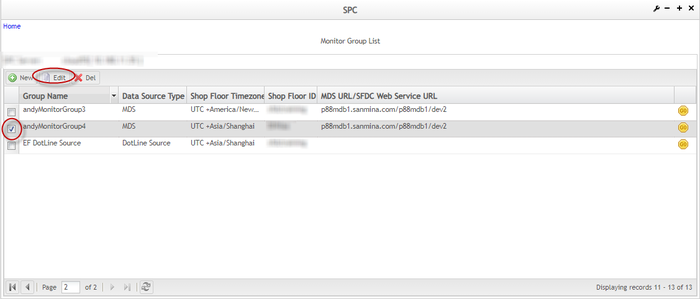
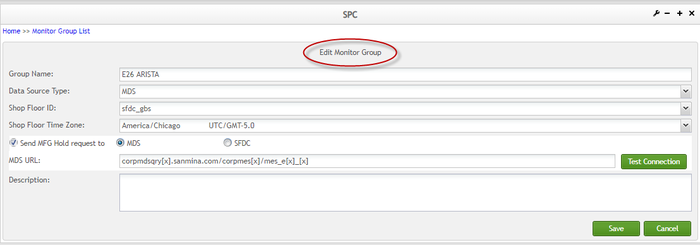
- From the Monitor Group List page, check the box of a monitor group that you need to edit and select Edit. The Edit Monitor Group page is displayed.
- Edit any field as needed, and select Save to save the change, or Cancel to abort.
Figure 24: Edit Monitor Group
Figure 25: Edit Monitor Group Fields
Delete Monitor Group
To delete a monitor group,
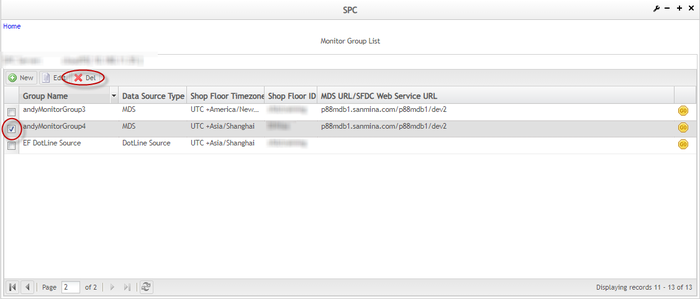
- From the Monitor Group List page, check the box of the monitor group to be deleted and click Delete.
Figure 26: Delete Monitor Group
Note: It is not allowed to delete the monitor group which contains one or more SPC Monitor.
Monitor Maintenance
Brief Introduction and Preparation Work
Brief Introduction
SPC portlet provides users plenty of parameters to maintain SPC monitors. An SPC monitor is a platform for the setup of such processes as object monitoring, data collection strategy, rules, control charts, and actions. With monitor maintenance function, you can create a new monitor, edit the existing monitor, disable or enable monitor, show monitor data or control charts, lock monitor, and so on. So monitor maintenance is a key function to SPC.
Preparation Work: Associate Part Number With a Route
MES 15 SPC 1.2.25 retrieves data from MDS via database view rather than Archive SFDC. To make the part number data that configured in MDS to be displayed in SPC monitor creation page, part number must be manually assigned to a route. To do so, you can follow the steps below. Users may skip instructions 1 and 2 below if a part number has already been created and the part number has been assigned to a route.
Create Part Number
To create a part number,
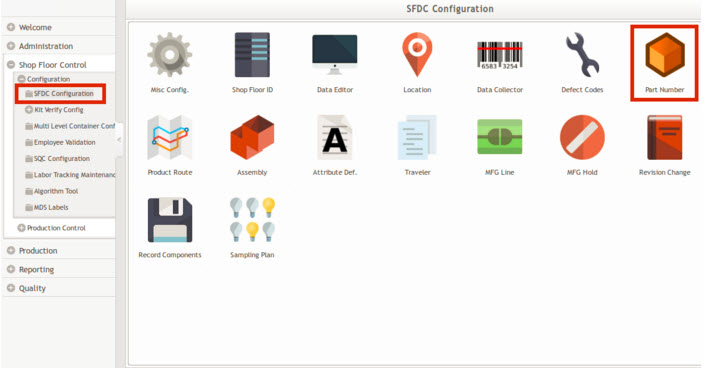
- 1 Navigate to Shop Floor Control > SFDC Configuration, and select the Part Number module.
Figure 27: SFDC Configuration Part Number Module
- From the Part Number List page, select Add Part Number to proceed.
Figure 28: Part Number Main Page
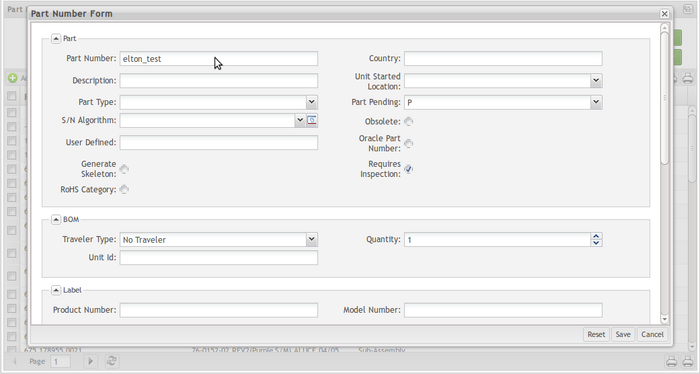
- In Part Number Form float window, input some parameters to create the part number, and click the Save button.
Figure 29: Part Number Form
- 3 Associate part number with a route
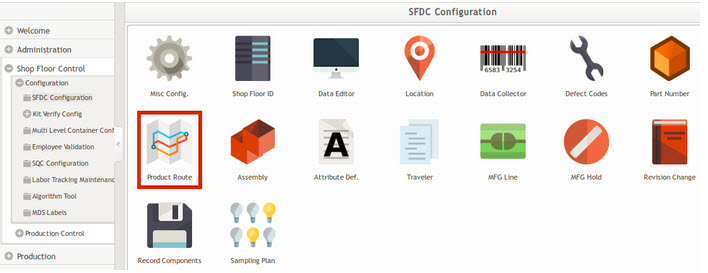
- From the SFDC Configuration portlet, select Product Route to proceed.
Figure 30: SFDC Configuration Product Route Module
Figure 31: Product Route Main Page with Icon Highlighted
- In the Part x Route Assignment List undefined window, select Add.
Figure 32: Product x Route Assignment List
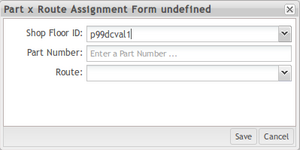
- In the Part x Route Assignment Form undefined float window, select a shop floor ID, input the part number, and select a route.
Figure 33: Part x Route Assignment Form
Create a New Monitor
In MES 15 Quality SPC 1.2.25, SPC monitors should be created under an existing monitor group.
Users are able to set up monitors one by one part number for different production lines for one
location/process, so there are too many monitors to be maintained, causing workload for them to maintain
these monitors in 42Q SPC. From E85 plant estimated, there are about 30,000 monitors to be created to support
42Q SPC’s rolling out to the whole plant.
To solve this workload, users are able to do the following operations:
- Create Monitors in Batch
- Support creates multi-part numbers/Family id with one location/process/location family or multi-location/process/location family with one part numbers/Family id ;
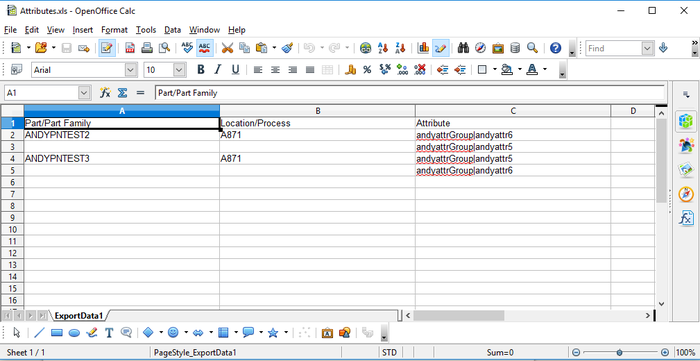
- Allow users to export all the related attributes when creating a monitor;
- If selected part numbers that have attributes, the attribute selection box in the new monitor>Data Collection Strategy page only allows the common attributes.
- To create monitors in batch, users should fill a batch id. This batch id will help users to do the operation of search or edit monitors.
- Edit Monitors in Batch
- Delete Monitors in Batch
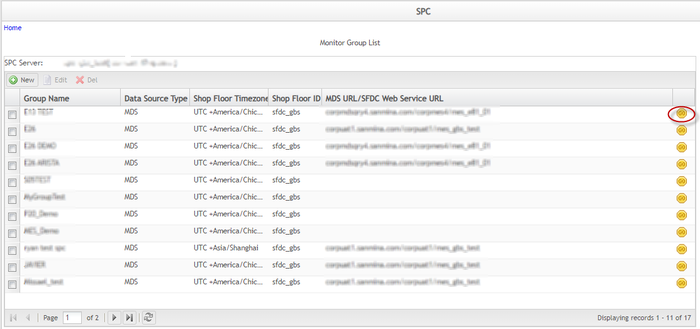
Figure 34: Monitor Group List Page with Go Icon Highlighted
The Functional List page is displayed:
Figure 35: SPC Function List Page
Figure 36: SPC Monitor List Page
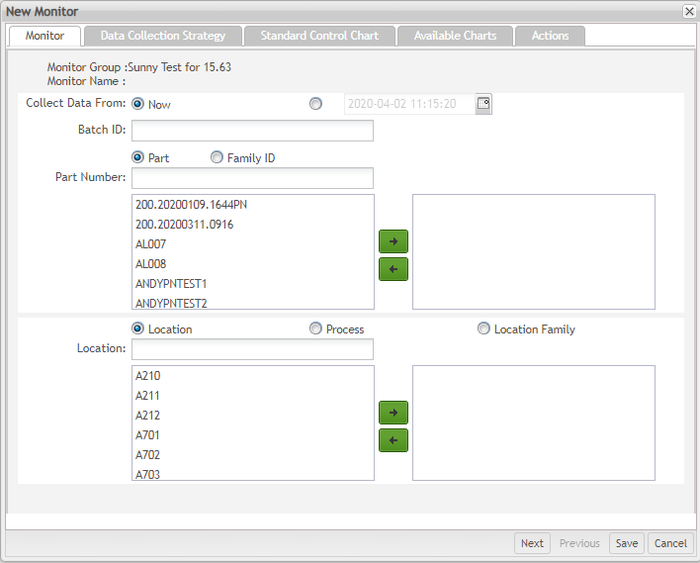
Figure 37: New Monitor Form
The user now enters the New Monitor page. This page provides all parameters for you to set up a customized monitor in SPC. These parameters are divided into multiple sections. These sections are clarified below:
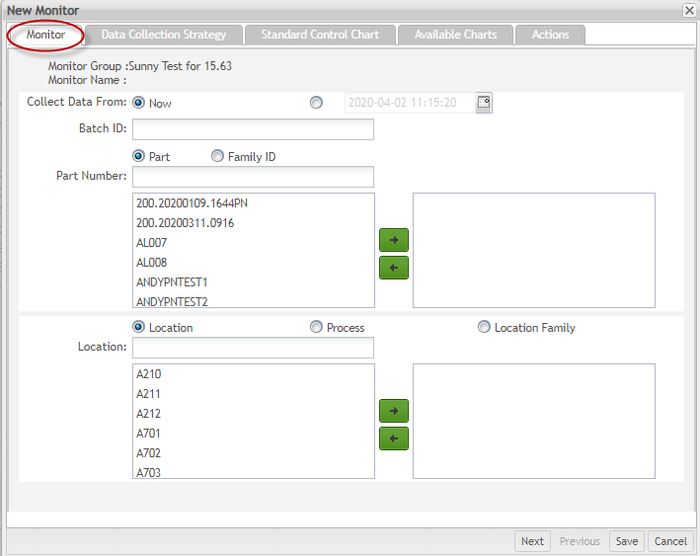
Monitor
The first section is the Monitor.
Figure 38: Monitor Section
Batch ID: The name of the monitor or batch of monitors. This field cannot be edited as it is automatically set after the Part Number, Family ID, and Location, Process, and Location Family. If monitor data is automatically collected from SFDC, the monitor name consists of two parts separated by a hyphen: The first part is Part Number / Family ID, the second part is Location / Process / Location Family. If monitor data is collected manually via SPC UI, the monitor name will also contain the third part: the attribute name.
Collect Data From: Enable SPC to collect data from Now or from a past date.
Note: Historical data that contains exceptions could stop the present production line. If a previous date is selected here and the option Send MFG Hold request to was checked when creating the server, then a user attempting to save the monitor at this point will be prompted by a warning that asks the user to confirm the decision to save.
Part Number: The part number to be monitored by SPC. The part number is created and configured in MDS before being created in the SPC monitor. The Part Number option is selected by default. Users must enter a specific part number or select one from the associated drop-down box.
TIP: When users enter four characters into the field, the portlet will automatically begin searching and listing any part numbers that match the input. To date, the Part Number, Family ID, Location, Process, and Location Family fields support this search-as-you-type feature.
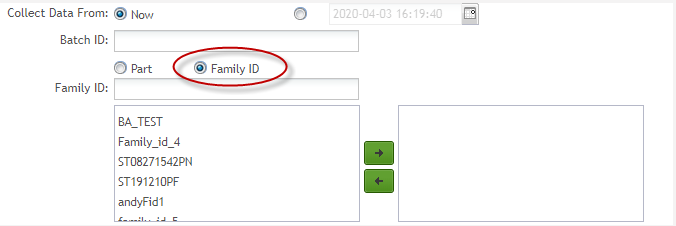
Family ID: The Family ID to be monitored by SPC. Family ID is created and configured in MDS before being created in the SPC monitor. Users must select the Family ID option manually and either enter the family ID or select one from the drop-down box.
Figure 39: Family ID
Location: The location to be monitored by SPC. Location is created and configured in MDS before being created in the SPC monitor. The Location option is selected by default. Users must enter or choose a location from the associated drop-down box.
NOTE: Attribute is associated with part number + location or part number + process. If a monitor is created with part number A + location B and part number A + process B some attributes will be associated, then the user can create Continuous control charts. The associated attributes can be viewed at the Data Collection Strategy tab.
Figure 40: Location
Process: The process to be monitored by SPC. The process is created and configured in MDS before being created in the SPC monitor. Users must select the Process option manually and then enter or choose a process from the drop-down box.
Note: If the "Route by Process" option is enabled in SFDC when a new monitor is being created, the user may select either Part Number and Location or Part Number and Process. However, if the Mfg Hold submodule is to be used to perform a hold on a serial number for a certain part number, the respective monitor should be created by selecting Part Number and Process, not Part Number and Location.
Figure 41: Process
Location Family: The location family to be monitored by SPC. Location Family is created and configured in MDS before being created in the SPC monitor. Users must select the Location Family option manually, and then enter of choosing a location family from the drop-down box.
Figure 42:Location Family
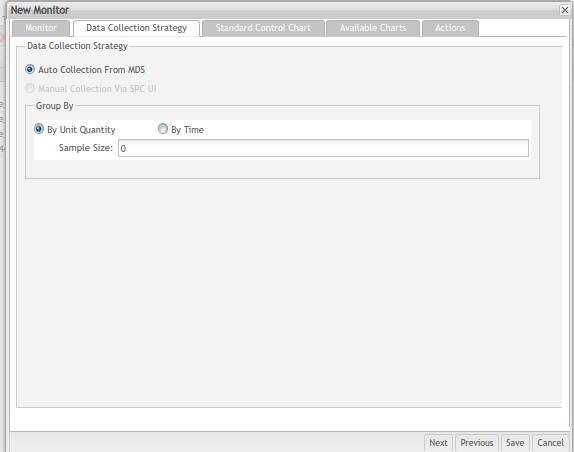
Data Collection Strategy
The second section is the Data collection strategy. According to the data chosen (Part Number and Location) at the Monitor tab, the user can create continuous control charts.
Figure 43: Data Collection Strategy forNon Continuous control charts
Auto collection from SFDC: Allows SPC monitor to automatically collect data from SFDC service. This option is chosen by default.
Manual collection via SPC UI: This availability of these options is determined by the settings in the Monitor section. If the Monitor section contains attribute data, then the option is available; otherwise, this option is unavailable.
Group by: This field defines the rules of how data should be organized to form a series of points plotted on control charts. It consists of the following components: By Unit Quantity, By Time, Sample Size textbox (if By Unit Quantity is selected), and Time Range drop-down box (if By Time is selected).
- By Unit Quantity: The data will be grouped by quantity. The quantity is defined in the Sample Size textbox. For example, if a data source contains 100 data items and the sample size value is 2, then this data source will be divided into 50 groups (100 / 2 = 50). This radio button is chosen by default.
- By Time: The data will be grouped by time range. For example, if a sampling period is 60 minutes and the time range is 10 minutes, then this sample period will contain 6 groups of data (60 / 10 = 6). Users must manually select the By Time option.
Figure 44: Group By
The sampling rules are customized by the user. The sampling method is divided into by time period sampling and by quantity sampling. The time and quantity can be set in SPC. (Default sampling first serial number.
NOTE: If there is no data in this sampling range, no new points will be created in X bar - R chart).
Figure 45: Data Collection Strategy for Continuous control charts
Sampling by: Sampling by belongs only to continuous charts. This field defines the rules on how data should be organized to form a series of points plotted on control charts. It consists of the following components:
- By Unit Quantity,
- By Time, Sample Size textbox (if By Unit Quantity is selected),
- Time Range drop-down box (if By Time is selected) and
- Full (Full Inspection).
The original system defaulted to a FULL inspection, without configuration. Due to the requirements for random sampling of E85 plant, we have added By-Time Sampling and By-Unit Quantity Sampling. By time and By quantity sampling, the system defaults to extract the first serial number of this time period/quantity for statistics.
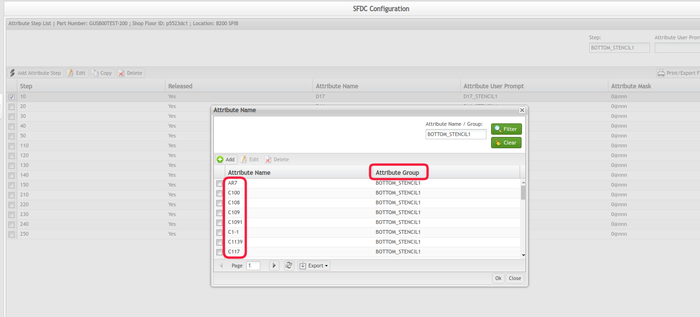
BeforeSPC 1.2.25, only the attributes with the same prefix would be recognized as a group. Now, according to the Attribute Maintenance Configuration, it is possible to check whether the attribute is in the same group.
The current SPC has an attribute grouping control logic. Only the same type of attribute can be monitored in a monitor, otherwise, it will prompt a warning message. To turn the SPC attribute grouping logic consistent with the actual SFDC attribute grouping rules, new rules were created for the attributes. According to the Attribute Maintenance Configuration, it is possible to check whether the attribute is in the same group.
Note: Only the attributes in the same attribute group can be monitored together in one monitor. Figure 46: SFDC Configuration - Attribute Configuration
Comparative Table:
|
Before SPC 1.2.25 |
SPC 1.2.25 | |
|
Rule |
Only the attributes with the same prefix will be recognized as a group |
According to the configuration of SFDC configuration to distinguish whether a group |
|
Attribute Name |
Temperature-01 Temperature-02 Temperature-03 Temperature-04 Temperature-05 |
AR7 C100 C108 C109 C1091 C1-1 C1139 C117 |
|
Attribute Group |
Temperature |
BOTTOM_STENCIL1 |
Figure 47: Sampling By
Figure 48: Export Attributes XLS
Standard Control Chart
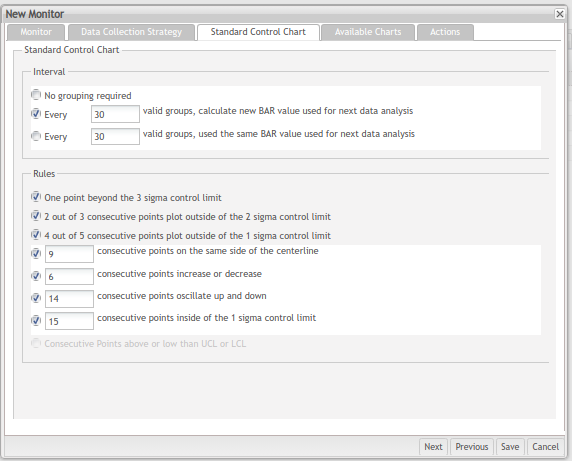
The following section is the Standard Control Chart, which contains three sub-sections: Interval, Rules, and Available charts.
Figure 49: Standard Control Chart
Interval
This sub-section has a checkbox and a textbox that defines the frequency that SPC recalculates the center line value of a control chart. Here valid groups are used as the frequency unit.
Figure 50: Interval Section
- No grouping and without recalculate bar values
- Allow user set the number of groups, calculate new BAR value used for the next data analysis
- Allow user to set the number of groups, use the same BAR value used for the next data analysis
See below a sample of the chart:
Figure 51: Chart Sample for Valid Group
Rules
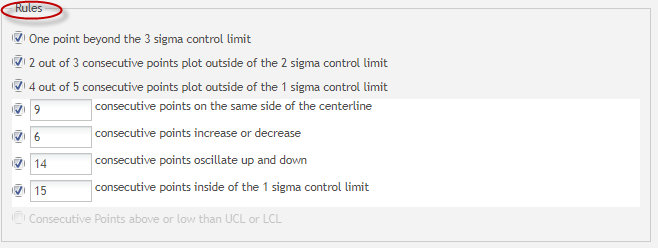
This sub-section lists all seven rules which are considered to be out-of-control exceptions. Users can select one or more rules in this checkbox group.
Figure 52: Rules Section
Consecutive Points above or lower than UCL or LCL option will be available in the selected data source is DotLine Source.
Available charts
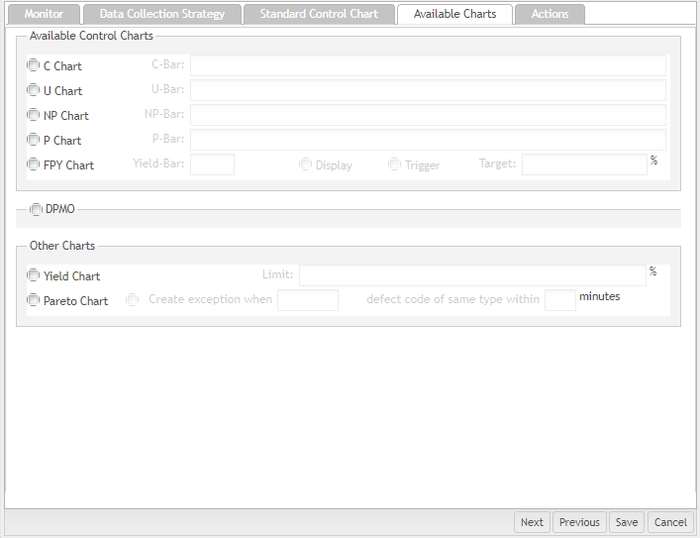
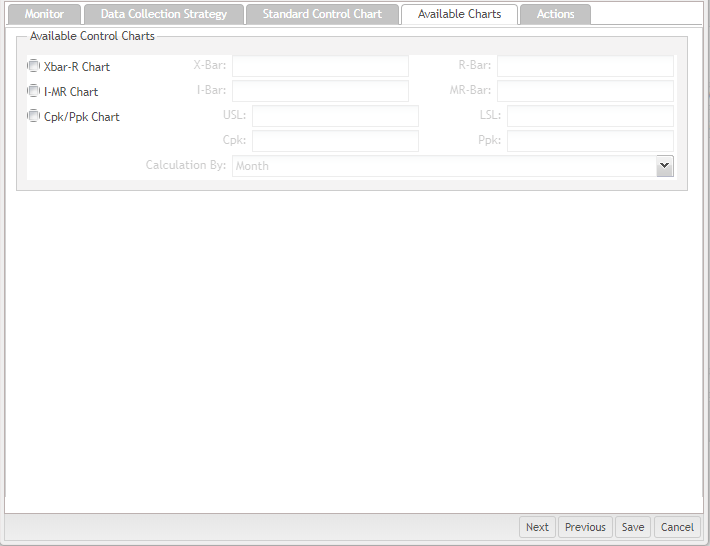
This tab displays all available control charts, DPMO, and Other Charts in the current context. The SPC Control Chart is generated based on the data source that is configured in the Monitor section so that different configurations in the Monitor section may have different available charts. Users can choose one or more control charts in this checkbox group.
Figure 53: Available Charts (non Continuous control charts)
The textbox on the right of the chart name is used for defining the centerline value of the control chart. For example, if a user chooses the C Chart checkbox, the C-Bar textbox becomes available. Users can then manually enter a number in the textbox, which becomes the centerline value of the chart.
Figure 54: C-Chart Fields
Note: Be careful with the values entered in the textbox for control charts if the line stoppage function is enabled. If the Send MFG Hold Request to SFDC / MDS checkbox was selected when creating an SPC server, SPC may stop the production line if a user defines unreasonable values for the control chart based on the rules selected.
For FPY Chart, selecting the Display checkbox enables SPC to display FPY chart in the monitor. The Trigger checkbox enables an out-of-control warning.
Before SPC 3.2, SPC Cpk / Ppk Chart data has only one revision that contains all data. This is inconvenient particularly when a user wants to generate a Cpk / Ppk Chart once a month for their clients. Beginning with SPC 3.2, Cpk / Ppk Chart adds a date range setting function enabling the user to set a date range for Cpk / Ppk chart data.
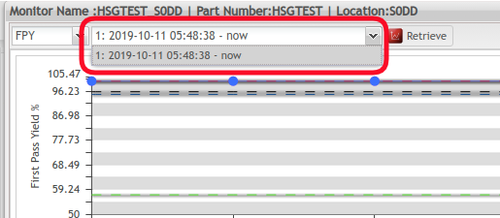
Figure 55: Choose Specific Version
Note: The Current SPC allows the user to choose a specific version to display FPY chart.
Other Control Chart
The fourth section is the Other Control Chart. The components of this section are as follows:
Figure 56: Other Control Chart
DPMO Chart: Enables SPC to monitor a manufacturing line with a DPMO chart. Defect opportunity and UCL represent the two parameters used for defining DPMO charts.
Note: The other 4 charts are custom made by the company according to the specific defect code. For example:
DPMO-Placement Chart: Placement is a defect code name. The chart is only for this defect code. The other 3 charts are the same.
Figure 57: DPMO Chart Types
Yield Chart: Enables SPC to monitor the manufacturing line with the Yield chart. The Limit' is a parameter used for defining the Yield chart.
Pareto Chart: Enables SPC to monitor the manufacturing line with a Pareto chart. Users can define a Pareto chart exception rule by selecting the Create exception when checkbox and entering, for example, 3 defect code of the same type within 10 minutes.
Figure 58: Create Exception When Fields
For Continuous control charts, the available control charts are described below:
Figure 59: Available Control Charts for Continuous control charts
The Calculation by field in theCpk / Ppk chart settings has two available options: All Data and Month. By default, All Data is selected.
All Data: SPC generates only one revision with all Cpk / Ppk chart attribute data.
Month: The Cpk / Ppk chart data collection duration for this monitor will be based on a natural full month.
The Method of Std Dev(within) in the cpk/ppk chart has three available options: Pool standard deviation, Rbar, and Average moving range.
The method used to Std Dev(within) depends on the subgroup size.
When subgroup size > 1, SPC estimates Std Dev(within) using one of the following two methods: Pooled standard deviation and Average of subgroup ranges (Rbar), SPC select Pooled standard deviation method by default.
When subgroup size = 1, SPC estimates Std Dev(within) using the Average moving range method.
Xbar-R Chart: X-bar and R (range) chart is a pair of control charts used with processes that have a subgroup size of two or more.
I-MR Chart I-MR chart is a combination of two charts (Individual and Moving Range) is to track the process variability based on the samples taken from a process over the period of time. An Individual moving range (I-MR ) chart is used when data is continuous and not collected in subgroups.
See below description and samples of the main available charts at SPC:
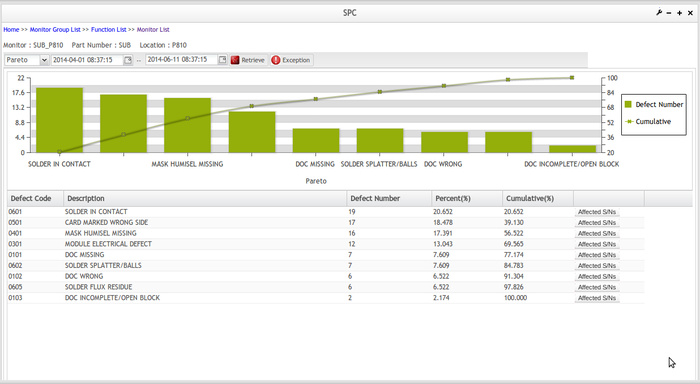
Pareto Chart
Preto chart indicates which problem to tackle first by showing the proportion of the total problem that each of the
smaller problems comprises. It is a type of chart that contains both bars and a line graph, where individual values
are represented in descending order by bars, and the cumulative total is represented by the line.
Figure 60: Pareto Chart
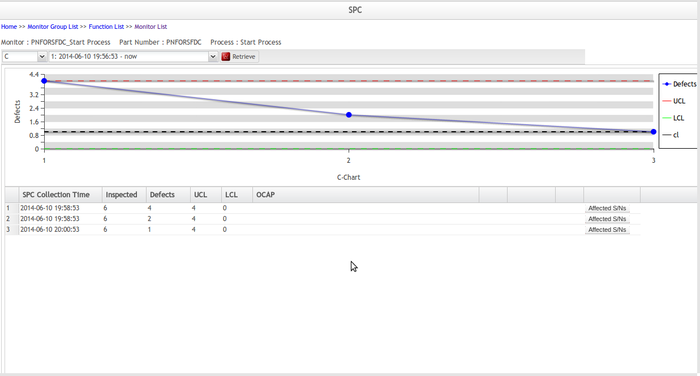
C-Chart
C-chart is an attribute control chart used with data collected in subgroups that are the same size.
It shows how the process, measured by the number of nonconformities per item or group of items, changes over time. Nonconformities are defects or occurrences found in the sampled subgroup. They can be described as any characteristic that is present but should not be or any characteristic that is not.
Figure 61: C Chart
P-Chart
P-chart is an attribute control chart used with data collected in subgroups of varying sizes. Because the subgroup size can vary, it shows a proportion on nonconforming items rather than the actual count. P-charts show how the process changes over time.
Figure 62: P Chart
NP-Chart
NP-chart is an attribute control chart used with data collected in subgroups that are the same size. NP-charts show how the process, measured by the number of nonconforming items it produces, changes over time.
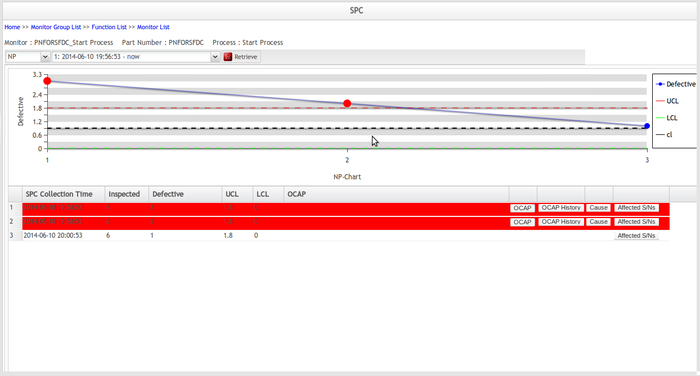
Figure 63: NP Chart
U-Chart
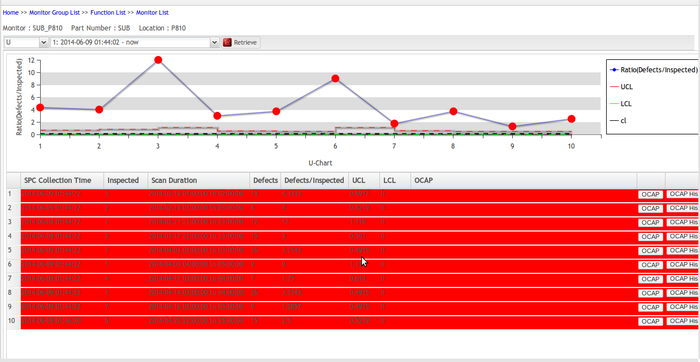
U-chart is an attribute control chart used with data collected in subgroups of varying sizes. U-charts shows how the process, measured by the number of nonconformities per item or group of items, changes over time.
Figure 64: U Chart
XBar-Chart
X-bar and R (range) chart is a pair of control charts used with processes that have a subgroup size of two or more.
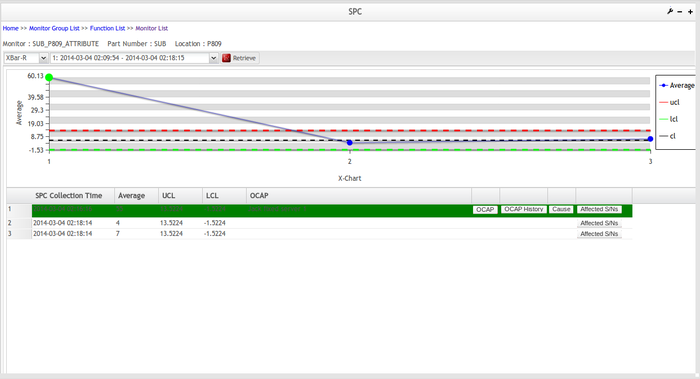
The standard chart for variables data, X-bar, and R charts help determine if a process is stable and predictable. The X-bar chart shows how the mean or average changes over time and the R chart shows how the range of the subgroups changes over time.
Figure 65: XBar Chart
R-Chart
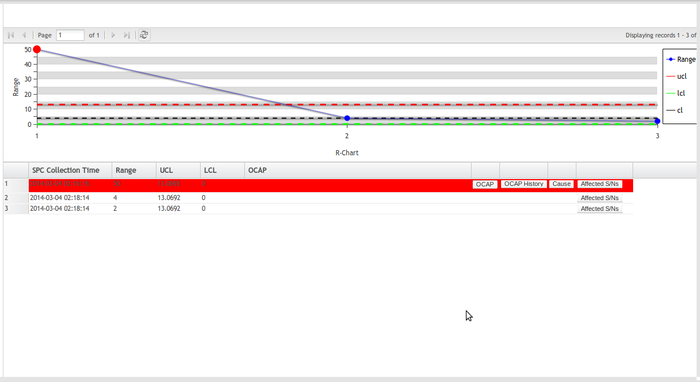
The X-bar chart shows how the mean or average changes over time and the R chart shows how the range of the subgroups changes over time.
Note: LCL can’t be negative. Both S (Standard Deviation) and R (Range) can't be negative, because by the nature. All the points that the user scans are displayed on the chart and when expanding chart details, all the information in the chart page is collected such as SPC Collection time, Average, LCL, UCL, OCAP, attributes, etc. and There are no negative numbers on Y-axis.
Figure 66: R Chart
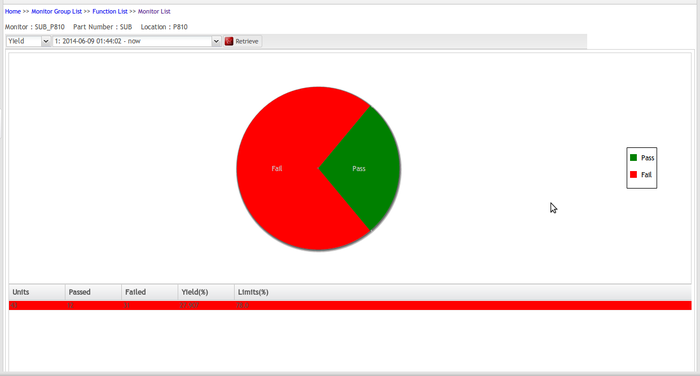
Yield -Chart
This chart shows the Yield value for a selected or retrieved process, one at a time, and a list of the N last products passed on this process.
Figure 67: Yield Chart
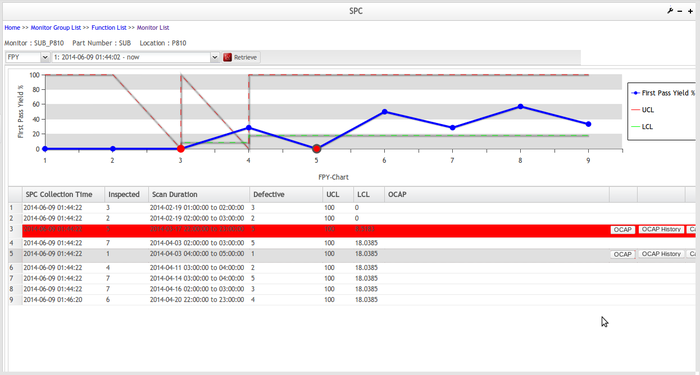
FPY-Chart
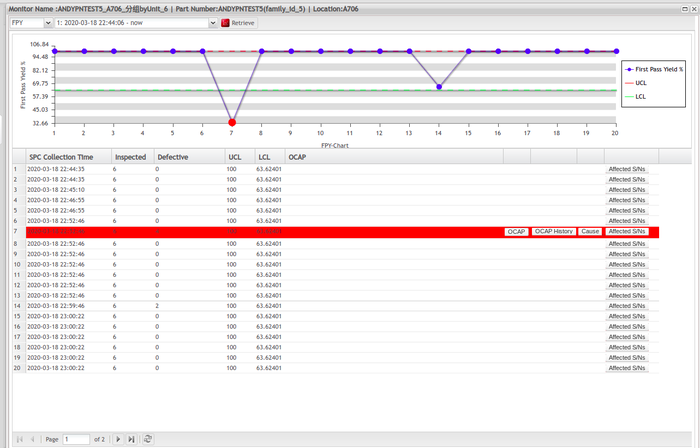
FPY is a First Pass Yield:
- Capable of plotting the First Pass Yield of a product at a particular process step over a period of time or number of boards.
- Capable of manual configure the upper control limit and lower control limit.
- Can displays the target (Goal) line
- Capable to use the 7 Rule alarms for triggering
- Capable to trigger the alarm when FPY falls below the Target Line
Figure 68: FPY Chart
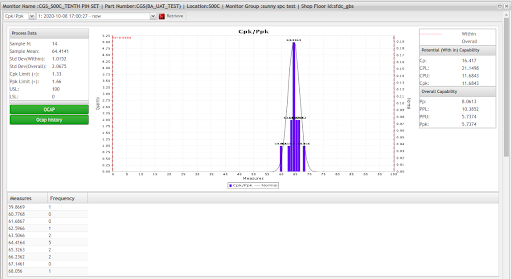
CPK/PPK-Chart
CPK/PPK is to show if the real process capability meets the specification
Definitions
Cp= Process Capability. A simple and straightforward indicator of process capability.
Cpk= Process Capability Index. Adjustment of Cp for the effect of non-centered distribution.
Pp= Process Performance. A simple and straightforward indicator of process performance.
Ppk= Process Performance Index. Adjustment of Pp for the effect of non-centered distribution.
Cpk is for the short term, Ppk is for the long term.
Cp and Cpk
It is common to express process capability in terms of:
- How well can we meet customer’s specification?
- Voice of Customer / Voice of the process
- It is a potential capability index - Cp is defined as:
Cp = USL – LSL/6σst
The minimum acceptable value for Cp is normally considered to be 1
Cpk = Min (USL- x, x – LSL)/3σst
When there is no shift or drift, Cpk and Cp are equal. As the process drifts, Cpk gets smaller.
Pp and Ppk Chart
Over time, the drift in the process will have the effect of ‘flattening out’ the distribution, and the standard deviation of the process will increase. To reflect this effect properly, we define two long term capability indices, Pp and Ppk.
These indices have the same formulas as their short term counterparts, but use the long term standard deviation in their denominators, σlt
Pp = USL – LSL/ 6σlt Ppk = Min (USL- x, x – LSL)/3σlt
Figure 69: CPK/PPK Chart
Available Charts
The following section is the AvailableCharts, which contains three sub-sections: Available Control Charts, DPMO, and Other charts.
Actions
The fifth section is the Actions. This section defines what actions should be taken after the out-of-control exception is triggered.
Figure 70: Actions
Send alert e-mail: This action sends an alert email to a specified person. Users can specify who would receive these alert emails in the Email Maintenance module.
Change the background color to red: If the exception was triggered, the background of the associated data record in this monitor will turn to red.
Send MFG hold request after n minutes: This action is an SPC line stopper function. To enable this action, the following options must first be enabled:
- Send MFG Hold request to SFDC / MDS checkbox in Add Server Information page.
- Pareto Chart checkBox in Other Control Charts section.
- Create an Exception when n1 defect code of the same type within n2 minutes checkbox in the Other Control Charts section.
If Send MFG hold request after n minutes checkbox is enabled and if n1 defect code of the same type were scanned via NetDC within n2 minutes, SPC will send an MFG hold request to SFDC / MDS after n minutes. If the input minutes is 0, SPC will send the MFG hold immediately.
NOTE: This checkbox is not selected by default. Line stopper only supports part number. So if a user selects a Family ID in the Monitor section, this option will not be available.
Lastly, remember to click ![]() to save all the configurations before you leave the page, or click
to save all the configurations before you leave the page, or click ![]() button if you want to give up the configuration and return to the Monitor List page.
button if you want to give up the configuration and return to the Monitor List page.
Search Monitor
The Search Monitor portlet makes it very convenient to find a specific monitor from the monitors list. You can find this function in the toolbar on the Monitor List page.
Figure 71:Search Monitor
Users can search monitor by keyword and monitor status.
By keyword: Users can search existing monitors according to a keyword by first clicking the keyword drop-down box (the green framed area in Figure 43 and selecting a category. A corresponding can then enter a keyword in the adjacent textbox.
By monitor status: Users can search monitor by monitor status. Users must select a monitor status from the status categories drop-down list.
Once search criteria have been selected and entered, select ![]() to execute the search action.
to execute the search action.
Hide Inactive Monitors
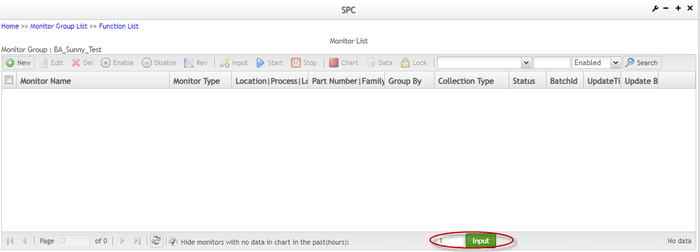
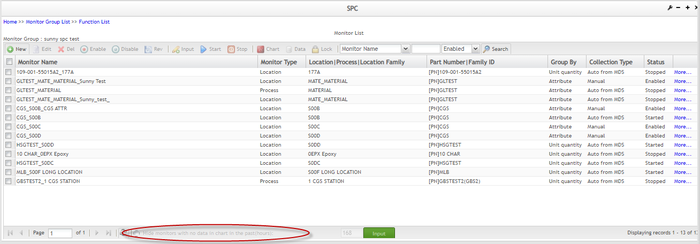
It allows you to filter out those monitors that have no new data coming in during the past settable hours. You can define the settable hours in the SPC System Parameter Maintenance module, and view active monitors in the Monitor List page. Besides, you can turn off the filtering inactive monitors function.
View Active Monitors by Default Hours
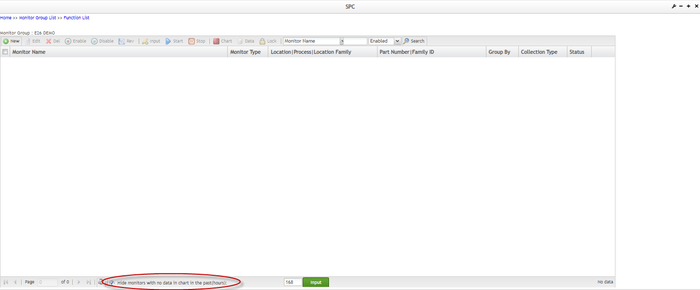
In the Monitor List page, the checkbox Hide monitors with no data in chart in the past(hours) are selected by default along with a textbox displaying the hours defined in the SPC System Parameter Maintenance module. The SPC system filters out those inactive monitors that meet the condition.
Figure 72: "Hide monitors with no data in the chart..." Checkbox
Edit Settable Hours
Edit the hours' textbox value and select Input to view corresponding monitors. The value allowed in this textbox is a positive integer between 1 to 168. Modification of the value here does not affect the value defined in the SPC System Parameter Maintenance module.
Figure 73: Edit Settable Hours
Disable Hide Inactive Monitors Function
Unchecking the Hide monitors with no data in chart in the past (hours) box deactivates the monitor filtering function so that SPC system shows all existing monitors.
Figure 74: "Hide monitors with no data in the chart..." Checkbox Unselected
Edit Monitor (Edit Monitor in Batch)
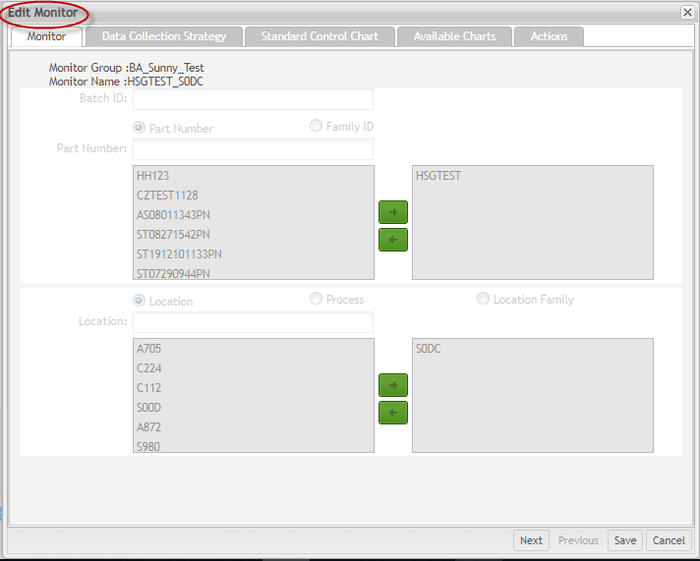
SPC allows users to modify the parameters of an existing monitor according to their needs. Users can modify sections including Interval, Rules, Available charts, Other control charts, and Actions. to edit monitors, they must bestopped.
- Select a monitor from the monitor list in the ‘Monitor List’ page, then hit the
 icon in the toolbar.
Figure 75: Monitor List - Edit Monitor Page
- From the Edit Monitor page, modify the preferred available information.
Note that the Monitor tab and Data Collection Strategy tab are not allowed to be modified. Update the other tabs' information accordingly.
Figure 76: Edit Monitor Page
Note: If the Data Collection Strategy selected is Manual Collection via SPC UI, a user can also modify the Attribute values.
Edit Monitor in Batch
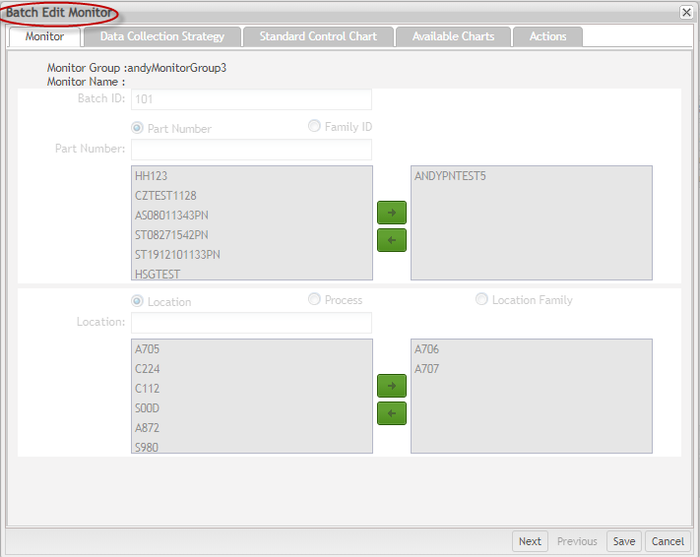
- Search for the Batch ID and select the monitors in the batch to edit and then hit the
 in the toolbar.
Figure 77: Monitor List - Edit Monitors in Batch
Figure 78: Batch Edit Monitor page
- From theEdit Monitor page, modify the preferred available information.
Note that the Monitor tab and Data Collection Strategy tab are not allowed to be modified. Update the other tabs information accordingly.
Figure 79: Edit Monitor Page
Note: If the Data Collection Strategy selected is Manual Collection via SPC UI, the user can also modify the Attribute values.
Manually Input Data to Monitor
To date, the SPC monitor supports three data collection strategies: Auto Collection From SFDC, Manual Collection Via SPC UI and Auto Collection from SPC Machine, which can be configured in the Data Collection Strategy section. If ‘manual collection via SPC UI’ is selected as a data collection strategy, data must be manually entered after the monitor is created. Starting with version 3.2, SPC supports entering data once to both single and multiple monitors.
Input Data for Only One Monitor
To enter data for one monitor
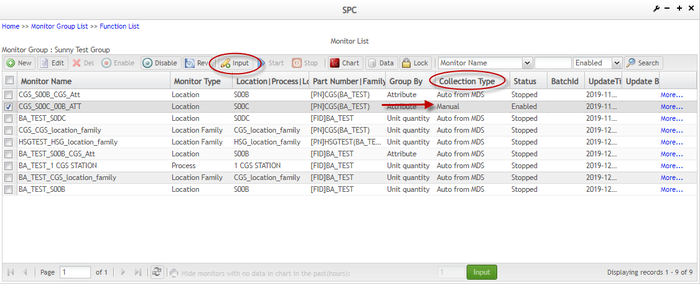
From the Monitor List screen, select the monitor that needs to be manually input data (the ‘Collection Type’ value of this monitor is ‘Manual’), and then click the ![]() icon.
icon.
Figure 80: Monitor List - Input
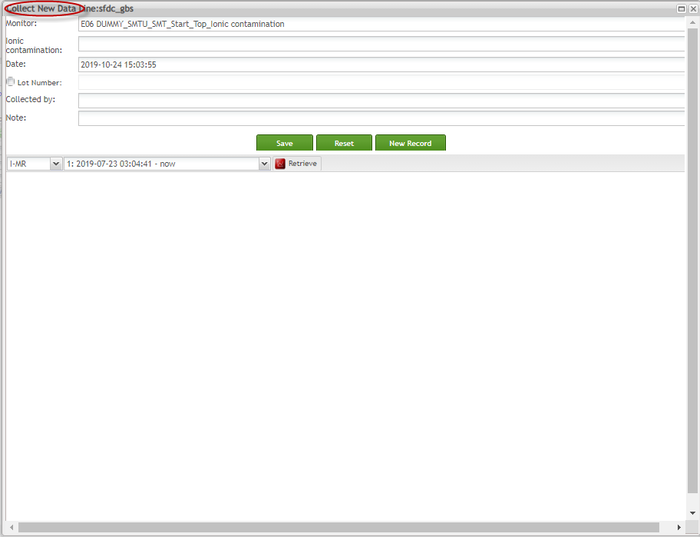
On Collect New Data page, input attributes data to correspondent fields.
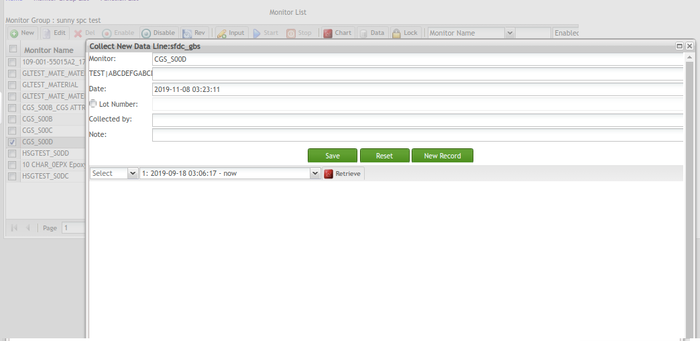
Figure 81: Input - Collect New Data Page
Input Data for Multiple Monitors At Once
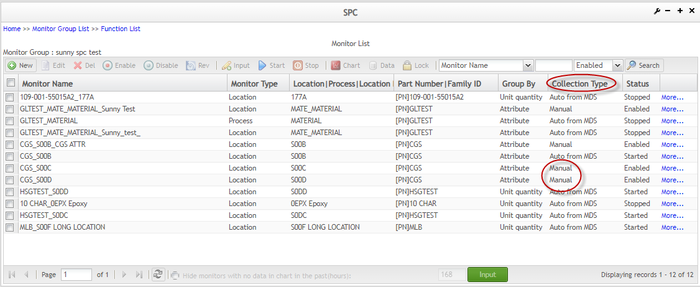
Users can select and input data to multiple monitors at once, as long as all of the selected monitors' Collection Type is Manual.
Figure 82: Monitor List - Collection Type Column
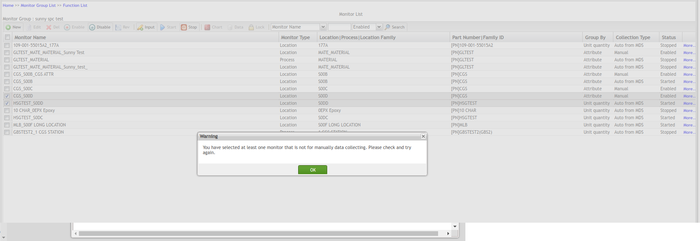
Note: If a user has selected monitors that contain at least one monitor whose Data Collection Type is not Manual and clicks Input, he or she will be prompted by an alert window saying 'You have selected at least one monitor that is not for manually data collecting. Please check and try again.' Close the alert window by clicking Ok.
Figure 83: Collection Data Type Alert Window
Input Attributes for The Current Monitor
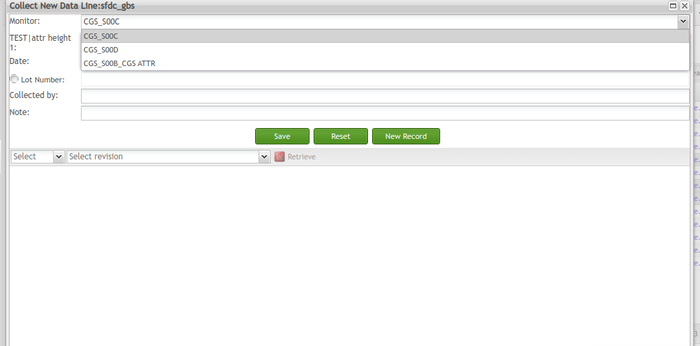
On the Collect New Data page, users can enter attributes for multiple monitors at once. The Monitor drop-down list displays the currently selected monitor to be input data. Users can view Line, Monitor name, and Location of the current monitor on the top left the corner. Note that the allowed input of attributes is number only.
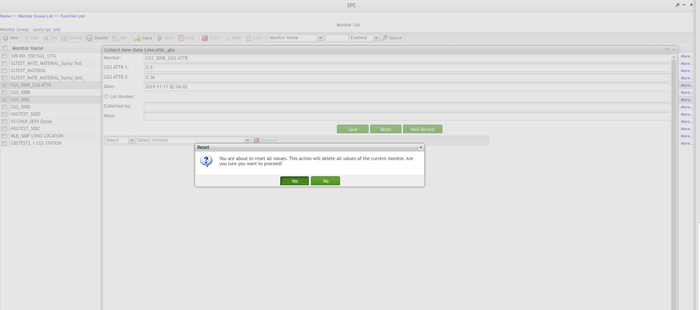
Note: If a user has input values in at least one of the fields and selects Reset, an alert window displays with the warning message, 'You are about to reset all values. This action will delete all values of the current monitor. Are you sure you want to proceed?' Selecting Yes resets all entries for the current monitor to the default value.
Figure 84: Collect New Data Page Reset - Alert Window
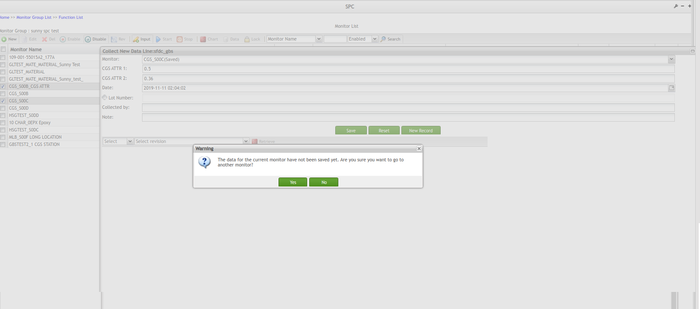
Note: If a user has input values set to at least one of the fields, and selects another monitor from the Monitor drop-down list, an alert window displays with the warning message, 'The data for the current monitor has not been saved yet. Are you sure you want to go to another monitor?' Selecting Yes will redirect the user to another monitor without the current monitor's data stored in the SPC system.
Figure 85: Collect New Data - Selecting a Different Monitor Alert Window
Note: If users have input values to at least one of the fields and select the New Record button, an alert window displays with a warning message, 'You are about to cancel the attribute data entering. The current monitor will have no attributes recorded. Are you sure you want to proceed?' Selecting Yes will move a user to the Monitor List page without current monitor's data stored in the SPC system.
Figure 86: Collect New Data - New Record Alert Window
Save current monitor's attributes data
On the Collect New Data page, if a user has finished inputting data to the current monitor, and selects Save, all the current monitor fields turn grey except the Monitor drop-down list and the user cannot edit any data. The current monitor name in the Monitor drop-down box changes to 'monitor_name (Saved)' where monitor_name is the name of the current monitor. Now the user can switch to another monitor to input attributes data to that monitor.
Figure 87: Save Monitor Attributes
Switch to Another Monitor
To switch to another monitor to input attributes, click the Monitor drop-down box and select another monitor from the list
Figure 88: Selecting Another Monitor
Back to the 'Monitor List' page
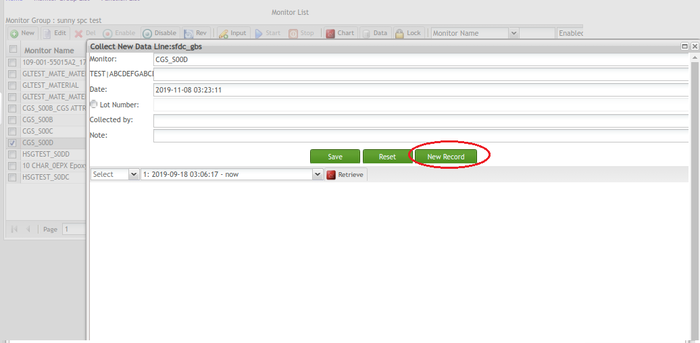
To go back to the Monitor List page, select the ![]() button.
button.
Figure 89: Monitor List - New Record
Start, Stop, Disable, Enable, Delete Monitor
Start monitor
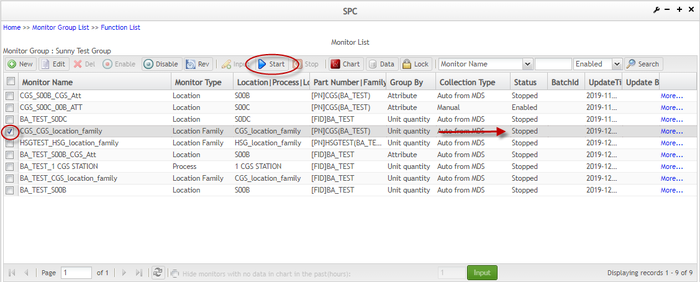
After a new monitor is created, its status is Enabled by default. If the monitor's data is automatically collected from SFDC, it must be started manually to make it collect data from SFDC.
1. To start a monitor, check the box of a monitor in the Monitor List page and select the ![]() icon in the toolbar.
icon in the toolbar.
Figure 90: Monitor List - Start
Note: Users search started monitors in the monitor list, by selecting Started from the monitor status drop-down list and clicking the ![]() icon.
icon.
Figure 91: Monitor Name with Started Status Selected
Stop monitor
If a user does not want a monitor to collect data from SFDC, the monitor can be stopped. To stop a monitor,
Figure 92: Monitor List - Stop
NOTE: Users can search stopped monitors in the monitor list, by selecting Stopped from the monitor status drop-down box and clicking the ![]() icon.
icon.
Figure 93: Monitor Name with Stopped Status Selected
Disable monitor
If a user does not need a monitor to operate, the user can disable the monitor.
- To disable a monitor, check the box of the monitor.
- Select Stop.
- Select the
 icon to disable the monitor.
Figure 94: Function List - Disable
Users can search disabled monitors using the search function by selecting Disabled from the monitor status drop-down box and clicking the ![]() icon.
icon.
Figure 95: Monitor Name with Disabled Status Selected
Enable disabled monitor
To enable a disabled monitor
- Find the disabled monitor in the list and check the box for that monitor.
- Click the
 icon in the toolbar.
Figure 96: Function List - Enable
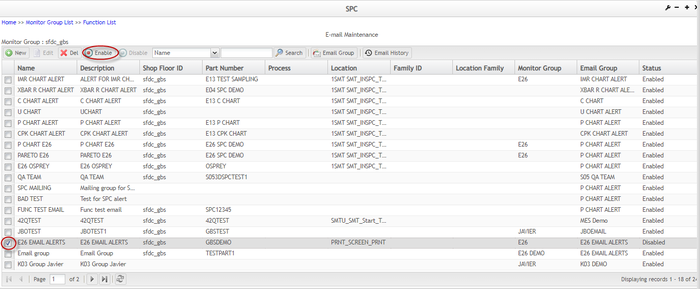
Users can search enabled monitors using the search function by selecting Enabled from the monitor status drop-down list and clicking the ![]() icon.
icon.
Figure 97: Monitor Name with Enabled Status Selected
Delete Monitor/Delete Monitor in Batch
If a user no longer needs a monitor or monitor in batch and wants to remove it, the monitor can be deleted. Note that once a monitor is deleted from SPC, it cannot be restored, and this is permanent.
To delete a monitor
- Check the box of the monitor to be deleted, and select Disable to disable the monitor first.
- Once the monitor is disabled, locate the monitor in the disabled monitor list, and check the box of the monitor to select it
- Click the
 icon in the toolbar.
Figure 98: Function List - Delete
- Then choose Yes in the pop-up window
Figure 99: Delete Pop-up
View Control Chart, Data & Write OCAP
Control Chart is a very important tool for SPC to monitor the manufacturing line. Through the analysis of control charts, users can learn whether a manufacturing line or process is under control and determine the reasons for an out-of-control exception, so that they can take appropriate measures. To date, our SPC system supports 11 control charts: C chart, U chart, P chart, NP chart, DPMO chart, FPY chart, Yield chart, Pareto chart, X Bar-R chart, I-MR chart, and Cpk / Ppk chart.
Beginning with SPC 3.2, the SPC development team applies Ext JS technology other than the old Jfreechart technology to all of the 11 control charts. The Ext JS technology enables SPC to represent more interactions with the user from the UI perspective. For instance, a user can view more information about a chart point by hovering their cursor over the point. Also, users can view both SPC charts and data on the same page without having to open them on different pages.
View Control Chart
Here take the C chart as an example to demonstrate how to view the control chart with the Ext JS technology enhancement. The operation of other control charts is similar to the C chart below.
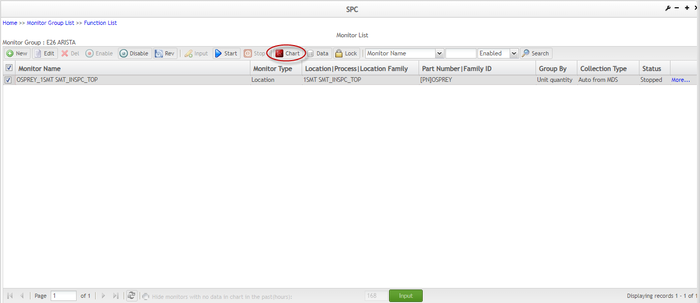
- To SPC view the control chart, from the Monitor List page, select a monitor, and click the
 icon in the toolbar. This displays the chart page.
Figure 100: Function List - Chart
Note: On the top of the page you will see a few brief information on the control chart, such as to monitor name, part number, location. The family ID can also be displayed here if the Display Family ID is checked in the SPC Portal System Parameter module.
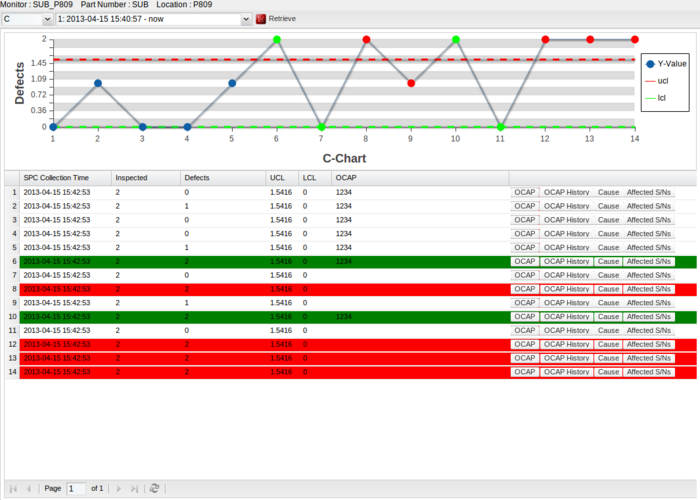
To view the C chart, you need to choose 'C' chart from the chart drop-down list, select a revision from the revisions drop-down list, and click Retrieve, then SPC generates a C Chart according to the parameters you submitted and displays the C Chart and its data in the current page.
Figure 101: C-Chart Retrieve
Tips:
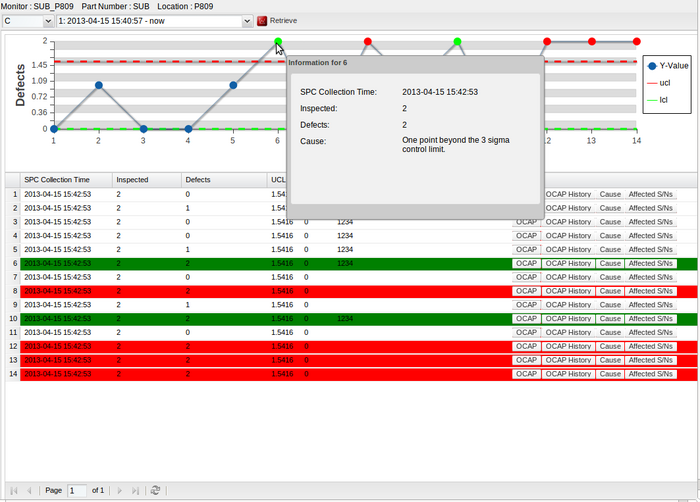
- On the Chart, blue points are normal points, red points are exception points, green points are exception points that have been written OCAP
- If you move the cursor over a point in the chart, a pop-up window will be prompted showing more information on the selected point, including SPC Collection Time, Inspected, Defects and Cause. Note that control charts vary in more information on a selected point.
- If you click a point on the chart, the corresponding data line in the data list will be highlighted; if you select a data line from a data list, the corresponding point on the chart will be highlighted as well
- The red background of a data line means that this data item has violated the rules you defined in the Rules section, and the OCAP of this data record has not been processed yet; the green background of a data line indicates that OCAP of this data record has been processed.
- This data list table structure consists of 9 columns: SPC Collection Time, Inspected, Defects, UCL, LCL, OCAP, OCAP History, Cause and Affected S/Ns.
Figure 102: C-Chart Information Points
Write OCAP
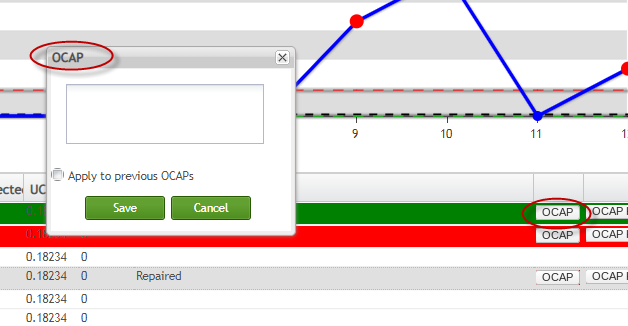
To write OCAP means to write something about the fix to the exception. To do this
- Click the
 icon, then input the description of this OCAP in the pop-up OCAP windows.
 - Click
 to save the change to SPC.
Figure 103: OCAP Window
If there are more than one unprocessed OCAPs after entering a description of the current OCAP, enable the Apply to previous OCAPs checkbox to apply the change to all the unprocessed OCAPs.
After the OCAP is processed, the background of the associated data record will turn green.
View OCAP History
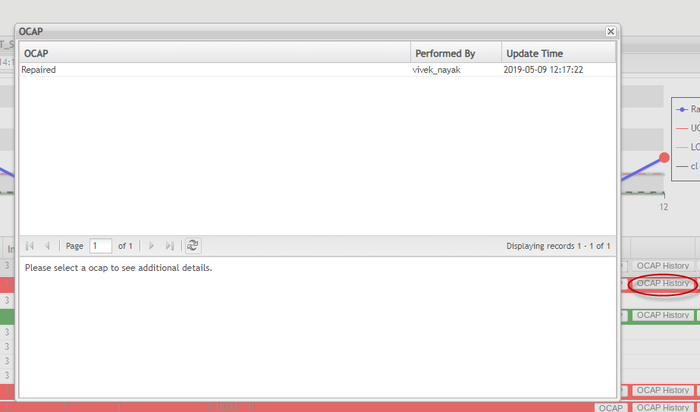
Select ![]() to view the OCAP history of a data record in the pop-up OCAP history window.
to view the OCAP history of a data record in the pop-up OCAP history window.
Figure 104: OCAP History
View Cause
Select ![]() to view the rules that the current point has violated.
to view the rules that the current point has violated.
Figure 105: Cause
View Affected S/Ns
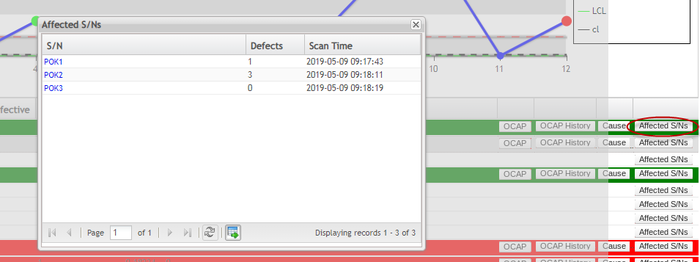
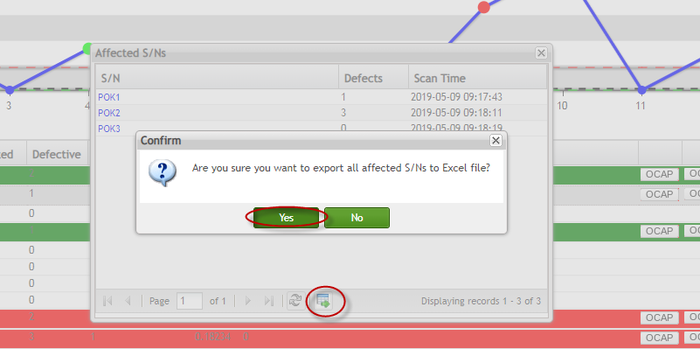
Users can view the affected serial numbers and export them to an Excel file.
Figure 106: Affected Serial Numbers
- To export the affected S/Ns to an Excel file, click the
 icon at the bottom of the Affected S/Ns window.
 - Select Yes to confirm the action.
Figure 107: Confirm Export Alert
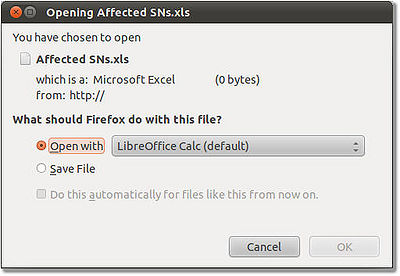
- Choose whether to open the XLS file or save it to the hard drive.
Figure 108: Open or Save XLS
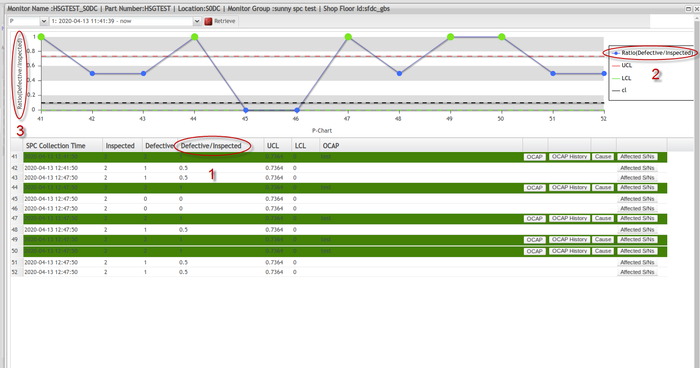
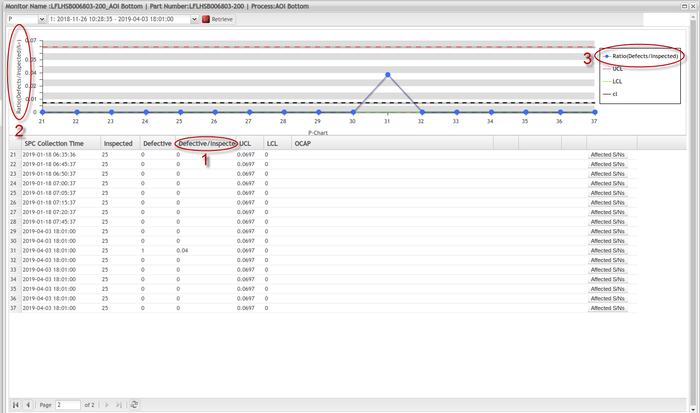
For P Chart, some enhancements were implemented as displayed below:
Label 1 shows the number of Defective / Inspected. It means the number of defective units / total number of samples, this value should be between 0 and 1.
This value should also be displayed in label 2 and label 3. but the current system uses defects / inspected. The number of defects / inspected may be greater than 0, this will make users confused.
Figure 109: SPC_P Chart Sample
View and Edit Data
View Data List
Users can view detailed data of a monitor. To do this,
Figure 110: Data List
In the ‘Data List’ page, set the time frame for the search by selecting the beginning date and ending date in the toolbar (the green frame area in Figure 5.65).
Select a status from the data status drop-down list (the red frame area in Figure 5.65) and click the ![]() icon to view the matching data.
icon to view the matching data.
Figure 111: Data List Page - Search Fields
.
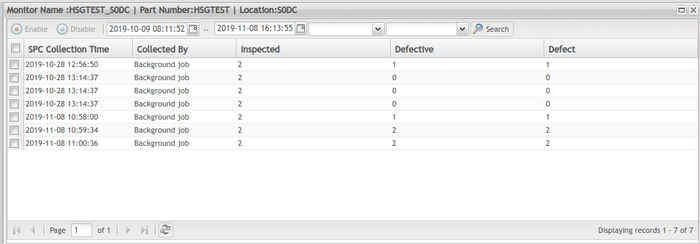
Figure 85 shows data records of a monitor whose data is automatically collected by SFDC.
Figure 112: Data List - Automatically Collected Records
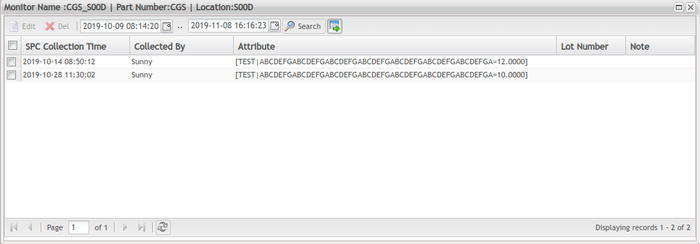
Figure 86 shows data records of a monitor whose data is manually collected via SPC U.
Figure 113: Data List - Manually Collected Records
Disable Data
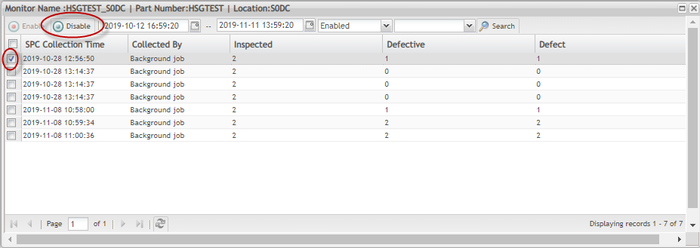
A data record in the data list stands for a single point in a control chart. Disabling a data record will remove the associated point from the control chart. To disable a data item,
Check the box of a data record, then click the ![]() icon in the toolbar.
icon in the toolbar.
Figure 114: Data List - Disable
Users can search disabled data records by setting the time frame for the data record by selecting the beginning date and ending date and selecting Disabled from the data status drop-down box (the red frame area in Figure 5.69). Then click the ![]() icon to execute the search action.
icon to execute the search action.
Figure 115: Data List - Search Fields
Enable Data
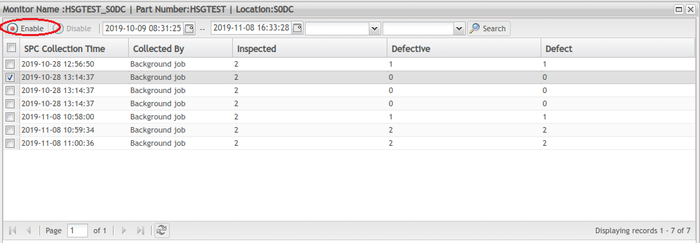
Enabling data restores a data record from disabled status. To do this,
1. Select the data record from the disabled data list, then click the ![]() icon in the toolbar.
icon in the toolbar.
Figure 116: Data List - Enable
Edit Data
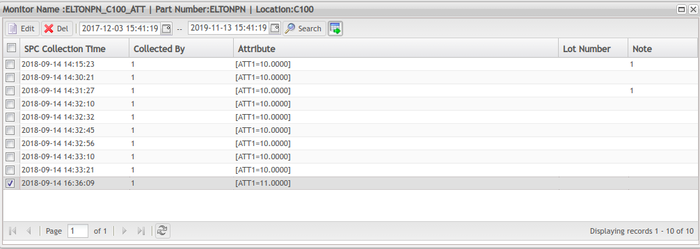
This function is limited to the monitor whose data is manually collected by SPC UI. To edit data record
- From the Monitor List page, select a monitor whose Collection Type value is Manual. and click the
 icon.
icon. - In the Data List page which lists the enabled data, go to the last page of the list, select the last line and click
 in the toolbar (Only the last data record is allowed to be modified). The user is redirected to the Edit Data page where any data fields may be edited.
 - Select Save to complete the changes.
Figure 117: Data List - Edit
Figure 118: Edit Data Page
Maintain Lock
SPC offers you a full set of functions to manage MFG hold. When creating a new SPC server, users can decide whether to send MFG hold requests to MDS / SFDC. When creating a new monitor, users can define the minutes of delay before MFG hold was sent. Users may view lock records and unlock existing locks as well.
View Lock
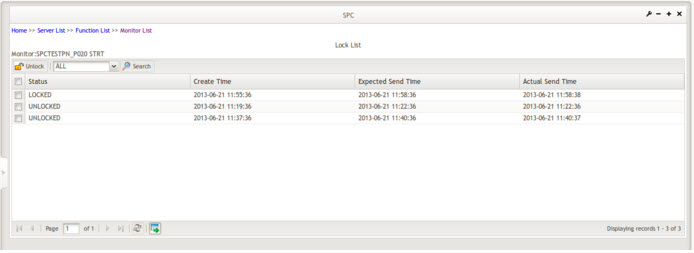
- To view lock, from the Monitor List, select a monitor and click the
 icon in the toolbar. The Lock List page displays.
Figure 119: Monitor List - Lock
Figure 120: Lock List Page
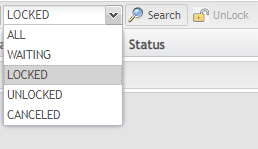
Beginning with SPC 3.2, the lock mechanism has been modified so that only the Pareto chart can send MFG hold requests to SFDC / MDS. Users can view locks in different status as long as different values are selected in the lock status drop-down list. For example, if a user wants to find locked locks, select LOCKED from the lock status drop-down list, and click the ![]() icon in the toolbar.
icon in the toolbar.
Figure 121: Lock Search Drop-down
User can search lock data by control chart type and lock status.
There are four statuses for locks: WAITING, LOCKED, UNLOCKED, and CANCELED. The CANCELED status was added in SPC 3.2.
- WAITING: the lock that is waiting to be sent to MDS / SFDC. When an out-of-control case is detected, SPC will wait some minutes before sending the MFG hold to MDS / SFDC until it reaches the number of minutes that defined by Send MFG hold request after * minutes field in the Actions section. During this period, the lock is in WAITING status.
- LOCKED: MFG hold has been sent, associated location or process has been locked and OCAP has not been processed.
- UNLOCKED: User input OCAPs to unhold associated location or process, then the locked lock becomes UNLOCKED.
- CANCELED: This lock status is a new status as of SPC 3.2. For a better understanding of this status, consider the following scenario: A SPC monitor was created for Pareto Chart that 3 defect codes of the same type within 10 minutes will trigger the exception, and MFG hold will be sent to SFDC / MDS 5 minutes later. A few minutes later, a first MFG hold was triggered, if a second MFG hold was triggered during the first hold’s delay sending time in the new lock mechanism, the second hold will not be sent to SFDC / MDS, and the status of the second MFG hold is CANCELED.
Unlock Lock
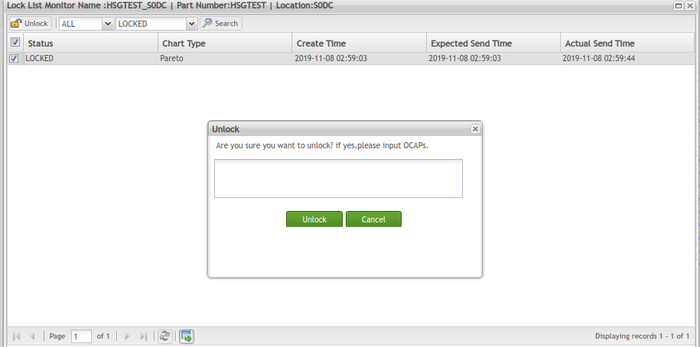
To unlock a lock
Figure 122: Unlock Icon
- In the pop-up window, input OCAP to unlock the associated location or process.
Figure 123: OCAP - Unlock
Export Lock List to Excel
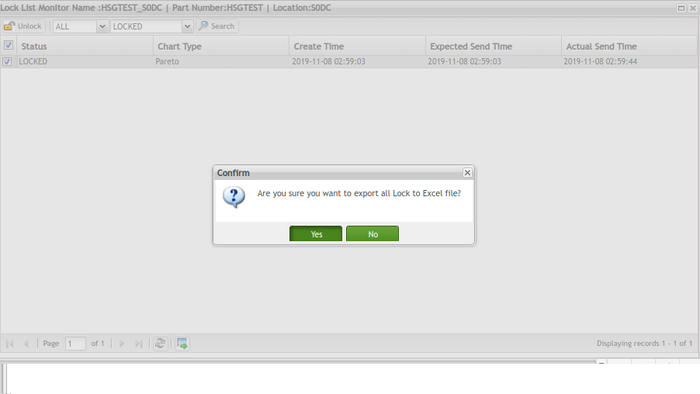
User can export the lock list to Excel file:
Figure 124: Lock List -Export Icon
- Select Yes in the pop-up window to confirm the action.
Figure 125: Export Confirmation Pop-up
View Monitor Details
To learn detailed information about a monitor
- Go to the Monitor List page, select a monitor, and click the
 text link at the right side of the line.
Figure 126: Function List - More
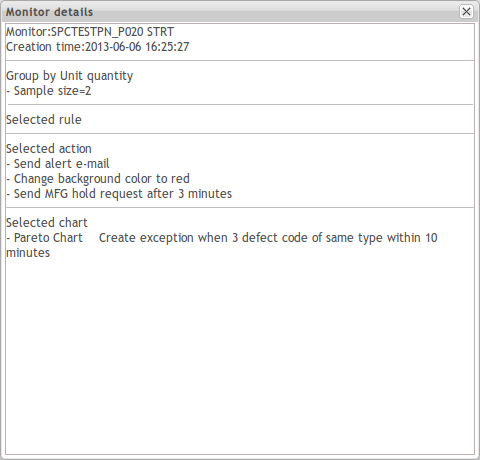
- In the pop-up Monitor, the details window provides multiple items of information including monitor name, data collection strategy, interval, rules, selected charts, and actions.
Figure 127: Monitor Details Pop-up
View Monitor History
To view the modification history of a monitor,
Figure 128: Monitor List - Rev Icon
Email Maintenance
Brief Introduction
Email notification is an important way for SPC to monitor the manufacturing line in real-time. When exceptions are found, SPC will send an email alert to associated employee or supervisor so that they can analyze the exception according to the alert email and other SPC tools and take appropriate measures, such as checking the production line, writing OCAPs, and stopping the line.
To access the Email Maintenance Page:
Figure 129: Function List - E-mail Maintenance Icon
The Email Maintenance page is displayed:
Figure 130: Email Maintenance
From the Email Maintenance page the users are able to access the following functionalities:
- Email History
- Email Group
- Add Monitor Receive Email Rules
- Edit Monitor Receive Email Rules
- Enable
- Disable
- Search
For further information, see the next topics.
Email History
Email History allows users to add, edit, delete, and search for alert emails.
Email History - New Alert Email
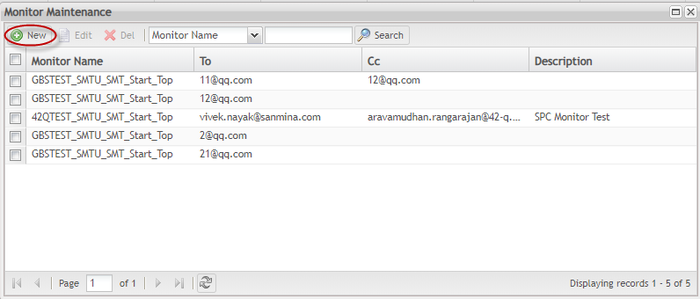
To create a new email alert, in the Monitor Maintenance Page, select the New button.
Figure 131: Email Maintenance - New Alert Email in the List
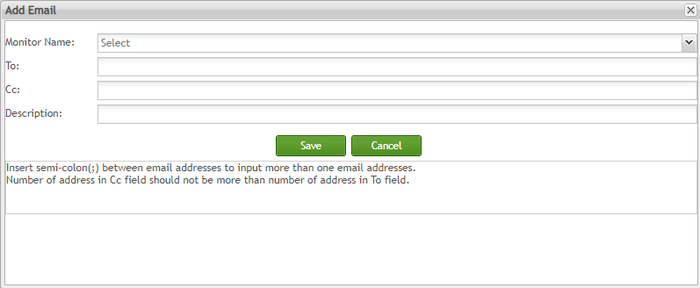
The Add Email page is displayed:
Fill the Add Email page fields;
Figure 132: Add Email in the list
Monitor Name: Select a monitor from the available monitors'drop-down list. All listed available monitors here are created in the current SPC server. The recipients will receive alert emails from the monitor defined here.
To: Input recipients of the alert email here. This field is mandatory.
Cc: Input additional recipients here. This field is optional.
Description: Write more information about the email if necessary. This field is optional.
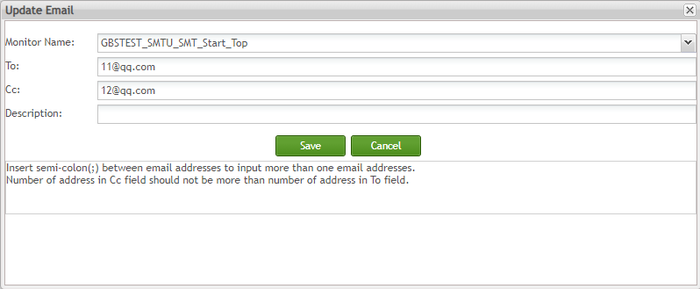
Tip: Users can input more than one email address with a semi-colon(;) between two email addresses. Select Save to save the configuration to SPC.
Search Email
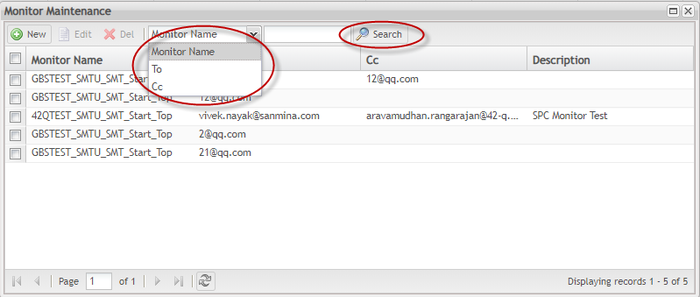
In SPC, users can search existing alert email by keyword:
- Select the kind of keyword in the keyword category drop-down list.
- Enter the keyword in the keyword textbox, and click the
 icon to search.
Figure 133: E-mail List - Search
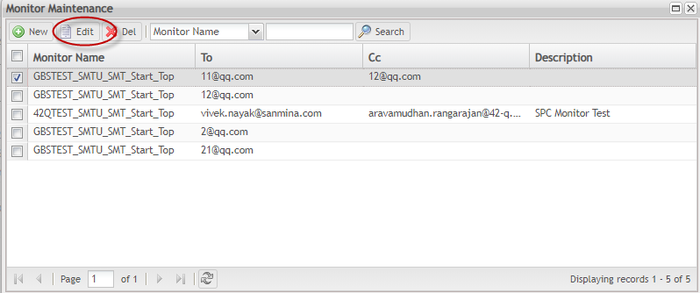
Email Maintenance - Edit Email in the List
To edit an email
Figure 134: E-mail List - Edit
In the UpdateE-mail page, correct values in any of the four fields and save the changes.
Figure 135: Update E-mail
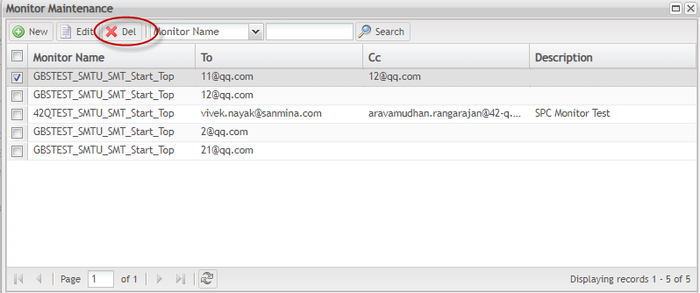
Email Maintenance - Delete Email in the List
To delete an email from the email list
Figure 136: E-mail List - Delete
- Choose Yes to delete the email.
Figure 137: Delete E-mail Confirmation Window
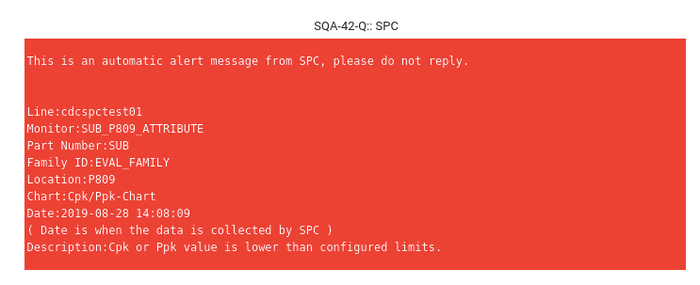
Example of an Alert Email
Alert emails from SPC will contain titles like “Alert message from SPC application’. Here is an example of an SPC alert email, which contains seven information fields (the red background area): Line, Monitor, Part Number, Location, Chart, Date, and Description.
Figure 138: Alert E-mail Example
Email Group Maintenance
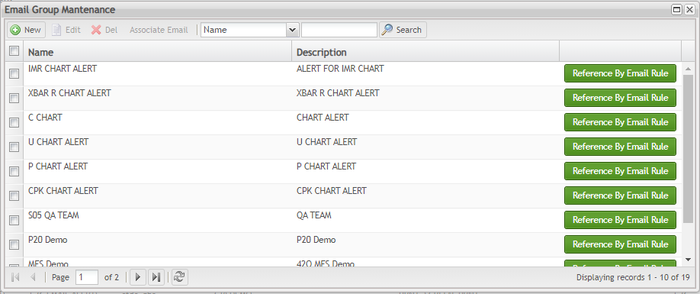
The Email Group Maintenance submodule allows users to add, edit, delete, and search email groups and also, associate emails to groups.
See the next topics for further information.
Figure 139: Email Group Maintenance
Add Email Group
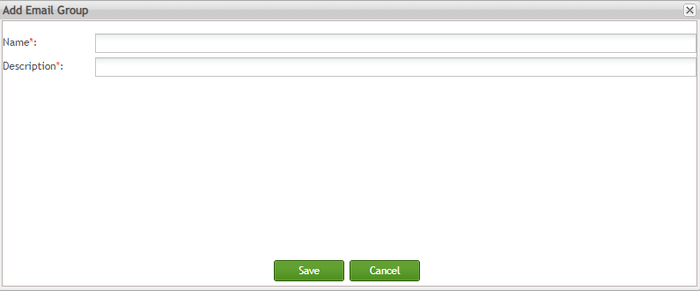
The first thing that the user needs to do is create a User Group with a name and description to create the Receive Emails Rules.
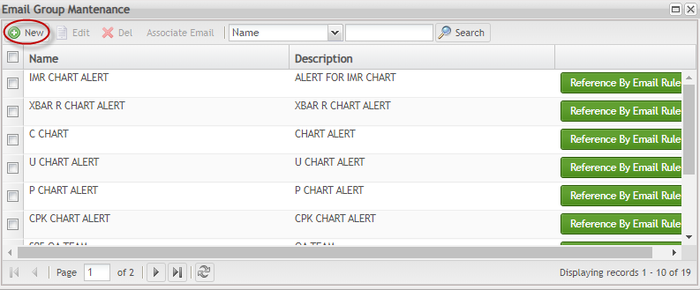
- Click on New button to create an email group;
Figure 140: Email Group Maintenance - New
The Add Email Group page is displayed;
Figure 141: Add Email Group
Enter the Name and Description (mandatory fields) for the new email group; Select the ![]() to save the configuration to SPC.
to save the configuration to SPC.
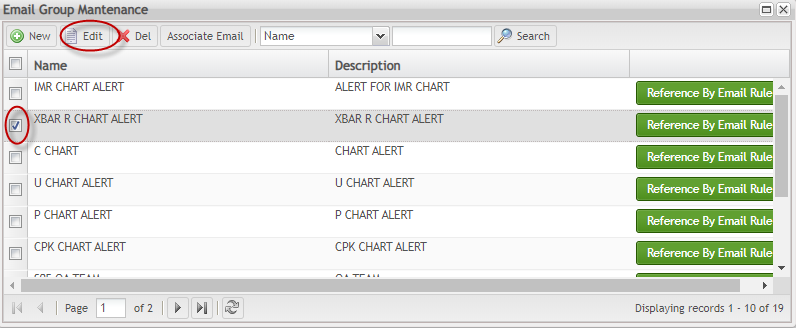
Edit Email Group
To update the email group information:
- Click the Edit button to update the email group information;
Figure 142: Email Group Maintenance - Edit
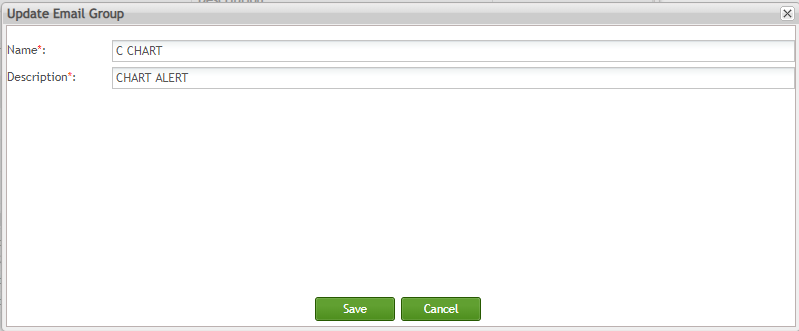
Update Name or Description fields as needed.
Figure 143: Update Email Group
Associate Email
After creating an email grouper, the user is able to associate as many as emails is needed.
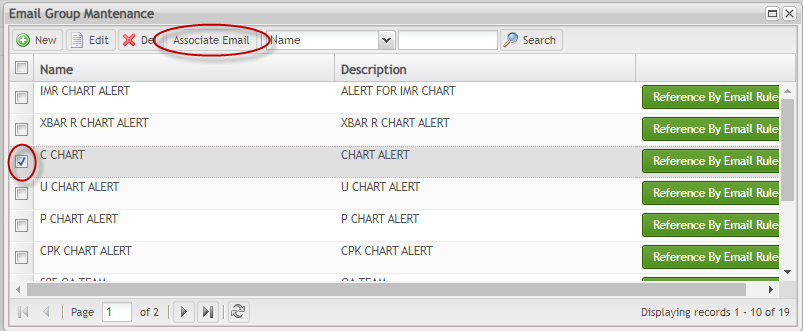
- To associate emails to the group, select a group in the list and click on Associate Email;
Figure 144: Email Group Maintenance - Associate Email
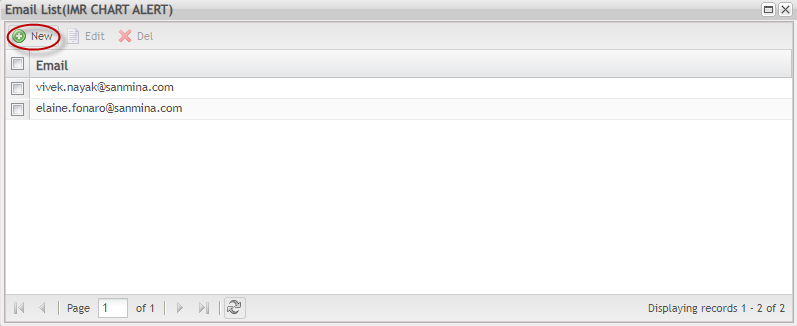
The email list page is displayed and the user can add, edit, or delete emails.
Add Email to Group
To add an email to the group:
- From Email List page, click on New button:
Figure 145: Add New Email to Group
The Add Email page is displayed:
Figure 146: Add Email to Group
Insert the email in the Email field (mandatory) and select the ![]() to save the email to the group.
to save the email to the group.
Edit Email
To edit an email,
- From Email List page, select the email and click the Edit button:
Figure 147: Edit Email
The Update Email page is displayed;
Figure 148: Update Email Page
Update de email as needed and select and select the ![]() to save the updated information.
to save the updated information.
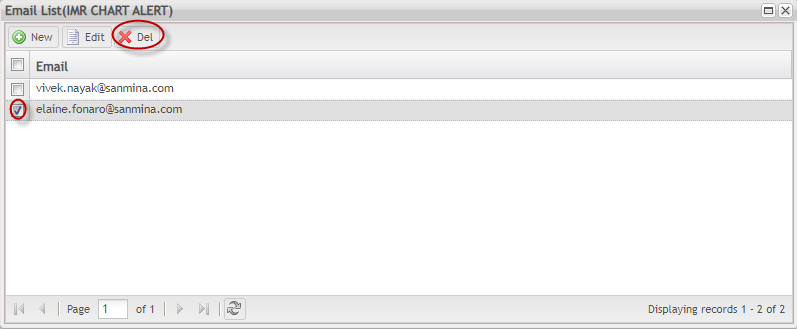
Delete Email
To delete an email from the email list
1. Select the email record and click the ![]() in the toolbar.
in the toolbar.
Figure 149:Delete Email
Select Yes in the pop-up window to confirm the action.
Figure 150:Delete Email Message
Search Email Group
Users can search existing email groups by keyword:
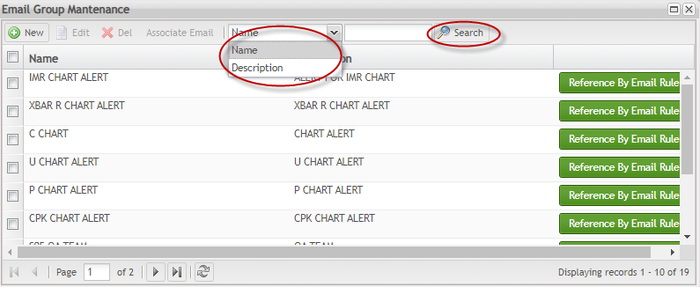
- Select the kind of keyword in the keyword category drop-down list (Name or Description).
- Enter the keyword in the keyword textbox, and click the
 to search.
Figure 151: Email Group Maintenance - Search Email
Delete Email Group
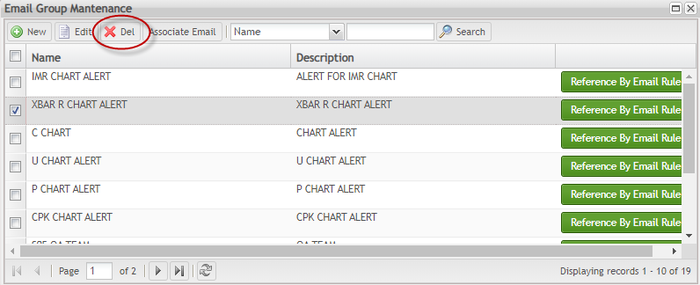
To delete an email group from the email group list
Figure 152: Email Group Maintenance - Delete Email
- Choose Yes to delete the email.
Figure 153: Delete Email Group Message
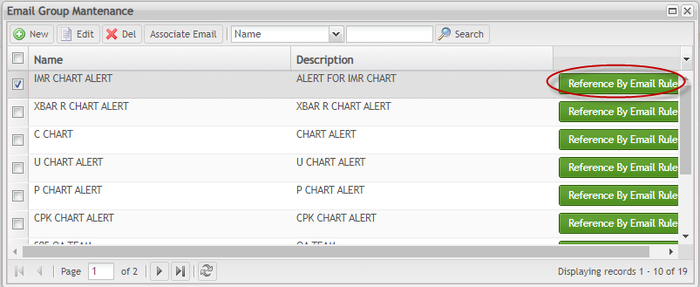
Figure 154: Email Group Maintenance - Tip
Figure 155: Tip Message
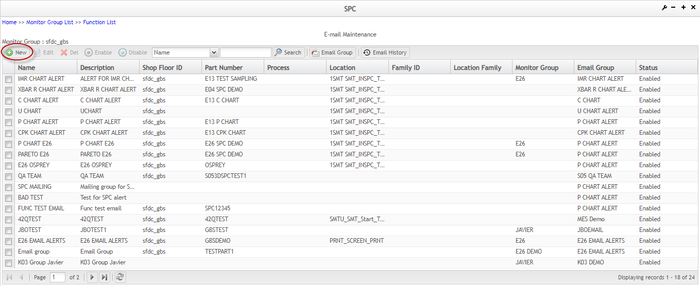
New Email Rule
This functionality allows users to create email rules as needed.
To create a new email Rule, in the Email Maintenance Page, select the New button.
Figure 156: Email Maintenance - New Email Rule
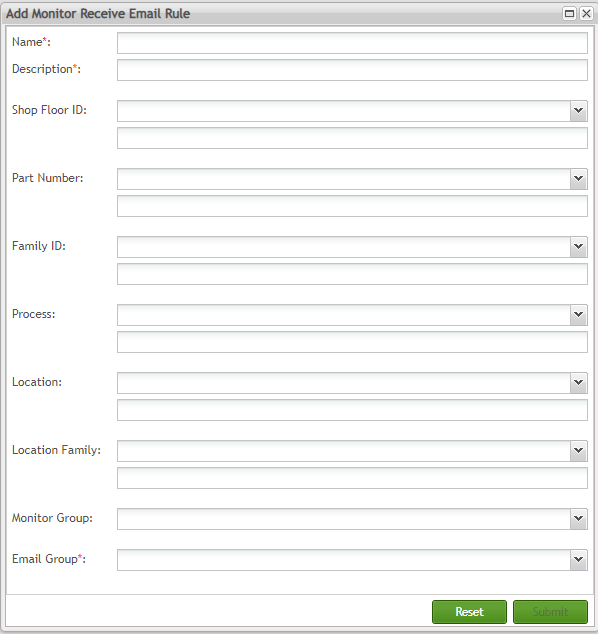
The Add Monitor Receive Email Rule page is displayed:
Figure 157: Email Maintenance - Add Monitor Receive Email Rule
From this page, the user needs to enter the Name, Description, and associate an Email Group (mandatory fields), created in the Email Group functionality.
After this, the rules can be created as needed by: Shop Floor ID, Part Number, Family ID, Process, Location, Family ID, and Monitor Group.
Click on the Submit button to save the information.
Edit Email Rule
This functionality allows users to edit email rules as needed.
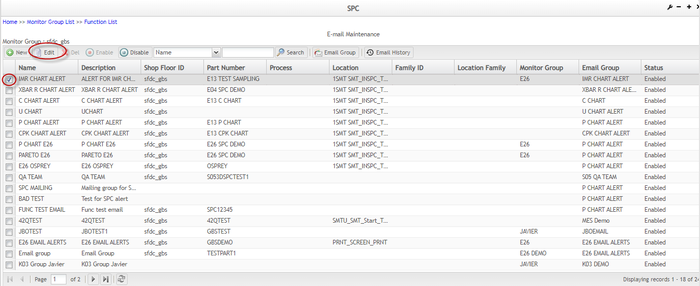
To edit a new email Rule, in the Email Maintenance Page, select the Edit button.
Figure 158: Email Maintenance - Edit Email Rule
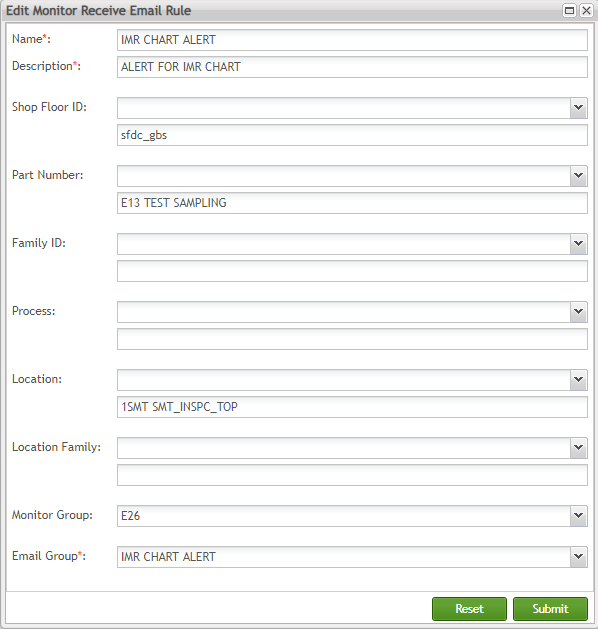
The Edit Monitor Receive Email Rule page is displayed:
Figure 159: Email Maintenance - Edit Monitor Receive Email Rule
Edit the fields as needed and click on Submit to save the information.
Delete Email Rule
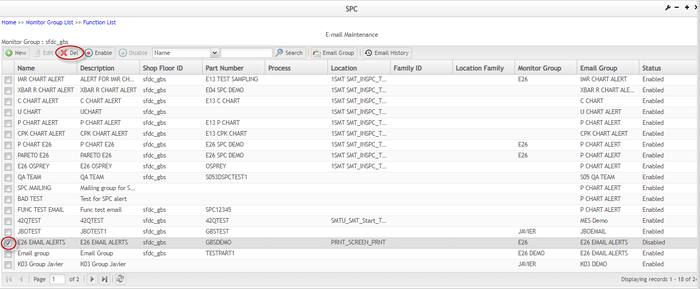
To delete an email Rule from the list
Figure 160: Email Maintenance - Delete Email Rule
Select Yes in the pop-up window to confirm the action.
Figure 161: Email Maintenance - Delete Email Rule Message
Enable Email Rule
Enabling Email Rule restores an email rule record from disabled status. To do this,
Figure 162: Enable Email Rule
Disable Email Rule
To disable an email rule
Select an email rule and click the ![]() in the toolbar.
in the toolbar.
Figure 163: Disable Email Rule
Choose Yes in the pop-up confirm window.
Figure 164: Disable Confirmation Message
Location Family Maintenance
Brief Introduction
The location family is a collection of locations. One location family consists of one or more locations, which can be derived from different processes and departments. The authorized user can create, search, edit, disable, delete, and enable location family.
Create Location Family
To create a new location family
Figure 165: Function List - Location Family Maintenance
Figure 166: Location Family List Page - New Icon
- Select Process, or Department.
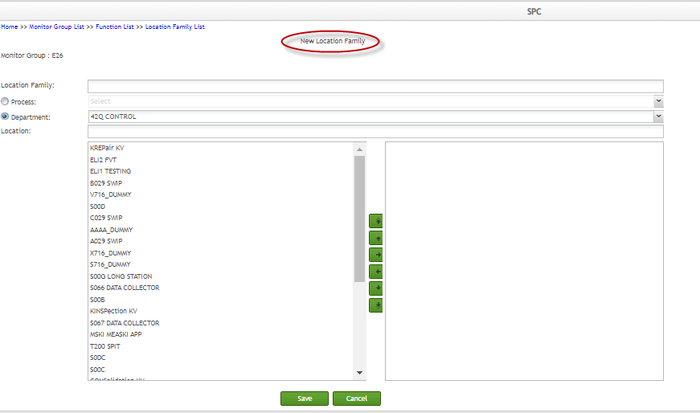
Figure 167: Location Family
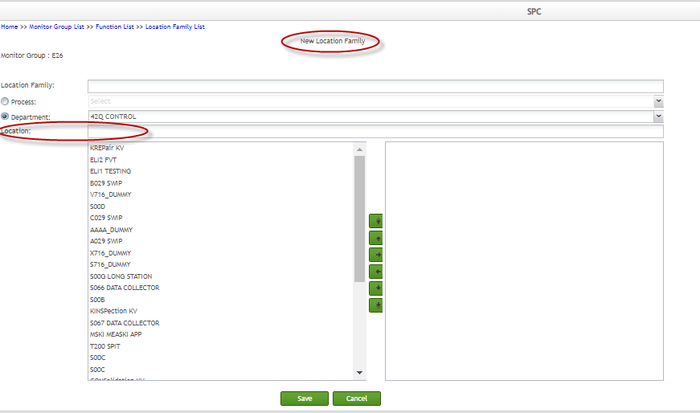
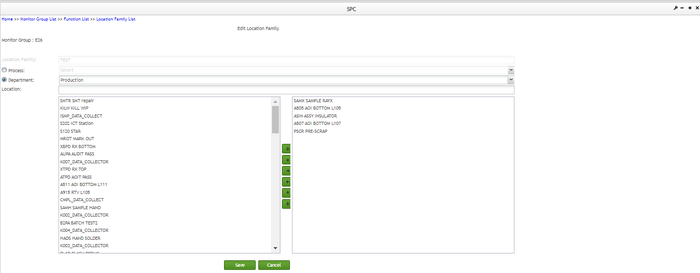
- Enter values in the Location textbox to filter locations. If a user changes values of the Location textbox, its instant search function activates, and the SPC system automatically searches matching locations from the locations that belong to the selected department, displaying matching locations in the Location selection box.
Figure 168: Location Textbox
- Select a location and click the
 button to add locations from the left panel to the right panel. More than one location can be selected at a time.
Figure 169: Add Location
- Lastly, click the Save button to save your data to SPC.
Search Location Family
SPC enables users to search for location family by keyword and status. To search for a location family
- Go to the Location Family List page, select a keyword category (the green frame area in Figure 111), and input a keyword in the text input box (the red frame area in Figure 111).
- Select a location family status (the blue frame area in Figure 111) and click the
 icon.
icon.
Figure 170: Search Location Family
Edit Location Family
To edit a location family
- Select a location family from the list, then click the
 icon in the toolbar. The Edit Location Family page is displayed.
Figure 171: Location Family List - Edit
- On Edit Location Family page, edit any field you want, and save the changes.
Figure 172: Edit Location Family Page
Disable Location Family
To disable a location family
Select a location family and click the ![]() icon in the toolbar.
icon in the toolbar.
Figure 173: Location Family List - Delete
Choose Yes in the pop-up confirm window.
Figure 174: Disable Confirmation Window
Delete Location Family
To delete a location family
- Select the location family and click Disable.
- Search the disabled location family list for the disabled location family, select the location family, and click Delete.
Figure 175: Location Family List - Delete
- Click Yes to confirm the action.
Figure 176: Delete Confirmation Message
Enable Location Family
To enable a location family
Figure 177: Location Family List - Enable
- Choose Yes in the pop-up window.
Figure 178: Enable Confirmation Message
System Log Maintenance
Brief Introduction
Some important system events, such as data modification and stopping a monitor, will be automatically added to SPC system log. System log plays an important role in system security. Users can analyze the system log and decide to take appropriate measures, like data recovery and file backup, to defend the system. In the SPC system, authorized users can search, view, and delete system logs.
Search and View System Log
On the Function List page, users can click the ![]() icon to navigate to the System Log page.
icon to navigate to the System Log page.
Figure 179: Function List - System Log Maintenance
In the System Log page, users can search the system log by time frame or by event owner:
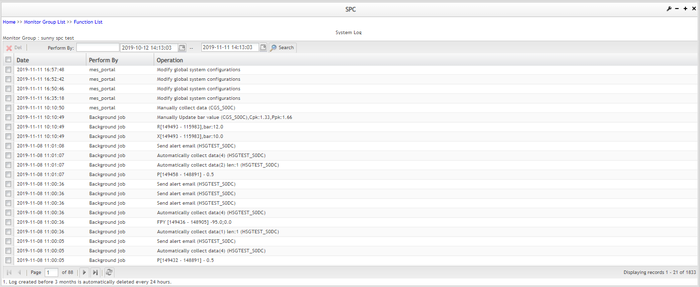
Figure 180: System Log Page
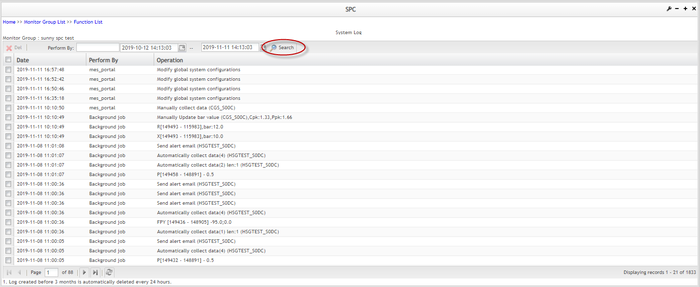
1. Input event owner in the Performed by textbox or choose a time frame and click the ![]() icon in the toolbar.
icon in the toolbar.
Figure 181: System Log - Search
2. System log list table structure contains three columns - Date, Performed By and Operation:
- Date: when did the operation take place
- Performed By: who did the operation, user or system
- Operation: what is the operation
Figure 182: System Log Search Results
Delete System Log
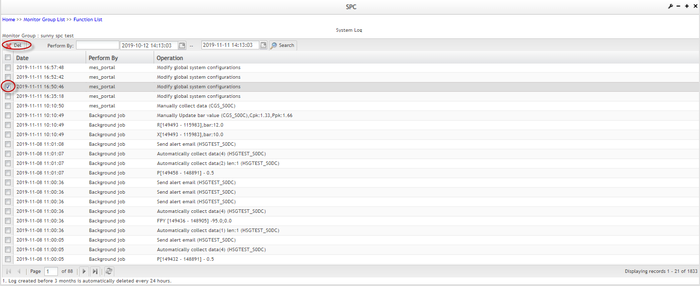
Every 24 hours, SPC automatically deletes system logs created 3 months before. Authorized users can delete logs manually via SPC UI. Users can delete logs individually or in batches.
Figure 183: System Log - Delete
Figure 184: Delete Confirmation Message
SPC System Parameter Maintenance
Brief Introduction
Authorized users are allowed to set general system parameters according to their local plants, manufacturing lines, or other special needs. This part of system parameters configuration affects the performance of the current SPC server, caution is necessary when defining the parameter values.
Maintain SPC System Parameters
Users may access SPC System Parameters Maintenance by selecting the ![]() icon on the Function List page.
icon on the Function List page.
Figure 185: Function List - SPC System Parameter Maintenance
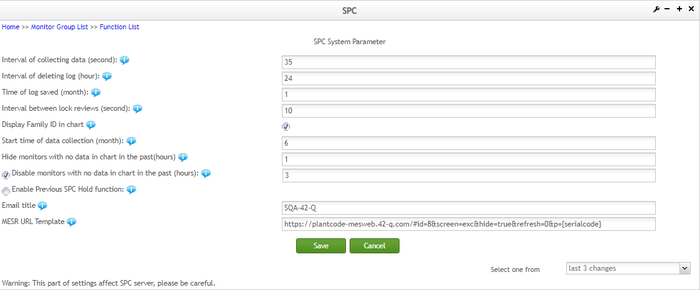
On SPC System Parameter page, eleven fields are displayed and the user can move their mouse over the ![]() icon to learn more information about the labels. See below the fields description:
icon to learn more information about the labels. See below the fields description:
Figure 186: SPC System Parameter Page
An explanation of the fields in the above screenshot follows:
Interval of collecting data (second): During real-time monitoring, each monitor will periodically collect data from SFDC archive database or other data source, the setting determines how often each monitor collects data.
Interval of deleting log (hour): There is one background job (thread) responsible to periodically delete the system log, this setting determines how often the background job deletes some system logs.
Time of log saved (month): System log will not be saved forever, a too old log will be deleted by background job, this setting determines how long the system log is saved in the database.
The interval between lock reviews (second): How often the background job review lock (or called MFG hold request to determine if one waiting lock should be sent to to the SFDC (MES)
Display family ID in chart: selecting this checkbox the Family ID is displayed on SPC chart.
Start time of data collection (month): After one monitor is created, this monitor related data can be retrieved from past time, this setting determines how old data can be when retrieved by monitor. The default value is 3 months.
Hide monitors with no data in chart in the past (hours): It allows users to filter out those monitors that have no new data coming in during the past settable hours. Users can input a positive number between 1 to 168 in the textbox. The default value for this textbox is 24. To view the effect, you can check the Hide Inactive Monitors feature on the Monitor List page.
Disable monitors with no data in chart in the past (hours): If a user enables this checkbox, the SPC will automatically disable those monitors that have no new data during the past settable hours. By default, this checkbox is enabled. The hours' quantity textbox next to it has a default value of 24 (hours). This textbox allows positive integers from 1 to 168.
Enable Previous SPC Hold function: Previous Hold function will be invoked in the following scenario: after a part number was put on SPC Hold by SPC for the settable number of consecutive defect codes within a set time limit, displays ‘PREVIOUS SPC HOLD’ in NetDC rather than issuing an immediate SPC holds.
Note:
- If a monitor is stopped, disabled, or deleted, the Previous Hold function of this monitor will be automatically turned off as well.
- Users must enable the Send MFG hold to SFDC / MDS checkbox in Add Server Information page first, before enabling the Enable Previous SPC Hold function checkbox.
Currently, this function only supports the monitors in which group was defined by SFDC ( see in image 160). If the group defined by MDS, it will not support this function.
Note:
- # of running monitor field was deactivated. It was used to limit the number of monitors running, to avoid too many threads causing the program to freeze. Some plants have requested to create thousands of monitors, and the current system does not support them. However, after the Data Engine enhancement, the retrieval method in SPC was redesigned, solving this issue.
- # of active thread: the #of the active thread is no longer used in SPC System Parameter. After Data engine enhancement. The retrieval method of SPC was redesigned. Each site retains the main thread to calculate all monitors with a delay of fewer than 30 mins, another 5 threads are allocated for calculating monitors with historical data or a delay of more than 30 minutes.
Figure 187: Send MFG Hold Request by SFDC
Users can also restore the system parameters from previous prior configurations. To do this, select the Select one from the last 3 changes drop-down list and select one from the list. The values in the text input boxes will be automatically restored.
Email Title: to set the title of the alarm email.
MESR URL Template: This field is to set a URL link to the MES Web. The URL template is plantcode-mesweb-med.42-q.com or plantcode-mesweb-med-uat.42-q.com. Hence the original HTTP URL template is not suitable as a fixed URL link.
After all, configurations are done, remember to click the ![]() icon. If saving is okay, the user can see the message 'Configurations are successfully saved and will be immediately effective'. If there is a malfunction, users will see the error message 'Configurations are not saved, please try again or contact administrator.'
icon. If saving is okay, the user can see the message 'Configurations are successfully saved and will be immediately effective'. If there is a malfunction, users will see the error message 'Configurations are not saved, please try again or contact administrator.'
Lock Maintenance
Brief Introduction
This functionality allows the user to unlock hold, search lock record by time range and export hold records in one page.
Maintain SPC Lock Maintenance
Users may access SPC Lock Maintenance by selecting the ![]() icon on the Function List page.
icon on the Function List page.
Figure 188: Function List - SPC Lock Maintenance
Users may view lock records and unlock existing locks as well.
View Lock
1. To view lock, from the Monitor List, select a monitor and click the ![]() in the toolbar. The Lock List page displays.
in the toolbar. The Lock List page displays.
Figure 189: Lock Maintenance - Lock List
Function List - SPC System Parameter Maintenance
Beginning with SPC 3.2, the lock mechanism has been modified so that only the Pareto chart can send MFG hold requests to SFDC / MDS. Users can view locks in different status as long as different values are selected in the lock status drop-down list. For example, if a user wants to find locked locks, select LOCKED from the lock status drop-down list, and click the  in the toolbar.
'Figure 190': Lock Search Drop-down
There are four statuses for locks: WAITING, LOCKED, UNLOCKED, and CANCELED. The CANCELED status was added to SPC 3.2.
- WAITING: the lock that is waiting to be sent to MDS / SFDC. When the out-of-control case is detected, SPC will wait some minutes before sending the MFG hold to MDS / SFDC until it reaches the number of minutes defined by Send MFG to hold requests after * minutes field in the Actions section. During this period, the lock is in WAITING status.
- LOCKED: MFG hold has been sent, associated location or process has been locked and OCAP has not been processed.
- UNLOCKED: User input OCAPs to on-hold associated location or process, then the locked lock becomes UNLOCKED.
CANCELED: This lock status is a new status as of SPC 3.2. For a better understanding of this status, consider the following scenario: A SPC monitor was created for Pareto Chart that 3 defect codes of the same type within 10 minutes will trigger the exception, and MFG hold will be sent to SFDC / MDS 5 minutes later. A few minutes later, a first MFG hold was triggered, if a second MFG hold was triggered during the first hold’s delay sending time in the new lock mechanism, the second hold will not be sent to SFDC / MDS, and the status of the second MFG hold is CANCELED.
SPC TV Portlet
Like SPC portlet, SPC TV portlet is another component of the SPC system. SPC TV enables users can view SPC control charts in any combination in one page through some simple configuration so that users can learn the latest status of any line or location in real-time.
Add SPC TV Portlet
After the SPC portlet is installed, click the SPC TV sub-menu on the left side, move the cursor over the Add selection menu on the top left corner, and choose More from the drop-down menu.
Figure 191: SPC TV Add
From the MES menu tree, select SPC, then select TV from the SPC menu tree. Select Add. An SPC TV portlet has been added to the page.
Figure 192: SPC Menu Tree
NOTE: By default, there is only one SPC TV page on the left navigation menu, and only one SPC TV portlet added in the page. Users do not have the permissions to add an SPC TV page or SPC TV portlet. If a user wants to make such an addition they must submit a Work Request and have MES Support team to make the addition.
Set Page Layout
Move the cursor over the Manage selection menu and select the Page Layout sub-menu from the drop-down list.
Figure 193: Manage Menu
In the floating panel, 11 layout templates are available, you can select one and click the Save button to apply the layout to your page. By default, the 2 Columns (30/70) layout template is selected.
Figure 194: Page Layout Menu
Configure Preferences
Users must perform some simple configuration before SPC TV portlet shows SPC control charts properly. Click the ![]() icon from the SPC TV portlet controls bar, and select Preferences from the drop-down menu.
icon from the SPC TV portlet controls bar, and select Preferences from the drop-down menu.
Figure 195: SPC TV - Preferences
Select available a server, monitor, and chart from each drop-down selection box. Complete the remaining parameters and click Save.
Figure 196: Preferences Page
Some of the fields are explained as follow:
Select SPC Server: the SPC server that has been defined in the Server Information portlet
Monitor Group: Currently SPC monitors are grouped into two categories according to the data source: MDS and SPI. You can select a monitor group name here.
Monitor: the monitor that you've created under the selected monitor group in SPC portlet
Chart: the control charts that you've configured in the selected monitor. Please note that the Pareto chart and Yield chart will not be displayed in this field even if you've configured them in SPC monitor
Number of point: the maximum points that will show on the selected chart
Refresh(min): every xx minutes SPC TV will refresh for new data
Display counter: whether or not shows the countdown timer on SPC TV portlet (on top right corner)
Size: the size of SPC TV portlet, you can either select a fixed size or define your own size
Tip: For details about how to get the best display effect under different screen resolutions, you can refer to SPC TV Configuration Guide
Exceptional Icons
- If there is no setting for the SPC TV portlet, it displays a gear icon
- If there is no data, SPC TV portlet displays a question mark icon
- If the connection times out, SPC TV portlet displays an exclamation mark icon
Roles & Permissions
| Roles→ Permissions↓ |
SPC_Corp_Support | SPC_Plant_Admin | SPC_Plant_Manager | SPC_Plant_User | *SPC_Plant_Operator |
|---|---|---|---|---|---|
| SPC | |||||
| Add/Edit/Delete Monitor | |||||
| Start/Stop Monitor | |||||
| Disable/Enable Monitor | |||||
| Add/Edit/Delete Monitor Group | |||||
| Input/Edit Data | |||||
| Add/Edit/Delete Email | |||||
| Delete Log | |||||
| Edit OCAP | |||||
| Disable/Enable Data | |||||
| Add/Edit/Delete Location Family | |||||
| Disable/Enable Location Family | |||||
| Edit System Configuration/Global System Configuration | |||||
| Unlock | |||||
| View | |||||
| Add to Page | |||||
| Configuration | |||||
| SPC Server Information | |||||
| Add/Edit/Delete Server | |||||
| View | |||||
| Add to Page | |||||
| Configuration |
Notification:
- ‘SPC_Plant_Operator’ is for plant E68 only.
Glossary
1. MFG hold: MFG hold is short for manufacturing hold. SPC sends MFG hold to MDS or SFDC to stop the manufacturing line. It is another action SPC can take when a point is out of control limit.
2. MDS: Short for Manufacturing Data System.
3. SFDC: The SFDC (Shop Floor Data Collection) System is the main software/hardware system used by 42Q for production control and the collection of manufacturing data.
4. Exception: SPC considers some out-of-control caA valid group here means the group oses as an exception based on the rules you selected when configuring monitor parameters.
5. Valid group: It means the data that is in the normal scope. On SPC control charts, a valid group of data points is plotted between the UCL and LCL.
6. DPMO: Short for Defects Per Million of Opportunities.
7. OCAP: Short for Out of Control Action Plan.
8. Ext JS: Ext JS JavaScript Framework. Ext JS is a pure JavaScript application framework for building interactive web applications using techniques such as Ajax, DHTML and DOM scripting.
Document Revision History
| Date | Author | Title | Version | Change Reference | Approved by |
|---|---|---|---|---|---|
| 02/01/2014 | Elton Wang | Technical Writer | v 1.0 | Initial Release. | |
| 04/28/2016 | Dane Parker | Technical Writer | v 1.0 | Formatted to 42Q. | |
| 04/02/2018 | Elaine Fonaro | Technical Writer | v 1.0 | Applied new Template for the format. | |
| 09/13/2019 | Elaine Fonaro | Technical Writer | v 2.0 |
- Added an Email title configuration to set the title of the alarm email; - Added a MESR URL Template to set URL link to MESWEB; |
|
| 11/11/2019 | Elaine Fonaro | Technical Writer | v 2.0 |
- Updated Functionalities and the majority of images; -Added Lock Functionality; - Added Email Maintenance Functionality; - Removed SPC System Parameter Maintenance Icon. This the feature has been merged; |
Sunny Xiong |
| 12/27/2019 | Elaine Fonaro | Technical Writer | v 1.2.22 |
- Number of running monitor field was deactivated and removed from the SPC System Parameter page. - Updated images 83, 84, 85, 86, 88 and 94; - Added new description for Function List - SPC System Parameter Maintenance; |
Sunny Xiong |
| 03/27/2020 | Elaine Fonaro | Technical Writer | v. 1.2.23 |
1. Add Dot Line Chart in SPC 2. Support create and edit monitors in batch 3. Continuous charts support sampling(Current SPC only supports full inspection) 4. Monitor list enhancement 5. Grouping function enhancement in SPC 6. P chart enhancement |
Sunny Xiong |
| 07/01/2020 | Elaine Fonaro | Technical Writer | v1.2.28 |
1. Improved attribute group rules for creating monitors with attributes 2.SPC multi instances redesign 3.SPC System Parameter enhancement 4. Remove# of active thread from SPC System Parameter Page |
Sunny Xiong |
| 30/10/2020 | Marisol Vargas | Technical Writer | v1.2.28 | Peer review, structure revision, replaced Figures 5, 8 and 69 | Sunny Xiong |


