Difference between revisions of "SOP-42Q-MES0055 MESWeb Reports"
| (465 intermediate revisions by 7 users not shown) | |||
| Line 1: | Line 1: | ||
| − | <small>[[42Q_Cloud-Based_MES/MOMS|42Q Home]] > [[Reporting|Reporting]] > MESWeb Reports</small><br/> | + | <small>[[42Q_Cloud-Based_MES/MOMS|42Q Home]] > [[Reporting|Reporting]] > MESWeb Reports</small><br/> |
<br/> | <br/> | ||
| | ||
| − | <center>'''Reporting'''</center> <center>'''MESWeb Execution'''</center> <center>'''Version | + | <center>'''Reporting'''</center> <center>'''MESWeb Execution / Reports'''</center> <center>'''Version MES 15.82'''</center> <center>'''Revision S1'''</center> <center> </center> |
| − | + | | |
| + | | ||
| − | + | | |
| − | |||
| − | |||
| − | |||
| − | |||
| − | + | = <span class="mw-headline" id="Introduction"><span class="mw-headline" id="Introduction"><span class="mw-headline" id="Introduction"><span class="mw-headline" id="Introduction"><span class="mw-headline" id="Introduction"><span class="mw-headline" id="Introduction">Introduction</span></span></span></span></span></span> = | |
| − | MESWeb | + | '''MESWeb '''is a powerful business intelligence application designed from the ground up to enable and simplify reporting from 42Q’s manufacturing execution systems and empower end-users with a streamlined and full-featured web interface. The application includes an '''ad hoc '''report design tool that allows users to create customized reports from heterogeneous data sources. |
| − | + | '''MESWeb''' provides access to information through a real-time replication reporting database to avoid negatively impacting the production system performance. In its standard configuration, here are some of the reports based on data tracked via MES101: | |
| − | |||
| − | |||
| − | |||
| − | |||
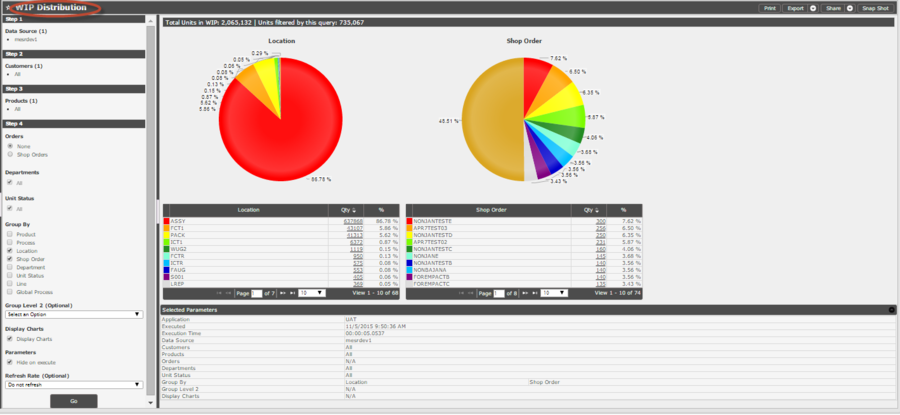
| − | + | *'''Work in Progress (WIP Distribution)''' | |
| + | *'''Yield, Defect, and Repair Analysis''' | ||
| + | *'''Serial Number historical details (Unit History)''' | ||
| + | *'''Evolution Reports (including moving averages) – Top Defect Evolution and Yield Evolution''' | ||
| + | *'''Throughput information''' | ||
| − | + | These reports can filter and search the data per common attribute, such as Customer, Part Number, Process, Date and Time range, Shifts, Evolution Intervals, etc. These default reports provide a significant level of visibility to manufacturing processes. | |
| − | MESWeb | + | MESWeb can be used along with several RDBMS (relational database management systems) and drivers: |
| − | *ERP | + | *'''ERP''' |
| − | * | + | *'''PostgreSQL''' |
| − | *MySQL | + | *'''MySQL''' |
| − | * | + | *'''MSSQL Server''' |
| − | *ODBC | + | *'''ODBC''' |
| − | == <span class="mw-headline" id="Access_Level"><span class="mw-headline" id="Access_Level"><span class="mw-headline" id="Access_Level"><span class="mw-headline" id="Access_Level"><span class="mw-headline" id="Access_Level"><span class="mw-headline" id="Access_Level"><span class="mw-headline" id="Access_Level">Access Level</span></span></span></span></span></span></span> | + | = <span class="mw-headline" id="Access_Level"><span class="mw-headline" id="Access_Level"><span class="mw-headline" id="Access_Level"><span class="mw-headline" id="Access_Level"><span class="mw-headline" id="Access_Level"><span class="mw-headline" id="Access_Level"><span class="mw-headline" id="Access_Level"><span class="mw-headline" id="Access_Level"><span class="mw-headline" id="Access_Level"><span class="mw-headline" id="Access_Level"><span class="mw-headline" id="Access_Level"><span class="mw-headline" id="Access_Level"><span class="mw-headline" id="Access_Level"><span class="mw-headline" id="Access_Level"><span class="mw-headline" id="Access_Level"><span class="mw-headline" id="Access_Level"><span class="mw-headline" id="Access_Level"><span class="mw-headline" id="Access_Level"><span class="mw-headline" id="Access_Level"><span class="mw-headline" id="Access_Level"><span class="mw-headline" id="Access_Level"><span class="mw-headline" id="Access_Level"><span class="mw-headline" id="Access_Level"><span class="mw-headline" id="Access_Level"><span class="mw-headline" id="Access_Level"><span class="mw-headline" id="Access_Level"><span class="mw-headline" id="Access_Level"><span class="mw-headline" id="Access_Level"><span class="mw-headline" id="Access_Level"><span class="mw-headline" id="Access_Level"><span class="mw-headline" id="Access_Level"><span class="mw-headline" id="Access_Level"><span class="mw-headline" id="Access_Level"><span class="mw-headline" id="Access_Level"><span class="mw-headline" id="Access_Level"><span class="mw-headline" id="Access_Level"><span class="mw-headline" id="Access_Level"><span class="mw-headline" id="Access_Level"><span class="mw-headline" id="Access_Level"><span class="mw-headline" id="Access_Level"><span class="mw-headline" id="Access_Level"><span class="mw-headline" id="Access_Level"><span class="mw-headline" id="Access_Level"><span class="mw-headline" id="Access_Level"><span class="mw-headline" id="Access_Level"><span class="mw-headline" id="Access_Level"><span class="mw-headline" id="Access_Level"><span class="mw-headline" id="Access_Level"><span class="mw-headline" id="Access_Level"><span class="mw-headline" id="Access_Level"><span class="mw-headline" id="Access_Level"><span class="mw-headline" id="Access_Level"><span class="mw-headline" id="Access_Level"><span class="mw-headline" id="Access_Level"><span class="mw-headline" id="Access_Level"><span class="mw-headline" id="Access_Level"><span class="mw-headline" id="Access_Level"><span class="mw-headline" id="Access_Level"><span class="mw-headline" id="Access_Level"><span class="mw-headline" id="Access_Level"><span class="mw-headline" id="Access_Level"><span class="mw-headline" id="Access_Level"><span class="mw-headline" id="Access_Level"><span class="mw-headline" id="Access_Level"><span class="mw-headline" id="Access_Level"><span class="mw-headline" id="Access_Level"><span class="mw-headline" id="Access_Level"><span class="mw-headline" id="Access_Level"><span class="mw-headline" id="Access_Level"><span class="mw-headline" id="Access_Level"><span class="mw-headline" id="Access_Level"><span class="mw-headline" id="Access_Level"><span class="mw-headline" id="Access_Level"><span class="mw-headline" id="Access_Level"><span class="mw-headline" id="Access_Level">Access Level</span></span></span></span></span></span></span></span></span></span></span></span></span></span></span></span></span></span></span></span></span></span></span></span></span></span></span></span></span></span></span></span></span></span></span></span></span></span></span></span></span></span></span></span></span></span></span></span></span></span></span></span></span></span></span></span></span></span></span></span></span></span></span></span></span></span></span></span></span></span></span></span></span></span></span> = |
MESWeb has five distinct access levels: | MESWeb has five distinct access levels: | ||
| − | + | == <span class="mw-headline" id="Administrator_.28System_Administrator.29"><span class="mw-headline" id="Administrator_.28System_Administrator.29"><span class="mw-headline" id="Administrator_.28System_Administrator.29"><span class="mw-headline" id="Administrator_.28System_Administrator.29"><span class="mw-headline" id="Administrator_.28System_Administrator.29"><span class="mw-headline" id="1._Administrator_.28System_Administrator.29"><span class="mw-headline" id="Administrator_.28System_Administrator.29"><span class="mw-headline" id="Administrator_.28System_Administrator.29"><span class="mw-headline" id="Administrator_.28System_Administrator.29"><span class="mw-headline" id="Administrator_.28System_Administrator.29"><span class="mw-headline" id="Administrator_.28System_Administrator.29"><span class="mw-headline" id="Administrator_.28System_Administrator.29"><span class="mw-headline" id="Administrator_.28System_Administrator.29"><span class="mw-headline" id="Administrator_.28System_Administrator.29"><span class="mw-headline" id="Administrator_.28System_Administrator.29"><span class="mw-headline" id="Administrator_.28System_Administrator.29"><span class="mw-headline" id="Administrator_.28System_Administrator.29"><span class="mw-headline" id="Administrator_.28System_Administrator.29"><span class="mw-headline" id="Administrator_.28System_Administrator.29"><span class="mw-headline" id="Administrator_.28System_Administrator.29"><span class="mw-headline" id="Administrator_.28System_Administrator.29"><span class="mw-headline" id="Administrator_.28System_Administrator.29"><span class="mw-headline" id="Administrator_.28System_Administrator.29"><span class="mw-headline" id="Administrator_.28System_Administrator.29"><span class="mw-headline" id="Administrator_.28System_Administrator.29"><span class="mw-headline" id="Administrator_.28System_Administrator.29"><span class="mw-headline" id="Administrator_.28System_Administrator.29"><span class="mw-headline" id="Administrator_.28System_Administrator.29"><span class="mw-headline" id="Administrator_.28System_Administrator.29"><span class="mw-headline" id="Administrator_.28System_Administrator.29"><span class="mw-headline" id="Administrator_.28System_Administrator.29"><span class="mw-headline" id="Administrator_.28System_Administrator.29"><span class="mw-headline" id="Administrator_.28System_Administrator.29"><span class="mw-headline" id="Administrator_.28System_Administrator.29"><span class="mw-headline" id="Administrator_.28System_Administrator.29"><span class="mw-headline" id="Administrator_.28System_Administrator.29"><span class="mw-headline" id="Administrator_.28System_Administrator.29"><span class="mw-headline" id="Administrator_.28System_Administrator.29"><span class="mw-headline" id="Administrator_.28System_Administrator.29"><span class="mw-headline" id="Administrator_.28System_Administrator.29"><span class="mw-headline" id="Administrator_.28System_Administrator.29"><span class="mw-headline" id="Administrator_.28System_Administrator.29"><span class="mw-headline" id="Administrator_.28System_Administrator.29"><span class="mw-headline" id="Administrator_.28System_Administrator.29"><span class="mw-headline" id="Administrator_.28System_Administrator.29"><span class="mw-headline" id="Administrator_.28System_Administrator.29"><span class="mw-headline" id="Administrator_.28System_Administrator.29"><span class="mw-headline" id="Administrator_.28System_Administrator.29"><span class="mw-headline" id="Administrator_.28System_Administrator.29"><span class="mw-headline" id="Administrator_.28System_Administrator.29"><span class="mw-headline" id="Administrator_.28System_Administrator.29"><span class="mw-headline" id="Administrator_.28System_Administrator.29"><span class="mw-headline" id="1-_Administrator_.28System_Administrator.29"><span class="mw-headline" id="Administrator_.28System_Administrator.29"><span class="mw-headline" id="Administrator_.28System_Administrator.29"><span class="mw-headline" id="Administrator_.28System_Administrator.29"><span class="mw-headline" id="Administrator_.28System_Administrator.29"><span class="mw-headline" id="Administrator_.28System_Administrator.29"><span class="mw-headline" id="Administrator_.28System_Administrator.29"><span class="mw-headline" id="Administrator_.28System_Administrator.29"><span class="mw-headline" id="Administrator_.28System_Administrator.29"><span class="mw-headline" id="Administrator_.28System_Administrator.29"><span class="mw-headline" id="Administrator_.28System_Administrator.29"><span class="mw-headline" id="Administrator_.28System_Administrator.29">Administrator (System Administrator)</span></span></span></span></span></span></span></span></span></span></span></span></span></span></span></span></span></span></span></span></span></span></span></span></span></span></span></span></span></span></span></span></span></span></span></span></span></span></span></span></span></span></span></span></span></span></span></span></span></span></span></span></span></span></span></span></span></span></span></span></span></span></span></span> == | |
| − | |||
| − | |||
| − | |||
| − | |||
| − | + | The System Administrator has full access to MESWeb Central and Execution – all plants, all reports, and all customers. Basically, Administrator access includes the capabilities of all of the levels (Security Manager, Report Manager, and Data Source Manager). This access will be given to BSAs and global support personnel. | |
| − | + | An administrator can perform the following functions: | |
*Access the "Access Control" module | *Access the "Access Control" module | ||
| Line 60: | Line 53: | ||
*Manage permissions for all MESWeb locations | *Manage permissions for all MESWeb locations | ||
| − | + | | |
| − | The Security Manager has full access to the plant(s) where he/she has been designated as local Administrator for the MESWeb tool. The main responsibilities of this role are to organize permissions and manage customers. A Security Manager is able to: | + | |
| + | |||
| + | == <span class="mw-headline" id="Security_Manager_.28Local_Administrator.29"><span class="mw-headline" id="Security_Manager_.28Local_Administrator.29"><span class="mw-headline" id="Security_Manager_.28Local_Administrator.29"><span class="mw-headline" id="Security_Manager_.28Local_Administrator.29"><span class="mw-headline" id="Security_Manager_.28Local_Administrator.29"><span class="mw-headline" id="Security_Manager_.28Local_Administrator.29"><span class="mw-headline" id="Security_Manager_.28Local_Administrator.29"><span class="mw-headline" id="2._Security_Manager_.28Local_Administrator.29"><span class="mw-headline" id="Security_Manager_.28Local_Administrator.29"><span class="mw-headline" id="Security_Manager_.28Local_Administrator.29"><span class="mw-headline" id="Security_Manager_.28Local_Administrator.29"><span class="mw-headline" id="Security_Manager_.28Local_Administrator.29"><span class="mw-headline" id="Security_Manager_.28Local_Administrator.29"><span class="mw-headline" id="Security_Manager_.28Local_Administrator.29"><span class="mw-headline" id="Security_Manager_.28Local_Administrator.29"><span class="mw-headline" id="Security_Manager_.28Local_Administrator.29"><span class="mw-headline" id="Security_Manager_.28Local_Administrator.29"><span class="mw-headline" id="Security_Manager_.28Local_Administrator.29"><span class="mw-headline" id="Security_Manager_.28Local_Administrator.29"><span class="mw-headline" id="Security_Manager_.28Local_Administrator.29"><span class="mw-headline" id="Security_Manager_.28Local_Administrator.29"><span class="mw-headline" id="Security_Manager_.28Local_Administrator.29"><span class="mw-headline" id="Security_Manager_.28Local_Administrator.29"><span class="mw-headline" id="Security_Manager_.28Local_Administrator.29"><span class="mw-headline" id="Security_Manager_.28Local_Administrator.29"><span class="mw-headline" id="Security_Manager_.28Local_Administrator.29"><span class="mw-headline" id="Security_Manager_.28Local_Administrator.29"><span class="mw-headline" id="Security_Manager_.28Local_Administrator.29"><span class="mw-headline" id="Security_Manager_.28Local_Administrator.29"><span class="mw-headline" id="Security_Manager_.28Local_Administrator.29"><span class="mw-headline" id="Security_Manager_.28Local_Administrator.29"><span class="mw-headline" id="Security_Manager_.28Local_Administrator.29"><span class="mw-headline" id="Security_Manager_.28Local_Administrator.29"><span class="mw-headline" id="Security_Manager_.28Local_Administrator.29"><span class="mw-headline" id="Security_Manager_.28Local_Administrator.29"><span class="mw-headline" id="Security_Manager_.28Local_Administrator.29"><span class="mw-headline" id="Security_Manager_.28Local_Administrator.29"><span class="mw-headline" id="Security_Manager_.28Local_Administrator.29"><span class="mw-headline" id="Security_Manager_.28Local_Administrator.29"><span class="mw-headline" id="Security_Manager_.28Local_Administrator.29"><span class="mw-headline" id="Security_Manager_.28Local_Administrator.29"><span class="mw-headline" id="Security_Manager_.28Local_Administrator.29"><span class="mw-headline" id="Security_Manager_.28Local_Administrator.29"><span class="mw-headline" id="Security_Manager_.28Local_Administrator.29"><span class="mw-headline" id="Security_Manager_.28Local_Administrator.29"><span class="mw-headline" id="Security_Manager_.28Local_Administrator.29"><span class="mw-headline" id="Security_Manager_.28Local_Administrator.29"><span class="mw-headline" id="Security_Manager_.28Local_Administrator.29"><span class="mw-headline" id="Security_Manager_.28Local_Administrator.29"><span class="mw-headline" id="Security_Manager_.28Local_Administrator.29"><span class="mw-headline" id="Security_Manager_.28Local_Administrator.29"><span class="mw-headline" id="Security_Manager_.28Local_Administrator.29"><span class="mw-headline" id="Security_Manager_.28Local_Administrator.29"><span class="mw-headline" id="Security_Manager_.28Local_Administrator.29"><span class="mw-headline" id="Security_Manager_.28Local_Administrator.29"><span class="mw-headline" id="Security_Manager_.28Local_Administrator.29"><span class="mw-headline" id="Security_Manager_.28Local_Administrator.29"><span class="mw-headline" id="Security_Manager_.28Local_Administrator.29"><span class="mw-headline" id="Security_Manager_.28Local_Administrator.29"><span class="mw-headline" id="Security_Manager_.28Local_Administrator.29"><span class="mw-headline" id="Security_Manager_.28Local_Administrator.29"><span class="mw-headline" id="Security_Manager_.28Local_Administrator.29"><span class="mw-headline" id="Security_Manager_.28Local_Administrator.29"><span class="mw-headline" id="Security_Manager_.28Local_Administrator.29"><span class="mw-headline" id="Security_Manager_.28Local_Administrator.29"><span class="mw-headline" id="Security_Manager_.28Local_Administrator.29"><span class="mw-headline" id="Security_Manager_.28Local_Administrator.29"><span class="mw-headline" id="Security_Manager_.28Local_Administrator.29"><span class="mw-headline" id="Security_Manager_.28Local_Administrator.29"><span class="mw-headline" id="Security_Manager_.28Local_Administrator.29"><span class="mw-headline" id="Security_Manager_.28Local_Administrator.29"><span class="mw-headline" id="Security_Manager_.28Local_Administrator.29"><span class="mw-headline" id="Security_Manager_.28Local_Administrator.29"><span class="mw-headline" id="Security_Manager_.28Local_Administrator.29"><span class="mw-headline" id="Security_Manager_.28Local_Administrator.29"><span class="mw-headline" id="Security_Manager_.28Local_Administrator.29"><span class="mw-headline" id="Security_Manager_.28Local_Administrator.29"><span class="mw-headline" id="Security_Manager_.28Local_Administrator.29">Security Manager (Local Administrator)</span></span></span></span></span></span></span></span></span></span></span></span></span></span></span></span></span></span></span></span></span></span></span></span></span></span></span></span></span></span></span></span></span></span></span></span></span></span></span></span></span></span></span></span></span></span></span></span></span></span></span></span></span></span></span></span></span></span></span></span></span></span></span></span></span></span></span></span></span></span></span></span></span></span></span></span></span></span> == | ||
| + | |||
| + | The Security Manager has full access to the plant(s) where he/she has been designated as the local Administrator for the MESWeb tool. The main responsibilities of this role are to organize permissions and manage customers. A Security Manager is able to: | ||
*Visualize the Central MESWeb module in the MES Portal | *Visualize the Central MESWeb module in the MES Portal | ||
*Access the "Access Control" module | *Access the "Access Control" module | ||
| − | *Grant permissions to | + | *Grant permissions to his/herself and others from the Security Manager level to all lower levels |
*Manage customers (add customers and map part numbers to them) | *Manage customers (add customers and map part numbers to them) | ||
| − | === <span class="mw-headline" id="Report_Manager"><span class="mw-headline" id="Report_Manager"><span class="mw-headline" id="Report_Manager"><span class="mw-headline" id="Report_Manager"><span class="mw-headline" id="Report_Manager"><span class="mw-headline" id="Report_Manager"><span class="mw-headline" id="Report_Manager">Report Manager</span></span></span></span></span></span></span> | + | == <span class="mw-headline" id="Report_Manager"><span class="mw-headline" id="Report_Manager"><span class="mw-headline" id="Report_Manager"><span class="mw-headline" id="Report_Manager"><span class="mw-headline" id="Report_Manager"><span class="mw-headline" id="Report_Manager"><span class="mw-headline" id="Report_Manager"><span class="mw-headline" id="3._Report_Manager"><span class="mw-headline" id="Report_Manager"><span class="mw-headline" id="Report_Manager"><span class="mw-headline" id="Report_Manager"><span class="mw-headline" id="Report_Manager"><span class="mw-headline" id="Report_Manager"><span class="mw-headline" id="Report_Manager"><span class="mw-headline" id="Report_Manager"><span class="mw-headline" id="Report_Manager"><span class="mw-headline" id="Report_Manager"><span class="mw-headline" id="Report_Manager"><span class="mw-headline" id="Report_Manager"><span class="mw-headline" id="Report_Manager"><span class="mw-headline" id="Report_Manager"><span class="mw-headline" id="Report_Manager"><span class="mw-headline" id="Report_Manager"><span class="mw-headline" id="Report_Manager"><span class="mw-headline" id="Report_Manager"><span class="mw-headline" id="Report_Manager"><span class="mw-headline" id="Report_Manager"><span class="mw-headline" id="Report_Manager"><span class="mw-headline" id="Report_Manager"><span class="mw-headline" id="Report_Manager"><span class="mw-headline" id="Report_Manager"><span class="mw-headline" id="Report_Manager"><span class="mw-headline" id="Report_Manager"><span class="mw-headline" id="Report_Manager"><span class="mw-headline" id="Report_Manager"><span class="mw-headline" id="Report_Manager"><span class="mw-headline" id="Report_Manager"><span class="mw-headline" id="Report_Manager"><span class="mw-headline" id="Report_Manager"><span class="mw-headline" id="Report_Manager"><span class="mw-headline" id="Report_Manager"><span class="mw-headline" id="Report_Manager"><span class="mw-headline" id="Report_Manager"><span class="mw-headline" id="Report_Manager"><span class="mw-headline" id="Report_Manager"><span class="mw-headline" id="Report_Manager"><span class="mw-headline" id="Report_Manager"><span class="mw-headline" id="Report_Manager"><span class="mw-headline" id="Report_Manager"><span class="mw-headline" id="Report_Manager"><span class="mw-headline" id="Report_Manager"><span class="mw-headline" id="Report_Manager"><span class="mw-headline" id="Report_Manager"><span class="mw-headline" id="Report_Manager"><span class="mw-headline" id="Report_Manager"><span class="mw-headline" id="Report_Manager"><span class="mw-headline" id="Report_Manager"><span class="mw-headline" id="Report_Manager"><span class="mw-headline" id="Report_Manager"><span class="mw-headline" id="Report_Manager"><span class="mw-headline" id="Report_Manager"><span class="mw-headline" id="Report_Manager"><span class="mw-headline" id="Report_Manager"><span class="mw-headline" id="Report_Manager"><span class="mw-headline" id="Report_Manager"><span class="mw-headline" id="Report_Manager"><span class="mw-headline" id="Report_Manager"><span class="mw-headline" id="Report_Manager"><span class="mw-headline" id="Report_Manager"><span class="mw-headline" id="Report_Manager"><span class="mw-headline" id="Report_Manager"><span class="mw-headline" id="Report_Manager"><span class="mw-headline" id="Report_Manager"><span class="mw-headline" id="Report_Manager"><span class="mw-headline" id="Report_Manager"><span class="mw-headline" id="Report_Manager"><span class="mw-headline" id="Report_Manager"><span class="mw-headline" id="Report_Manager">Report Manager</span></span></span></span></span></span></span></span></span></span></span></span></span></span></span></span></span></span></span></span></span></span></span></span></span></span></span></span></span></span></span></span></span></span></span></span></span></span></span></span></span></span></span></span></span></span></span></span></span></span></span></span></span></span></span></span></span></span></span></span></span></span></span></span></span></span></span></span></span></span></span></span></span></span></span></span></span></span> == |
| − | The Report Manager has access to "Reports" and "Report Groups" modules in the specific location(s) where he/she was | + | The Report Manager has access to "Reports" and "Report Groups" modules in the specific location(s) where he/she was designared as Report Manager. Inside those modules, a Report Manager is able to: |
*Create custom reports and publish them only in his/her location | *Create custom reports and publish them only in his/her location | ||
*Edit or Delete existing customer reports in his/her location | *Edit or Delete existing customer reports in his/her location | ||
| − | ''Note: Deleting is not possible if the report is published elsewhere | + | '''<u>Note:</u> '''Deleting is not possible if the report is published elsewhere |
*Create Report Groups | *Create Report Groups | ||
*Add Reports to Report Groups | *Add Reports to Report Groups | ||
| − | === <span class="mw-headline" id="Data_Source_Manager"><span class="mw-headline" id="Data_Source_Manager"><span class="mw-headline" id="Data_Source_Manager"><span class="mw-headline" id="Data_Source_Manager"><span class="mw-headline" id="Data_Source_Manager"><span class="mw-headline" id="Data_Source_Manager"><span class="mw-headline" id="Data_Source_Manager">Data Source Manager</span></span></span></span></span></span></span> | + | == <span class="mw-headline" id="Data_Source_Manager"><span class="mw-headline" id="Data_Source_Manager"><span class="mw-headline" id="Data_Source_Manager"><span class="mw-headline" id="Data_Source_Manager"><span class="mw-headline" id="Data_Source_Manager"><span class="mw-headline" id="Data_Source_Manager"><span class="mw-headline" id="4._Data_Source_Manager"><span class="mw-headline" id="Data_Source_Manager"><span class="mw-headline" id="Data_Source_Manager"><span class="mw-headline" id="Data_Source_Manager"><span class="mw-headline" id="Data_Source_Manager"><span class="mw-headline" id="Data_Source_Manager"><span class="mw-headline" id="Data_Source_Manager"><span class="mw-headline" id="Data_Source_Manager"><span class="mw-headline" id="Data_Source_Manager"><span class="mw-headline" id="Data_Source_Manager"><span class="mw-headline" id="Data_Source_Manager"><span class="mw-headline" id="Data_Source_Manager"><span class="mw-headline" id="Data_Source_Manager"><span class="mw-headline" id="Data_Source_Manager"><span class="mw-headline" id="Data_Source_Manager"><span class="mw-headline" id="Data_Source_Manager"><span class="mw-headline" id="Data_Source_Manager"><span class="mw-headline" id="Data_Source_Manager"><span class="mw-headline" id="Data_Source_Manager"><span class="mw-headline" id="Data_Source_Manager"><span class="mw-headline" id="Data_Source_Manager"><span class="mw-headline" id="Data_Source_Manager"><span class="mw-headline" id="Data_Source_Manager"><span class="mw-headline" id="Data_Source_Manager"><span class="mw-headline" id="Data_Source_Manager"><span class="mw-headline" id="Data_Source_Manager"><span class="mw-headline" id="Data_Source_Manager"><span class="mw-headline" id="Data_Source_Manager"><span class="mw-headline" id="Data_Source_Manager"><span class="mw-headline" id="Data_Source_Manager"><span class="mw-headline" id="Data_Source_Manager"><span class="mw-headline" id="Data_Source_Manager"><span class="mw-headline" id="Data_Source_Manager"><span class="mw-headline" id="Data_Source_Manager"><span class="mw-headline" id="Data_Source_Manager"><span class="mw-headline" id="Data_Source_Manager"><span class="mw-headline" id="Data_Source_Manager"><span class="mw-headline" id="Data_Source_Manager"><span class="mw-headline" id="Data_Source_Manager"><span class="mw-headline" id="Data_Source_Manager"><span class="mw-headline" id="Data_Source_Manager"><span class="mw-headline" id="Data_Source_Manager"><span class="mw-headline" id="Data_Source_Manager"><span class="mw-headline" id="Data_Source_Manager"><span class="mw-headline" id="Data_Source_Manager"><span class="mw-headline" id="Data_Source_Manager"><span class="mw-headline" id="Data_Source_Manager"><span class="mw-headline" id="Data_Source_Manager"><span class="mw-headline" id="Data_Source_Manager"><span class="mw-headline" id="Data_Source_Manager"><span class="mw-headline" id="Data_Source_Manager"><span class="mw-headline" id="Data_Source_Manager"><span class="mw-headline" id="Data_Source_Manager"><span class="mw-headline" id="Data_Source_Manager"><span class="mw-headline" id="Data_Source_Manager"><span class="mw-headline" id="Data_Source_Manager"><span class="mw-headline" id="Data_Source_Manager"><span class="mw-headline" id="Data_Source_Manager"><span class="mw-headline" id="Data_Source_Manager"><span class="mw-headline" id="Data_Source_Manager"><span class="mw-headline" id="Data_Source_Manager"><span class="mw-headline" id="Data_Source_Manager"><span class="mw-headline" id="Data_Source_Manager"><span class="mw-headline" id="Data_Source_Manager"><span class="mw-headline" id="Data_Source_Manager"><span class="mw-headline" id="Data_Source_Manager"><span class="mw-headline" id="Data_Source_Manager"><span class="mw-headline" id="Data_Source_Manager"><span class="mw-headline" id="Data_Source_Manager"><span class="mw-headline" id="Data_Source_Manager"><span class="mw-headline" id="Data_Source_Manager">Data Source Manager</span></span></span></span></span></span></span></span></span></span></span></span></span></span></span></span></span></span></span></span></span></span></span></span></span></span></span></span></span></span></span></span></span></span></span></span></span></span></span></span></span></span></span></span></span></span></span></span></span></span></span></span></span></span></span></span></span></span></span></span></span></span></span></span></span></span></span></span></span></span></span></span></span></span></span></span></span> == |
The Data Source Manager is responsible for creating and updating Data Sources and Data Source types. | The Data Source Manager is responsible for creating and updating Data Sources and Data Source types. | ||
| Line 90: | Line 87: | ||
*Create, Edit, and Delete Data Source types | *Create, Edit, and Delete Data Source types | ||
| − | === <span class="mw-headline" id="User_.28Execution_Module_only.29_Section_Name"><span class="mw-headline" id="User_.28Execution_Module_only.29_Section_Name"><span class="mw-headline" id="User_.28Execution_Module_only.29_Section_Name"><span class="mw-headline" id="User_.28Execution_Module_only.29_Section_Name"><span class="mw-headline" id="User_.28Execution_Module_only.29_Section_Name"><span class="mw-headline" id="User_.28Execution_Module_only.29_Section_Name"><span class="mw-headline" id="User_.28Execution_Module_only.29_Section_Name">User (Execution Module only) Section Name</span></span></span></span></span></span></span> | + | == <span class="mw-headline" id="User_.28Execution_Module_only.29_Section_Name"><span class="mw-headline" id="User_.28Execution_Module_only.29_Section_Name"><span class="mw-headline" id="User_.28Execution_Module_only.29_Section_Name"><span class="mw-headline" id="User_.28Execution_Module_only.29_Section_Name"><span class="mw-headline" id="User_.28Execution_Module_only.29_Section_Name"><span class="mw-headline" id="5._User_.28Execution_Module_only.29_Section_Name"><span class="mw-headline" id="User_.28Execution_Module_only.29_Section_Name"><span class="mw-headline" id="User_.28Execution_Module_only.29_Section_Name"><span class="mw-headline" id="User_.28Execution_Module_only.29_Section_Name"><span class="mw-headline" id="User_.28Execution_Module_only.29_Section_Name"><span class="mw-headline" id="User_.28Execution_Module_only.29_Section_Name"><span class="mw-headline" id="User_.28Execution_Module_only.29_Section_Name"><span class="mw-headline" id="User_.28Execution_Module_only.29_Section_Name"><span class="mw-headline" id="User_.28Execution_Module_only.29_Section_Name"><span class="mw-headline" id="User_.28Execution_Module_only.29_Section_Name"><span class="mw-headline" id="User_.28Execution_Module_only.29_Section_Name"><span class="mw-headline" id="User_.28Execution_Module_only.29_Section_Name"><span class="mw-headline" id="User_.28Execution_Module_only.29_Section_Name"><span class="mw-headline" id="User_.28Execution_Module_only.29_Section_Name"><span class="mw-headline" id="User_.28Execution_Module_only.29_Section_Name"><span class="mw-headline" id="User_.28Execution_Module_only.29_Section_Name"><span class="mw-headline" id="User_.28Execution_Module_only.29_Section_Name"><span class="mw-headline" id="User_.28Execution_Module_only.29_Section_Name"><span class="mw-headline" id="User_.28Execution_Module_only.29_Section_Name"><span class="mw-headline" id="User_.28Execution_Module_only.29_Section_Name"><span class="mw-headline" id="User_.28Execution_Module_only.29_Section_Name"><span class="mw-headline" id="User_.28Execution_Module_only.29_Section_Name"><span class="mw-headline" id="User_.28Execution_Module_only.29_Section_Name"><span class="mw-headline" id="User_.28Execution_Module_only.29_Section_Name"><span class="mw-headline" id="User_.28Execution_Module_only.29_Section_Name"><span class="mw-headline" id="User_.28Execution_Module_only.29_Section_Name"><span class="mw-headline" id="User_.28Execution_Module_only.29_Section_Name"><span class="mw-headline" id="User_.28Execution_Module_only.29_Section_Name"><span class="mw-headline" id="User_.28Execution_Module_only.29_Section_Name"><span class="mw-headline" id="User_.28Execution_Module_only.29_Section_Name"><span class="mw-headline" id="User_.28Execution_Module_only.29_Section_Name"><span class="mw-headline" id="User_.28Execution_Module_only.29_Section_Name"><span class="mw-headline" id="User_.28Execution_Module_only.29_Section_Name"><span class="mw-headline" id="User_.28Execution_Module_only.29_Section_Name"><span class="mw-headline" id="User_.28Execution_Module_only.29_Section_Name"><span class="mw-headline" id="User_.28Execution_Module_only.29_Section_Name"><span class="mw-headline" id="User_.28Execution_Module_only.29_Section_Name"><span class="mw-headline" id="User_.28Execution_Module_only.29_Section_Name"><span class="mw-headline" id="User_.28Execution_Module_only.29_Section_Name"><span class="mw-headline" id="User_.28Execution_Module_only.29_Section_Name"><span class="mw-headline" id="User_.28Execution_Module_only.29_Section_Name"><span class="mw-headline" id="User_.28Execution_Module_only.29_Section_Name"><span class="mw-headline" id="User_.28Execution_Module_only.29_Section_Name"><span class="mw-headline" id="User_.28Execution_Module_only.29_Section_Name"><span class="mw-headline" id="User_.28Execution_Module_only.29_Section_Name"><span class="mw-headline" id="User_.28Execution_Module_only.29_Section_Name"><span class="mw-headline" id="User_.28Execution_Module_only.29_Section_Name"><span class="mw-headline" id="User_.28Execution_Module_only.29_Section_Name"><span class="mw-headline" id="User_.28Execution_Module_only.29_Section_Name"><span class="mw-headline" id="User_.28Execution_Module_only.29_Section_Name"><span class="mw-headline" id="User_.28Execution_Module_only.29_Section_Name"><span class="mw-headline" id="User_.28Execution_Module_only.29_Section_Name"><span class="mw-headline" id="User_.28Execution_Module_only.29_Section_Name"><span class="mw-headline" id="User_.28Execution_Module_only.29_Section_Name"><span class="mw-headline" id="User_.28Execution_Module_only.29_Section_Name"><span class="mw-headline" id="User_.28Execution_Module_only.29_Section_Name"><span class="mw-headline" id="User_.28Execution_Module_only.29_Section_Name"><span class="mw-headline" id="User_.28Execution_Module_only.29_Section_Name"><span class="mw-headline" id="User_.28Execution_Module_only.29_Section_Name"><span class="mw-headline" id="User_.28Execution_Module_only.29_Section_Name"><span class="mw-headline" id="User_.28Execution_Module_only.29_Section_Name"><span class="mw-headline" id="User_.28Execution_Module_only.29_Section_Name"><span class="mw-headline" id="User_.28Execution_Module_only.29_Section_Name"><span class="mw-headline" id="User_.28Execution_Module_only.29_Section_Name"><span class="mw-headline" id="User_.28Execution_Module_only.29_Section_Name"><span class="mw-headline" id="User_.28Execution_Module_only.29_Section_Name"><span class="mw-headline" id="User_.28Execution_Module_only.29_Section_Name"><span class="mw-headline" id="User_.28Execution_Module_only.29_Section_Name"><span class="mw-headline" id="User_.28Execution_Module_only.29_Section_Name"><span class="mw-headline" id="User_.28Execution_Module_only.29_Section_Name"><span class="mw-headline" id="User_.28Execution_Module_only.29_Section_Name"><span class="mw-headline" id="User_.28Execution_Module_only.29_Section_Name">User (Execution Module only) Section Name</span></span></span></span></span></span></span></span></span></span></span></span></span></span></span></span></span></span></span></span></span></span></span></span></span></span></span></span></span></span></span></span></span></span></span></span></span></span></span></span></span></span></span></span></span></span></span></span></span></span></span></span></span></span></span></span></span></span></span></span></span></span></span></span></span></span></span></span></span></span></span></span></span></span></span></span></span> == |
The User role is able to execute only those reports specifically granted access to him/her, and may not create new reports or modify existing reports. Administrators may restrict user access only to data belonging to specific customers and data sources. | The User role is able to execute only those reports specifically granted access to him/her, and may not create new reports or modify existing reports. Administrators may restrict user access only to data belonging to specific customers and data sources. | ||
| − | = <span class="mw-headline" id="Getting_Started_with_MESWeb_Reports"><span class="mw-headline" id="Getting_Started_with_MESWeb_Reports"><span class="mw-headline" id="Getting_Started_with_MESWeb_Reports"><span class="mw-headline" id="Getting_Started_with_MESWeb_Reports"><span class="mw-headline" id="Getting_Started_with_MESWeb_Reports"><span class="mw-headline" id="Getting_Started_with_MESWeb_Reports"> | + | |
| + | |||
| + | = <span class="mw-headline" id="MESWeb_Parameters"><span class="mw-headline" id="MESWeb_Parameters"><span class="mw-headline" id="MESWeb_Parameters"><span class="mw-headline" id="MESWeb_Parameters"><span class="mw-headline" id="MESWeb_Parameters">MESWeb Parameters</span></span></span></span></span> = | ||
| + | |||
| + | As already has been said before, steps mainly work as filters to be used to execute the report. A step can contain a quantity of parameters, also, a step may or may not be the parent of another subsequent step. Take Customer and Part numbers as examples. In a previous step, the user selects the customer and the part numbers related to the selected customers will be shown. | ||
| + | |||
| + | '''MESWeb''' has a collection of parameters highly configurable by the user to help to filter the information, such as; | ||
| + | |||
| + | #'''Dropdown List - '''This manages a list where only one single option is selected. | ||
| + | #'''Checkbox - '''A checkbox is used for true/false parameters. | ||
| + | #'''Radio Buttons - '''Radio buttons allow the user to select one option from the list. Every option selectable is mutually exclusive. This also can be used to show different parameters. | ||
| + | #'''Date - '''A date parameter is used to select a specific date. This is a variant that also allows the user to select the time. | ||
| + | #'''Date Range''' - The date range is a parameter that allows selecting a range between two dates. (A variant that also allows the to user selects the time). | ||
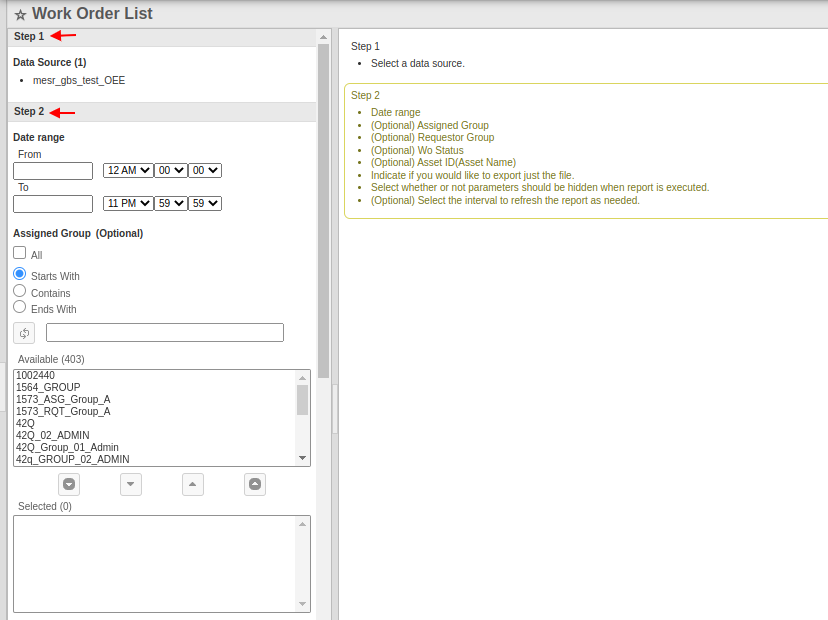
| + | #'''Listbox''' - In a list box, multiple options can be selected. All checkbox allows to user to select every option available on the list. Users can filter options using the checkboxes Starts With, Contains, and Ends With after the user has selected the option and written some text in the text box has to click on the [[File:Refresh.PNG|RTENOTITLE]] icon to refresh the list. | ||
| + | |||
| + | The [[File:HL downarrow.PNG|RTENOTITLE]] (highlighted down-arrow) icon moves all of the options in the "Available" list to the "Selected" list. | ||
| + | |||
| + | The [[File:Downarrow.PNG|RTENOTITLE]] (down-arrow) icon moves only the selected option in the "Available" list to the "Selected" list. | ||
| + | |||
| + | The [[File:Uparrow.PNG|RTENOTITLE]] (up-arrow) icon moves only the selected option in the "Selected" list back into the "Available" list, thus removing it from the "Selected" list. | ||
| + | |||
| + | The [[File:HL uparrow.PNG|RTENOTITLE]] (highlighted up-arrow) icon moves all of the options in the "Selected" list back to the "Available" list, thus removing all options from the "Selected" list. | ||
| + | <ol start="7"> | ||
| + | <li>'''Multi-Line Text Box - '''It allows adding lines as necessary.</li> | ||
| + | </ol> | ||
| + | |||
| + | | ||
| + | |||
| + | == <span class="mw-headline" id="Results"><span class="mw-headline" id="Results"><span class="mw-headline" id="Results"><span class="mw-headline" id="Results">Results</span></span></span></span> == | ||
| + | |||
| + | *'''Grids: '''Once a report is executed, a grid with the results will appear on the right side. | ||
| + | *'''Selected Parameters:''' The selected parameters will appear on the downside. This contains all the parameters that the user has selected and other useful information such as how many times the report took the application and the execution day. | ||
| + | |||
| + | | ||
| + | |||
| + | == <span class="mw-headline" id="Actions"><span class="mw-headline" id="Actions"><span class="mw-headline" id="Actions"><span class="mw-headline" id="Actions">Actions</span></span></span></span> == | ||
| + | |||
| + | There are three principal actions that can be done with the report's results: Print, Export, and Share. | ||
| + | |||
| + | *'''Print: '''This option allows the user to print the report. After selecting the '''Print,''' a dialog box appears. Select Print to display the report’s results. | ||
| + | *'''Export: '''The Export button downloads a file to the user's PC. The report can be saved in several formats, according to the user's needs '''Google Sheets, Excel, XML, CSV, '''and '''Text.''' | ||
| + | |||
| + | Follow the steps below to export to Google sheet''':''' | ||
| + | |||
| + | '''Step 1: '''Select the Google Sheet option in the drop-down menu: | ||
| + | |||
| + | '''Step 2: '''Configure the Google permissions by selecting the correct option: | ||
| + | |||
| + | '''Step 3: '''A message will be displayed when the configuration is done: | ||
| + | |||
| + | '''Step 4: '''See the report exported in the selected format: | ||
| + | |||
| + | *'''Share: '''This option is used to share the report's results. The user can share the report via '''Email''' or as a '''Link'''. | ||
| + | |||
| + | ''' ''' | ||
| + | |||
| + | | ||
| + | |||
| + | == <span class="mw-headline" id="Drilldowns"><span class="mw-headline" id="Drilldowns"><span class="mw-headline" id="Drilldowns"><span class="mw-headline" id="Drilldowns"><span class="mw-headline" id="Drilldowns">Drilldowns</span></span></span></span></span> == | ||
| + | |||
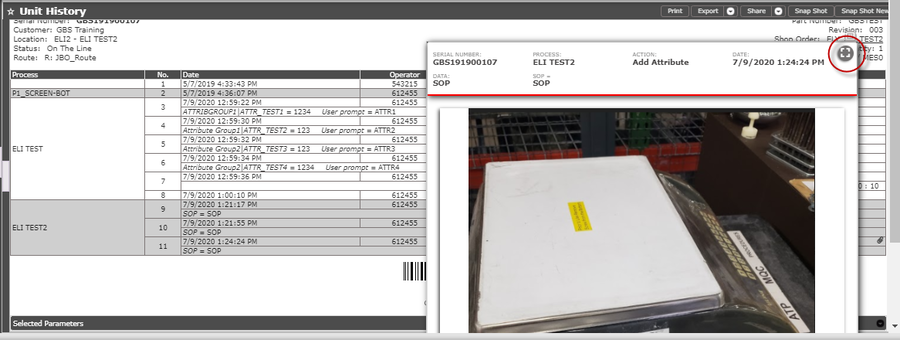
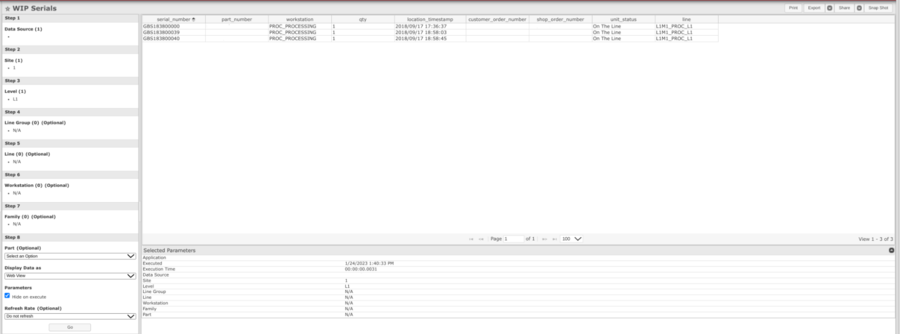
| + | Drilldowns occur when a link is selected by the user in order to drill down or further expand the data. To access Drilldown reports, select the parent link. This report will generate another report using a parameter passed by the selected link from the first report. This second report will use the default configuration (i.e., WEB format and pagination) to generate the data. WIP serials, a default report that shows the serial numbers and other information, have a Drilldown to Unit History. Drilldowns can be identified by their format; they are all underscored. | ||
| + | |||
| + | | ||
| + | |||
| + | = <span class="mw-headline" id="MESWeb_Reports"><span class="mw-headline" id="MESWeb_Reports"><span class="mw-headline" id="MESWeb_Reports"><span class="mw-headline" id="MESWeb_Reports"><span class="mw-headline" id="MESWeb_Reports"><span class="mw-headline" id="MESWeb_Reports"><span class="mw-headline" id="MESWeb_Reports"><span class="mw-headline" id="MESWeb_Reports"><span class="mw-headline" id="MESWeb_Reports"><span class="mw-headline" id="MESWeb_Reports"><span class="mw-headline" id="MESWeb_Reports"><span class="mw-headline" id="MESWeb_Reports"><span class="mw-headline" id="MESWeb_Reports"><span class="mw-headline" id="MESWeb_Reports"><span class="mw-headline" id="MESWeb_Reports"><span class="mw-headline" id="MESWeb_Reports"><span class="mw-headline" id="MESWeb_Reports"><span class="mw-headline" id="MESWeb_Reports"><span class="mw-headline" id="MESWeb_Reports"><span class="mw-headline" id="MESWeb_Reports"><span class="mw-headline" id="MESWeb_Reports"><span class="mw-headline" id="MESWeb_Reports"><span class="mw-headline" id="MESWeb_Reports"><span class="mw-headline" id="MESWeb_Reports"><span class="mw-headline" id="MESWeb_Reports"><span class="mw-headline" id="MESWeb_Reports"><span class="mw-headline" id="MESWeb_Reports"><span class="mw-headline" id="MESWeb_Reports"><span class="mw-headline" id="MESWeb_Reports"><span class="mw-headline" id="MESWeb_Reports"><span class="mw-headline" id="MESWeb_Reports"><span class="mw-headline" id="MESWeb_Reports"><span class="mw-headline" id="MESWeb_Reports"><span class="mw-headline" id="MESWeb_Reports"><span class="mw-headline" id="MESWeb_Reports"><span class="mw-headline" id="MESWeb_Reports"><span class="mw-headline" id="MESWeb_Reports"><span class="mw-headline" id="MESWeb_Reports"><span class="mw-headline" id="MESWeb_Reports"><span class="mw-headline" id="MESWeb_Reports"><span class="mw-headline" id="MESWeb_Reports"><span class="mw-headline" id="MESWeb_Reports"><span class="mw-headline" id="MESWeb_Reports"><span class="mw-headline" id="MESWeb_Reports"><span class="mw-headline" id="MESWeb_Reports"><span class="mw-headline" id="MESWeb_Reports"><span class="mw-headline" id="MESWeb_Reports"><span class="mw-headline" id="MESWeb_Reports"><span class="mw-headline" id="MESWeb_Reports"><span class="mw-headline" id="MESWeb_Reports"><span class="mw-headline" id="MESWeb_Reports"><span class="mw-headline" id="MESWeb_Reports"><span class="mw-headline" id="MESWeb_Reports"><span class="mw-headline" id="MESWeb_Reports"><span class="mw-headline" id="MESWeb_Reports"><span class="mw-headline" id="MESWeb_Reports"><span class="mw-headline" id="MESWeb_Reports"><span class="mw-headline" id="MESWeb_Reports"><span class="mw-headline" id="MESWeb_Reports"><span class="mw-headline" id="MESWeb_Reports"><span class="mw-headline" id="MESWeb_Reports"><span class="mw-headline" id="MESWeb_Reports"><span class="mw-headline" id="MESWeb_Reports"><span class="mw-headline" id="MESWeb_Reports"><span class="mw-headline" id="MESWeb_Reports"><span class="mw-headline" id="MESWeb_Reports"><span class="mw-headline" id="MESWeb_Reports"><span class="mw-headline" id="MESWeb_Reports"><span class="mw-headline" id="MESWeb_Reports"><span class="mw-headline" id="MESWeb_Reports"><span class="mw-headline" id="MESWeb_Reports"><span class="mw-headline" id="MESWeb_Reports"><span class="mw-headline" id="MESWeb_Reports"><span class="mw-headline" id="MESWeb_Reports"><span class="mw-headline" id="MESWeb_Reports"><span class="mw-headline" id="MESWeb_Reports"><span class="mw-headline" id="MESWeb_Reports"><span class="mw-headline" id="MESWeb_Reports"><span class="mw-headline" id="Getting_Started_with_MESWeb_Reports"><span class="mw-headline" id="Getting_Started_with_MESWeb_Reports"><span class="mw-headline" id="Getting_Started_with_MESWeb_Reports"><span class="mw-headline" id="Getting_Started_with_MESWeb_Reports"><span class="mw-headline" id="Getting_Started_with_MESWeb_Reports"><span class="mw-headline" id="Getting_Started_with_MESWeb_Reports"><span class="mw-headline" id="Getting_Started_with_MESWeb_Reports"><span class="mw-headline" id="Getting_Started_with_MESWeb_Reports"><span class="mw-headline" id="Getting_Started_with_MESWeb_Reports"><span class="mw-headline" id="Getting_Started_with_MESWeb_Reports"><span class="mw-headline" id="Getting_Started_with_MESWeb_Reports"><span class="mw-headline" id="Getting_Started_with_MESWeb_Reports"><span class="mw-headline" id="Getting_Started_with_MESWeb_Reports">MESWeb Reports</span></span></span></span></span></span></span></span></span></span></span></span></span></span></span></span></span></span></span></span></span></span></span></span></span></span></span></span></span></span></span></span></span></span></span></span></span></span></span></span></span></span></span></span></span></span></span></span></span></span></span></span></span></span></span></span></span></span></span></span></span></span></span></span></span></span></span></span></span></span></span></span></span></span></span></span></span></span></span></span></span></span></span></span></span></span></span></span></span></span></span> = | ||
| + | |||
| + | '''MESWeb''' is designed for user-friendliness, and executing reports is no exception. This guide will walk users through the simple process in just a few steps. | ||
| + | |||
| + | To access the MESWeb Reports page users must have access to the 42Q Portal. Once logged in, users must navigate to: '''Reporting'''''<b>></b>'''''MESWeb'''''<b>.</b>'' | ||
| + | |||
| + | | ||
| + | |||
| + | '''Figure 1: Accessing to MESWeb Reports''' | ||
| + | |||
| + | [[File:MW WelcometoMESW.png|900px|MW WelcometoMESW.png]] | ||
| + | |||
| + | Users can access MESWeb Reports from this page by navigating and selecting from the two options available: | ||
| + | |||
| + | *'''Administration''' | ||
| + | *'''Reports''' | ||
| + | |||
| + | ''' ''' | ||
| + | |||
| + | = <span class="mw-headline" id="Reports"><span class="mw-headline" id="Reports"><span class="mw-headline" id="Reports"><span class="mw-headline" id="Reports"><span class="mw-headline" id="Tools"><span class="mw-headline" id="Tools"><span class="mw-headline" id="Tools"><span class="mw-headline" id="Tools"><span class="mw-headline" id="Tools"><span class="mw-headline" id="Tools"><span class="mw-headline" id="Tools"><span class="mw-headline" id="Tools"><span class="mw-headline" id="Tools"><span class="mw-headline" id="Tools"><span class="mw-headline" id="Tools"><span class="mw-headline" id="Tools"><span class="mw-headline" id="Tools"><span class="mw-headline" id="Tools"><span class="mw-headline" id="Tools"><span class="mw-headline" id="Tools"><span class="mw-headline" id="Tools"><span class="mw-headline" id="Tools"><span class="mw-headline" id="Tools"><span class="mw-headline" id="Tools"><span class="mw-headline" id="Tools"><span class="mw-headline" id="Tools"><span class="mw-headline" id="Tools"><span class="mw-headline" id="Tools"><span class="mw-headline" id="Tools"><span class="mw-headline" id="Tools"><span class="mw-headline" id="Tools"><span class="mw-headline" id="Tools"><span class="mw-headline" id="Tools"><span class="mw-headline" id="Tools"><span class="mw-headline" id="Tools"><span class="mw-headline" id="Tools"><span class="mw-headline" id="Tools"><span class="mw-headline" id="Tools"><span class="mw-headline" id="Tools"><span class="mw-headline" id="Tools"><span class="mw-headline" id="Tools"><span class="mw-headline" id="Tools"><span class="mw-headline" id="Tools"><span class="mw-headline" id="Tools"><span class="mw-headline" id="Tools"><span class="mw-headline" id="Tools"><span class="mw-headline" id="Tools"><span class="mw-headline" id="Tools"><span class="mw-headline" id="Tools"><span class="mw-headline" id="Tools"><span class="mw-headline" id="Tools"><span class="mw-headline" id="Tools"><span class="mw-headline" id="Tools"><span class="mw-headline" id="Tools"><span class="mw-headline" id="Tools"><span class="mw-headline" id="Tools"><span class="mw-headline" id="Tools"><span class="mw-headline" id="Tools"><span class="mw-headline" id="Tools"><span class="mw-headline" id="Tools"><span class="mw-headline" id="Tools"><span class="mw-headline" id="Tools"><span class="mw-headline" id="Tools"><span class="mw-headline" id="Tools"><span class="mw-headline" id="Tools"><span class="mw-headline" id="Tools"><span class="mw-headline" id="Tools"><span class="mw-headline" id="Tools"><span class="mw-headline" id="Tools"><span class="mw-headline" id="Tools"><span class="mw-headline" id="Tools"><span class="mw-headline" id="Tools"><span class="mw-headline" id="Tools"><span class="mw-headline" id="Tools">Reports</span></span></span></span></span></span></span></span></span></span></span></span></span></span></span></span></span></span></span></span></span></span></span></span></span></span></span></span></span></span></span></span></span></span></span></span></span></span></span></span></span></span></span></span></span></span></span></span></span></span></span></span></span></span></span></span></span></span></span></span></span></span></span></span></span></span></span></span></span></span></span></span></span></span> = | ||
| + | |||
| + | == <span class="mw-headline" id="Snap_Shots"><span class="mw-headline" id="Snap_Shots"><span class="mw-headline" id="Snap_Shots"><span class="mw-headline" id="Snap_Shots"><span class="mw-headline" id="Snap_Shots"><span class="mw-headline" id="Snap_Shots"><span class="mw-headline" id="Snap_Shots"><span class="mw-headline" id="Snap_Shots"><span class="mw-headline" id="Snap_Shots"><span class="mw-headline" id="Snap_Shots"><span class="mw-headline" id="Snap_Shots"><span class="mw-headline" id="Snap_Shots"><span class="mw-headline" id="Snap_Shots"><span class="mw-headline" id="Snap_Shots"><span class="mw-headline" id="Snap_Shots"><span class="mw-headline" id="Snap_Shots"><span class="mw-headline" id="Snap_Shots"><span class="mw-headline" id="Snap_Shots"><span class="mw-headline" id="Snap_Shots"><span class="mw-headline" id="Snap_Shots"><span class="mw-headline" id="Snap_Shots"><span class="mw-headline" id="Snap_Shots"><span class="mw-headline" id="Snap_Shots"><span class="mw-headline" id="Snap_Shots"><span class="mw-headline" id="Snap_Shots"><span class="mw-headline" id="Snap_Shots"><span class="mw-headline" id="Snap_Shots"><span class="mw-headline" id="Snap_Shots"><span class="mw-headline" id="Snap_Shots"><span class="mw-headline" id="Snap_Shots"><span class="mw-headline" id="Snap_Shots"><span class="mw-headline" id="Snap_Shots"><span class="mw-headline" id="Snap_Shots"><span class="mw-headline" id="Snap_Shots"><span class="mw-headline" id="Snap_Shots"><span class="mw-headline" id="Snap_Shots"><span class="mw-headline" id="Snap_Shots"><span class="mw-headline" id="Snap_Shots"><span class="mw-headline" id="Snap_Shots"><span class="mw-headline" id="Snap_Shots"><span class="mw-headline" id="Snap_Shots"><span class="mw-headline" id="Snap_Shots"><span class="mw-headline" id="Snap_Shots"><span class="mw-headline" id="Snap_Shots"><span class="mw-headline" id="Snap_Shots"><span class="mw-headline" id="Snap_Shots"><span class="mw-headline" id="Snap_Shots"><span class="mw-headline" id="Snap_Shots"><span class="mw-headline" id="Snap_Shots"><span class="mw-headline" id="Snap_Shots"><span class="mw-headline" id="Snap_Shots"><span class="mw-headline" id="Snap_Shots"><span class="mw-headline" id="Snap_Shots"><span class="mw-headline" id="Snap_Shots"><span class="mw-headline" id="Snap_Shots"><span class="mw-headline" id="Snap_Shots"><span class="mw-headline" id="Snap_Shots"><span class="mw-headline" id="Snap_Shots"><span class="mw-headline" id="Snap_Shots"><span class="mw-headline" id="Snap_Shots"><span class="mw-headline" id="Snap_Shots"><span class="mw-headline" id="Snap_Shots"><span class="mw-headline" id="Snap_Shots"><span class="mw-headline" id="Snap_Shots"><span class="mw-headline" id="Snap_Shots"><span class="mw-headline" id="Snap_Shots"><span class="mw-headline" id="Snap_Shots"><span class="mw-headline" id="Snap_Shots"><span class="mw-headline" id="Snap_Shots"><span class="mw-headline" id="Snap_Shots"><span class="mw-headline" id="Snap_Shots"><span class="mw-headline" id="Snap_Shots"><span class="mw-headline" id="Snap_Shots"><span class="mw-headline" id="Snap_Shots"><span class="mw-headline" id="Snap_Shots"><span class="mw-headline" id="Snap_Shots"><span class="mw-headline" id="Snap_Shots"><span class="mw-headline" id="Snap_Shots"><span class="mw-headline" id="Snap_Shots"><span class="mw-headline" id="Snap_Shots"><span class="mw-headline" id="Snap_Shots"><span class="mw-headline" id="Snap_Shots"><span class="mw-headline" id="Snap_Shots"><span class="mw-headline" id="Snap_Shots"><span class="mw-headline" id="Snap_Shots"><span class="mw-headline" id="Snap_Shots"><span class="mw-headline" id="Snap_Shots">Snap Shots</span></span></span></span></span></span></span></span></span></span></span></span></span></span></span></span></span></span></span></span></span></span></span></span></span></span></span></span></span></span></span></span></span></span></span></span></span></span></span></span></span></span></span></span></span></span></span></span></span></span></span></span></span></span></span></span></span></span></span></span></span></span></span></span></span></span></span></span></span></span></span></span></span></span></span></span></span></span></span></span></span></span></span></span></span></span></span> == | ||
| + | |||
| + | This tool allows users to schedule a report with selected parameters saved at a certain time and sent to certain users. | ||
| + | |||
| + | Follow the steps below to create a '''Schedule'''''':''' | ||
| + | |||
| + | 1. '''Select''' the configuration icon in the top right corner of the page | ||
| + | |||
| + | 2. '''Select '''Snap Shots within the list menu to open the Snap Shots window | ||
| + | |||
| + | | ||
| + | |||
| + | '''Figure 2: SnapShot Schedule''' | ||
| + | |||
| + | '''[[File:MESWeb SnapshotSchedule.png|900px|MESWeb SnapshotSchedule.png]]''' | ||
| + | |||
| + | 3. '''Select '''the plus-sign icon to the left of the SnapShot to expand. | ||
| + | |||
| + | 4. '''Select''' the plus-sign icon to the far right on the schedule bar to open the Schedule Configuration form. | ||
| + | |||
| + | | ||
| + | |||
| + | '''Figure 3: SnapShot Additional Information''' | ||
| − | + | ''''''[[File:MESWeb SnapshotAdditionalInformation.png|border|900px|MESWeb SnapshotAdditionalInformation.png]]'''''' | |
| − | | | ||
| − | | MESWeb | ||
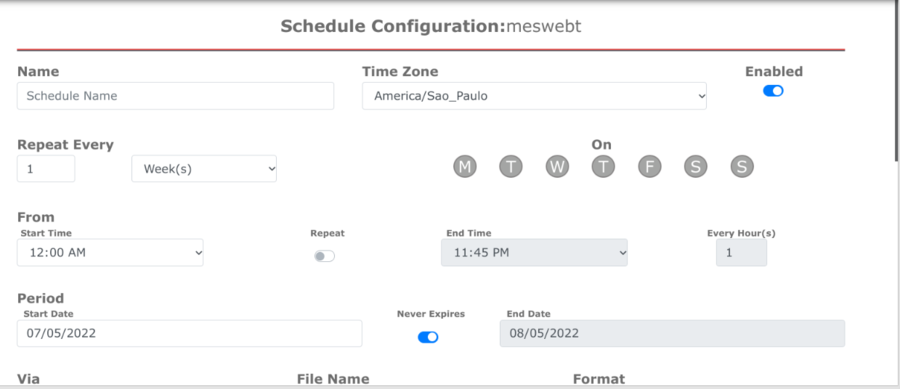
| − | + | The Schedule Configuration form appears where the user can enter specific information, such as Name, Time Zone, and Frequency, about the schedule. | |
| − | + | <br/> The Frequency section allows the user to establish the timing settings for running a report. | |
| − | |||
| − | |||
| | ||
| − | + | '''Figure 4: Schedule Configuration''' | |
| − | + | '''[[File:MESWeb ScheduleConfiguration.png|border|900px|MESWeb ScheduleConfiguration.png]]''' | |
| − | |||
| − | |||
| − | |||
| − | ''' | + | ''' ''' |
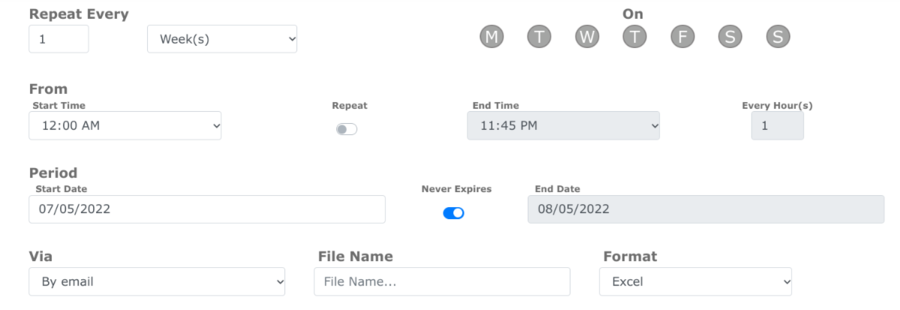
| − | ''' | + | In '''Schedule''' '''Information''', Name, enabled and Time zone can be modified. In '''Repeat Every''', the user can set all settings on when the report is going to run. |
| − | + | The '''Period''' section allows the user to set a date range for execution or repetition. Users can also select how would they like the report to be delivered by choosing from the available options in the '''Delivery Options''' section. | |
| − | ''' | + | ''' ''' |
| − | ''' | + | '''Figure 5: Duration and Delivery Options''' |
| − | + | ''''''[[File:MESWeb DurationandDeliveryOptions.png|border|900px|MESWeb DurationandDeliveryOptions.png]]'''''' | |
| − | + | In the example above, the report will be delivered via email in Excel format. | |
| | ||
| − | Figure | + | '''Figure 6: Sending''' |
| + | |||
| + | '''[[File:MESWE Sending.png|900px|MESWE Sending.png]]''' | ||
| + | |||
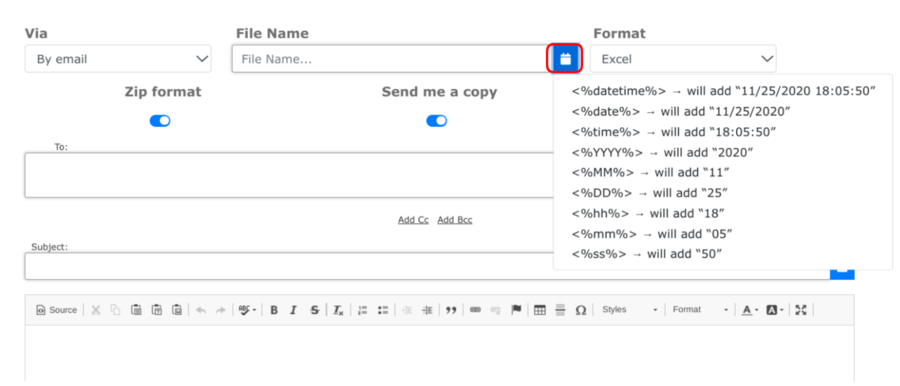
| + | While sending an email, users have the option to input the date/time stamp as needed within the email and file subject lines. | ||
| + | |||
| + | By clicking on the blue calendar icon, wildcard options will be displayed including: | ||
| + | |||
| + | <%datetime%> → will add “11/25/2020 18:05:50” | ||
| + | |||
| + | <%date%> → will add “11/25/2020” | ||
| + | |||
| + | <%time%> → will add “18:05:50” | ||
| + | |||
| + | <%YYYY%> → will add “2020” | ||
| + | |||
| + | <%MM%> → will add “11” | ||
| + | |||
| + | <%DD%> → will add “25” | ||
| + | |||
| + | <%hh%> → will add “18” | ||
| − | + | <%mm%> → will add “05” | |
| − | + | <%ss%> → will add “50” | |
| | ||
| − | + | Users can also select or combine the wildcards as they choose, for example, if the subject contains: '''“Test Example <%DD%>_<%MM%>”''', then the user will receive mail with the title showing as: '''“Test Example 25_11”. ''' | |
| + | |||
| + | <br/> This form is shown when users select '''Email '''on '''Delivery Options.''' | ||
| − | + | | |
| − | + | '''Figure 7: Sending via FTP Server''' | |
| − | + | '''[[File:MESWeb SendingviaFTPServer.png|border|900px|MESWeb SendingviaFTPServer.png]]''' | |
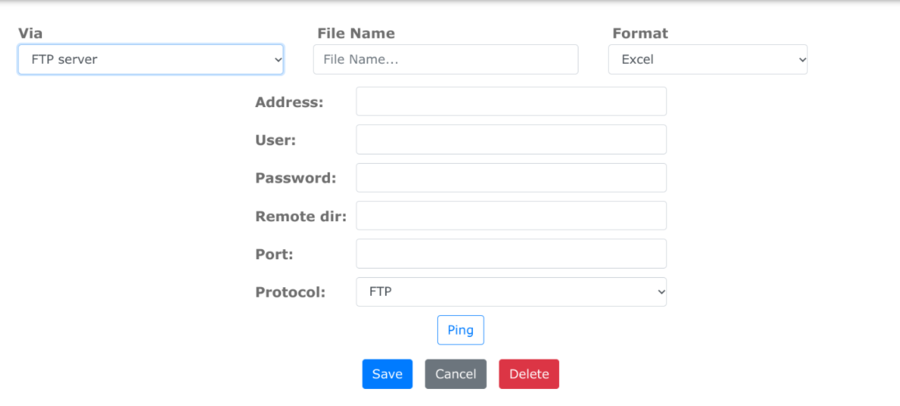
| − | + | Once the FTP information has been entered and set up, the user can Save, Cancel, or Delete the scheduled report | |
| − | + | | |
| + | |||
| + | | ||
| − | == <span class="mw-headline" id=" | + | == <span class="mw-headline" id="Favorites_and_Most_Viewed"><span class="mw-headline" id="Favorites_and_Most_Viewed"><span class="mw-headline" id="Favorites_and_Most_Viewed"><span class="mw-headline" id="Favorites_and_Most_Viewed"><span class="mw-headline" id="Most_Viewed_and_Favorites"><span class="mw-headline" id="Most_Viewed_and_Favorites"><span class="mw-headline" id="Most_Viewed_and_Favorites"><span class="mw-headline" id="Most_Viewed_and_Favorites"><span class="mw-headline" id="Most_Viewed_and_Favorites"><span class="mw-headline" id="Most_Viewed_and_Favorites"><span class="mw-headline" id="Most_Viewed_and_Favorites"><span class="mw-headline" id="Most_Viewed_and_Favorites"><span class="mw-headline" id="Most_Viewed_and_Favorites"><span class="mw-headline" id="Most_Viewed_and_Favorites"><span class="mw-headline" id="Most_Viewed_and_Favorites"><span class="mw-headline" id="Most_Viewed_and_Favorites"><span class="mw-headline" id="Most_Viewed_and_Favorites"><span class="mw-headline" id="Most_Viewed_and_Favorites"><span class="mw-headline" id="Most_Viewed_and_Favorites"><span class="mw-headline" id="Most_Viewed_and_Favorites"><span class="mw-headline" id="Most_Viewed_and_Favorites"><span class="mw-headline" id="Most_Viewed_and_Favorites"><span class="mw-headline" id="Most_Viewed_and_Favorites"><span class="mw-headline" id="Most_Viewed_and_Favorites"><span class="mw-headline" id="Most_Viewed_and_Favorites"><span class="mw-headline" id="Most_Viewed_and_Favorites"><span class="mw-headline" id="Most_Viewed_and_Favorites"><span class="mw-headline" id="Most_Viewed_and_Favorites"><span class="mw-headline" id="Most_Viewed_and_Favorites"><span class="mw-headline" id="Most_Viewed_and_Favorites"><span class="mw-headline" id="Most_Viewed_and_Favorites"><span class="mw-headline" id="Most_Viewed_and_Favorites"><span class="mw-headline" id="Most_Viewed_and_Favorites"><span class="mw-headline" id="Most_Viewed_and_Favorites"><span class="mw-headline" id="Most_Viewed_and_Favorites"><span class="mw-headline" id="Most_Viewed_and_Favorites"><span class="mw-headline" id="Most_Viewed_and_Favorites"><span class="mw-headline" id="Most_Viewed_and_Favorites"><span class="mw-headline" id="Most_Viewed_and_Favorites"><span class="mw-headline" id="Most_Viewed_and_Favorites"><span class="mw-headline" id="Most_Viewed_and_Favorites"><span class="mw-headline" id="Most_Viewed_and_Favorites"><span class="mw-headline" id="Most_Viewed_and_Favorites"><span class="mw-headline" id="Most_Viewed_and_Favorites"><span class="mw-headline" id="Most_Viewed_and_Favorites"><span class="mw-headline" id="Most_Viewed_and_Favorites"><span class="mw-headline" id="Most_Viewed_and_Favorites"><span class="mw-headline" id="Most_Viewed_and_Favorites"><span class="mw-headline" id="Most_Viewed_and_Favorites"><span class="mw-headline" id="Most_Viewed_and_Favorites"><span class="mw-headline" id="Most_Viewed_and_Favorites"><span class="mw-headline" id="Most_Viewed_and_Favorites"><span class="mw-headline" id="Most_Viewed_and_Favorites"><span class="mw-headline" id="Most_Viewed_and_Favorites"><span class="mw-headline" id="Most_Viewed_and_Favorites"><span class="mw-headline" id="Most_Viewed_and_Favorites"><span class="mw-headline" id="Most_Viewed_and_Favorites"><span class="mw-headline" id="Most_Viewed_and_Favorites"><span class="mw-headline" id="Most_Viewed_and_Favorites"><span class="mw-headline" id="Most_Viewed_and_Favorites"><span class="mw-headline" id="Most_Viewed_and_Favorites"><span class="mw-headline" id="Most_Viewed"><span class="mw-headline" id="Most_Viewed"><span class="mw-headline" id="Most_Viewed"><span class="mw-headline" id="Most_Viewed"><span class="mw-headline" id="Most_Viewed"><span class="mw-headline" id="Most_Viewed"><span class="mw-headline" id="Most_Viewed"><span class="mw-headline" id="Most_Viewed"><span class="mw-headline" id="Most_Viewed"><span class="mw-headline" id="Most_Viewed"><span class="mw-headline" id="Most_Viewed"><span class="mw-headline" id="Most_Viewed"><span class="mw-headline" id="Most_Viewed"><span class="mw-headline" id="Most_Viewed"><span class="mw-headline" id="Most_Viewed"><span class="mw-headline" id="Most_Viewed"><span class="mw-headline" id="Most_Viewed"><span class="mw-headline" id="Most_Viewed"><span class="mw-headline" id="Most_Viewed">Favorites and Most Viewed</span></span></span></span></span></span></span></span></span></span></span></span></span></span></span></span></span></span></span></span></span></span></span></span></span></span></span></span></span></span></span></span></span></span></span></span></span></span></span></span></span></span></span></span></span></span></span></span></span></span></span></span></span></span></span></span></span></span></span></span></span></span></span></span></span></span></span></span></span></span></span></span></span></span></span></span></span></span></span></span> == |
| − | + | MESWeb will automatically save the most viewed reports. This will be shown within the Most Viewedgroup as well as every report has a star on the header that allows the user to save reports on the Favorites group. | |
| − | ''' | + | ''' ''' |
| − | + | == <span class="mw-headline" id="CMMS_Reports"><span class="mw-headline" id="CMMS_Reports"><span class="mw-headline" id="CMMS_Reports"><span class="mw-headline" id="CMMS_Reports">CMMS Reports</span></span></span></span> == | |
| − | + | The CMMS Reports provide users with a list of reports for CMMS activity recorded. | |
| − | + | To access this report navigate: to '''Reporting''' > '''MESWeb''' > '''CMMS''' '''Reports'''. | |
| − | + | | |
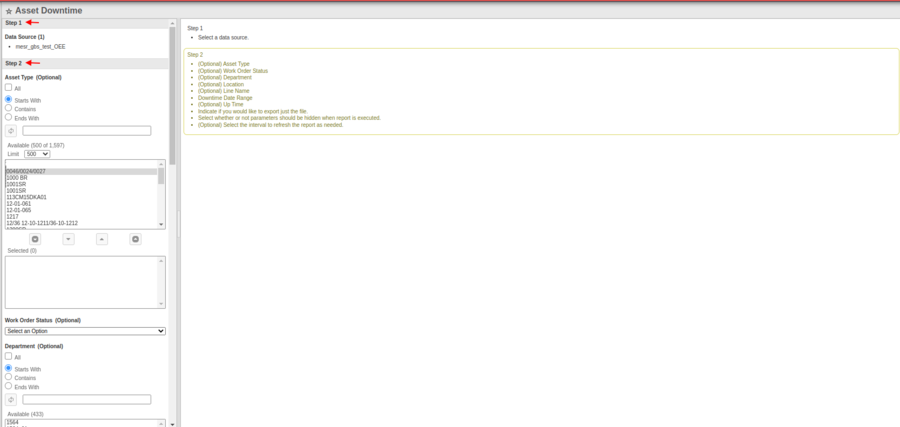
| − | + | == <span class="mw-headline" id="Asset_Downtime"><span class="mw-headline" id="Asset_Downtime"><span class="mw-headline" id="Asset_Downtime"><span class="mw-headline" id="Asset_Downtime">Asset Downtime</span></span></span></span> == | |
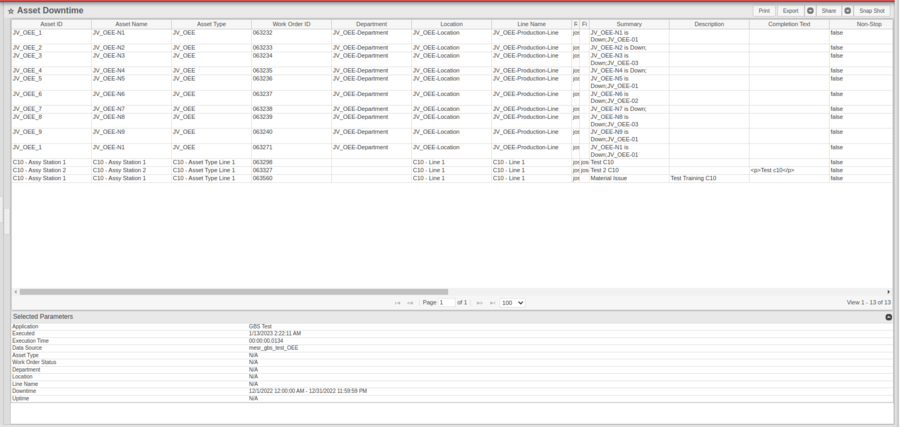
| − | + | The Asset Downtime Report can show the downtime lists with the Asset ID, Asset Name, Asset Type, Work Order ID, Department, Location, Line Name, Reporter, and Fixed by. | |
| − | + | '''Chart Type''': Data displays in Pareto Charts. | |
| − | ''' | + | #Select '''Data Source''' in Step 1. |
| + | #Select '''Next'''. | ||
| + | #Select Parameters in Step 2. | ||
| − | + | *'''Asset Type''' (Optional). | |
| + | *'''Work Order Status''' (Optional). | ||
| + | *'''Department''' (Optional). | ||
| + | *'''Location''' (Optional). | ||
| + | *'''Line''' '''Name''' (Optional). | ||
| + | *'''Downtime''' '''Date''' '''Range'''. | ||
| + | *'''Up''' '''Time''' (Optional). | ||
| + | *Indicate if users would like to export just the file. | ||
| + | *Select whether or not the parameters should be hidden when the report is executed. | ||
| + | *Select the interval to refresh the report as needed (Optional). | ||
| − | + | | |
| − | + | '''Figure 8: Asset Downtime - Data Source''' | |
| − | + | [[File:Asset Downtime step2.png|border|900px|Asset Downtime step2.png]] | |
| − | + | | |
| − | + | '''Figure 9: Asset Downtime Report''' | |
| − | + | [[File:Asset downtime report.png|border|900px|Asset downtime report.png]] | |
| − | + | | |
| + | |||
| + | === <span class="mw-headline" id="Asset_Event_History"><span class="mw-headline" id="Asset_Event_History"><span class="mw-headline" id="Asset_Event_History"><span class="mw-headline" id="Asset_Event_History">Asset Event History </span></span></span></span> === | ||
| + | |||
| + | The Asset Event History Report can show the Asset Problem/Event lists with the Asset ID, Tag ID, Problem/Event Code, Creation Time and Process Time. | ||
| + | |||
| + | ''' Chart Type''': Data displays in Pareto Charts. | ||
| − | + | #Select Data Source in Step 1. | |
| + | #Select '''Next'''. | ||
| + | #Select '''Creation Time '''in Step 2. | ||
| + | #Select Parameters in Step 3. | ||
| − | + | *'''Asset''' '''ID''' (Optional). | |
| + | *'''Tag''' '''ID''' (Optional). | ||
| + | *Indicate if users would like to export just the file. | ||
| + | *Select whether or not the parameters should be hidden when the report is executed. | ||
| + | *Select the interval to refresh the report as needed (Optional). | ||
| − | + | | |
| − | '''Figure 10: | + | '''Figure 10: Asset Event History - Data Source''' |
| − | [[File: | + | '''[[File:Asset event history data source.png|border|900px|Asset event history data source.png]]''' |
| − | + | | |
| − | + | '''Figure 11: Asset Event History Report''' | |
| − | + | [[File:Asset event history report.png|border|900px|Asset event history report.png]] | |
| − | + | | |
| − | + | | |
| − | + | === <span class="mw-headline" id="Asset_List"><span class="mw-headline" id="Asset_List"><span class="mw-headline" id="Asset_List"><span class="mw-headline" id="Asset_List"><span class="mw-headline" id="Asset_List">Asset List</span></span></span></span></span> === | |
| − | + | The Asset List Report can show the PM Planned and PM Scheduled Assets records with the Asset ID, Asset Name, Asset Type, and other associated information. | |
| − | + | '''Chart Type''': Data displays in Pareto Charts. | |
| − | + | #Select Data Source in Step 1. | |
| + | #Select '''Next'''. | ||
| + | #Select Parameters in Step 2. | ||
| − | ''' | + | *'''PM Plan Date''' (Optional) |
| + | *'''PM Scheduled''' (Optional). | ||
| + | <ol start="4"> | ||
| + | <li>Select Parameters in Step 3.</li> | ||
| + | </ol> | ||
| − | + | *'''Asset Type''' (Optional). | |
| + | *'''Asset ID''' (Asset Name) (Optional). | ||
| + | *'''Asset Status''' (Optional). | ||
| + | *'''Location''' (Optional). | ||
| + | *'''Line Name''' (Optional). | ||
| + | *Indicate if users would like to export just the file. | ||
| + | *Select whether or not the parameters should be hidden when the report is executed. | ||
| + | *Select the interval to refresh the report as needed (Optional). | ||
| − | + | | |
| − | + | '''Figure 12: Asset List - Data Source''' | |
| − | + | [[File:Asset list data resource.png|border|900px|Asset list data resource.png]] | |
| − | + | | |
| − | + | '''Figure 13: Asset List Report''' | |
| − | + | [[File:Asset List Report.png|border|900px|Asset List Report.png]] | |
| | ||
| − | == | + | == <span class="mw-headline" id="AVL_Detail_List"><span class="mw-headline" id="AVL_Detail_List"><span class="mw-headline" id="AVL_Detail_List"><span class="mw-headline" id="AVL_Detail_List">AVL Detail List</span></span></span></span> == |
| + | |||
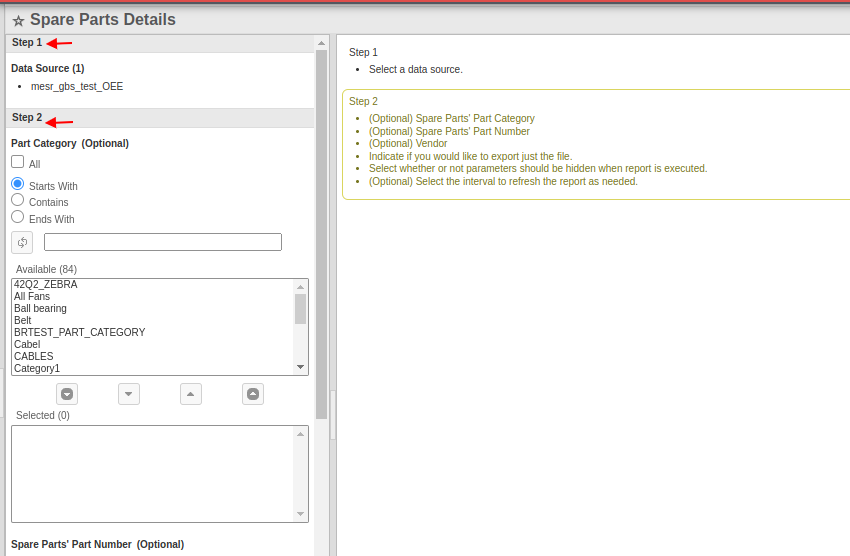
| + | The AVL Detail List Report can show the AVL(Approved Vendor List) details for the spare parts. | ||
| − | + | '''Chart Type''': Data displays in Pareto Charts. | |
| − | ''' | + | #Select Data Source in Step 1. |
| + | #Select '''Next'''. | ||
| + | #Select Parameters in Step 2. | ||
| − | + | *'''Spare Parts Part Number''' (Optional) | |
| + | *'''Vendor''' (Optional) | ||
| + | *Indicate if users would like to export just the file. | ||
| + | *Select whether or not parameters should be hidden when the report is executed. | ||
| + | *Select the interval to refresh the report as needed (Optional) . | ||
| − | + | | |
| − | '''Figure | + | '''Figure 14: AVL Detail List - Data Source''' |
| − | [[File: | + | [[File:AVL Detail list-Data source.png|border|700px|AVL Detail list-Data source.png]] |
| | ||
| + | |||
| + | '''Figure 15: AVL Detail List Report''' | ||
| + | |||
| + | [[File:AVL Detail list report.png|border|900px|AVL Detail list report.png]] | ||
| | ||
| − | === <span class="mw-headline" id=" | + | === <span class="mw-headline" id="Calibration_Master_and_Recall_List"><span class="mw-headline" id="Calibration_Master_and_Recall_List"><span class="mw-headline" id="Calibration_Master_and_Recall_List"><span class="mw-headline" id="Calibration_Master_and_Recall_List">Calibration Master and Recall List</span></span></span></span> === |
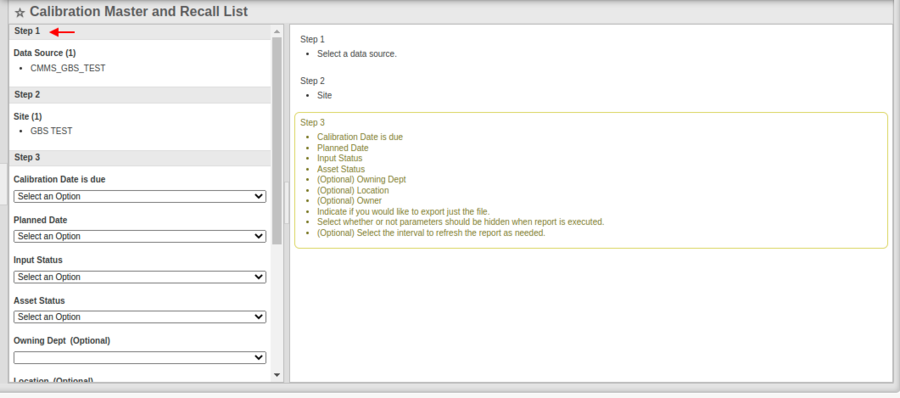
| − | The | + | The Calibration Master and Recall List Report can show the Asset’s calibration records with the Asset ID, Asset Name, Asset Type, and other associated information. '''Chart Type''': Data displays in Pareto Charts. |
| − | ''' | + | #Select Data Source in Step 1. |
| + | #Select '''Next'''. | ||
| + | #Select '''Site''' in Step 2. | ||
| + | #Select Parameters in Step 3. | ||
| − | + | *'''Calibration Date is due'''. | |
| + | *'''Planned Date'''. | ||
| + | *'''Input''' '''Status'''. | ||
| + | *'''Asset''' '''Status'''. | ||
| + | *'''Owning''' '''Dept''' (Optional) | ||
| + | *'''Location''' (Optional) | ||
| + | *'''Owner''' (Optional) | ||
| + | *Indicate if users would like to export just the file. | ||
| + | *Select whether or not parameters should be hidden when the report is executed. | ||
| + | *Select the interval to refresh the report as needed (Optional) . | ||
| | ||
| − | + | '''Figure 16: Calibration Master and Recall List - Data Source''' | |
| − | + | [[File:Calibration master data source.png|border|900px|Calibration master data source.png]] | |
| − | + | | |
| − | '''Figure 17: | + | '''Figure 17: Calibration Master and Recall List Report''' |
| − | [[File: | + | [[File:Calibration Master and Recall List report.png|border|900px|Calibration Master and Recall List report.png]] |
| | ||
| − | + | === <span class="mw-headline" id="Labor_History"><span class="mw-headline" id="Labor_History"><span class="mw-headline" id="Labor_History"><span class="mw-headline" id="Labor_History">Labor History </span></span></span></span> === | |
| − | + | The Labor History Report can show the Labor history records with the Asset ID, Asset Name, Work Order ID, Location, Line name, Start time, End Time, and Assigned User. | |
| − | + | '''Chart Type''': Data displays in Pareto Charts. | |
| + | |||
| + | #Select Data Source in Step 1. | ||
| + | #Select '''Next'''. | ||
| + | #Select Parameters in Step 2. | ||
| + | |||
| + | *'''Start Time'''. | ||
| + | *'''Location''' (Optional). | ||
| + | * '''Line''' '''Name''' (Optional). | ||
| + | *'''Asset ID''' (Asset Name) (Optional). | ||
| + | *Indicate if users would like to export just the file. | ||
| + | *Select whether or not the parameters should be hidden when the report is executed. | ||
| + | *Select the interval to refresh the report as needed (Optional). | ||
| | ||
| − | ''' | + | '''Figure 18: Labor History - Data Source''' |
| + | |||
| + | [[File:Labor history data source.png|border|700px|Labor history data source.png]] | ||
| + | |||
| + | | ||
| − | '''Figure 19: | + | '''Figure 19: Labor History Report''' |
| − | [[File: | + | [[File:Labor history report1.png|border|900px|Labor history report1.png]] |
| | ||
| − | ''' | + | === <span class="mw-headline" id="PM_Plan_List_with_Work_Order"><span class="mw-headline" id="PM_Plan_List_with_Work_Order"><span class="mw-headline" id="PM_Plan_List_with_Work_Order"><span class="mw-headline" id="PM_Plan_List_with_Work_Order">PM Plan List with Work Order</span></span></span></span> === |
| + | |||
| + | The PM Plan List with Work Order Report can show the Asset’s PM plan work orders with the Asset ID, Asset Name, Asset Type, Work Order ID, Work Order Status, PM ID, PM Type, Plan Date, and other associated information. | ||
| + | |||
| + | '''Chart Type''': Data displays in Pareto Charts. | ||
| − | ''' | + | #Select Data Source in Step 1. |
| + | #Select '''Next'''. | ||
| + | #Select Parameters in Step 2. | ||
| − | ''' | + | *'''PM Plan Date'''. |
| + | *'''PM Calendar Status''' (Optional). | ||
| + | *'''Department''' (Optional). | ||
| + | *'''Assigned Group''' (Optional). | ||
| + | *'''Work Order Status''' (Optional). | ||
| + | *'''Asset''' '''ID'''(Asset Name) (Optional). | ||
| + | *Indicate if you users would like to export just the file. | ||
| + | *Select whether or not the parameters should be hidden when the report is executed. | ||
| + | *Select the interval to refresh the report as needed (Optional). | ||
| | ||
| + | |||
| + | '''Figure 20: PM Plan List with Work Order - Data Source''' | ||
| + | |||
| + | [[File:PM plan list with work order - data source.png|border|700px|PM plan list with work order - data source.png]] | ||
| | ||
| + | |||
| + | '''Figure 21: PM Plan List with Work Order Report''' | ||
| + | |||
| + | [[File:PM Plan list with WO Report.png|border|900px|PM Plan list with WO Report.png]] | ||
| | ||
| − | === <span class="mw-headline" id=" | + | === <span class="mw-headline" id="Spare_Parts_Details"><span class="mw-headline" id="Spare_Parts_Details"><span class="mw-headline" id="Spare_Parts_Details"><span class="mw-headline" id="Spare_Parts_Details">Spare Parts Details</span></span></span></span> === |
| − | + | The Spare Parts Details Report can show the details of the spare parts with the Asset ID, Asset Name, Asset Type, Line Name, Location, Spare Parts’ Part number, Serial Number , WO ID, Load Time, Unload Time and other associated information.<br/> '''Chart Type''': Data displays in Pareto Charts. | |
| − | ''' | + | #Select Data Source in Step 1. |
| + | #Select '''Next'''. | ||
| + | #Select Parameters in Step 2. | ||
| − | ''' | + | *'''Spare Part’s Part Category''' (Optional). |
| + | *'''Spare Part’s Part Number '''(Optional). | ||
| + | *'''Vendor''' (Optional). | ||
| + | *Indicate if users would like to export just the file. | ||
| + | *Select whether or not the parameters should be hidden when the report is executed. | ||
| + | *Select the interval to refresh the report as needed (Optional). | ||
| | ||
| − | + | '''Figure 22: Spare Parts Details - Data Source''' | |
| + | |||
| + | [[File:Spare parts details -data soruce.png|border|900px|Spare parts details -data soruce.png]] | ||
| − | + | | |
| + | |||
| + | '''Figure 23: Spare Parts Details Report''' | ||
| + | |||
| + | [[File:Spare Parts Details report.png|border|900px|Spare Parts Details report.png]] | ||
| + | |||
| + | | ||
| + | |||
| + | === <span class="mw-headline" id="Spare_Parts_Usage_by_Asset"><span class="mw-headline" id="Spare_Parts_Usage_by_Asset"><span class="mw-headline" id="Spare_Parts_Usage_by_Asset"><span class="mw-headline" id="Spare_Parts_Usage_by_Asset">Spare Parts Usage by Asset</span></span></span></span> === | ||
| + | |||
| + | The Spare Parts Usage by Asset Report can show the spare parts usage by asset with the Asset ID, Asset Name, Asset Type, Line Name, Location, Spare Parts’ Part number, Serial Number, WO ID, Load Time, Unload Time and other associated information. | ||
| + | |||
| + | '''Chart Type''': Data displays in Pareto Charts. | ||
| + | |||
| + | #Select Data Source in Step 1. | ||
| + | #Select '''Next'''. | ||
| + | #Select Parameters in Step 2. | ||
| + | |||
| + | *'''Load Time From Date'''. | ||
| + | *'''Load Time To''' (Optional). | ||
| + | *'''Spare Part’s Part Number''' (Optional). | ||
| + | *'''Location Name''' (Optional). | ||
| + | *'''Line Name''' (Optional). | ||
| + | *'''Asset Type''' (Optional). | ||
| + | *'''Asset ID''' (Optional). | ||
| + | *'''Work Order ID''' (Optional). | ||
| + | *'''Load User''' (Optional). | ||
| + | *Indicate if users would like to export just the file. | ||
| + | *Select whether or not the parameters should be hidden when the report is executed. | ||
| + | *Select the interval to refresh the report as needed (Optional) . | ||
| + | |||
| + | | ||
| + | |||
| + | '''Figure 24: Spare Parts Usage by Asset - Data Source''' | ||
| + | |||
| + | [[File:Spare Parts usage by asset - Data source.png|border|900px|Spare Parts usage by asset - Data source.png]] | ||
| + | |||
| + | | ||
| + | |||
| + | '''Figure 25: Spare Parts Usage by Asset Report''' | ||
| + | |||
| + | [[File:Spare Parts usage by asset report.png|border|900px|Spare Parts usage by asset report.png]] | ||
| + | |||
| + | | ||
| + | |||
| + | | ||
| + | |||
| + | == <span class="mw-headline" id="Subinventory_Detail_List"><span class="mw-headline" id="Subinventory_Detail_List"><span class="mw-headline" id="Subinventory_Detail_List"><span class="mw-headline" id="Subinventory_Detail_List"><span class="mw-headline" id="Subinventory_Detail_List">Subinventory Detail List</span></span></span></span></span> == | ||
| + | |||
| + | The Subinventory Detail List Report can show the sub-inventory detail for the spare parts with the Spare parts’ part number, sub-inventory, locator, and QOH. | ||
| + | |||
| + | '''Chart Type''': Data displays in Pareto Charts. | ||
| − | ''' | + | #Select Data Source in Step 1. |
| + | #Select '''Next'''. | ||
| + | #Select Parameters in Step 2. | ||
| − | ''' | + | *'''Spare Parts’ Part Number''' (Optional). |
| + | *Indicate if users would like to export just the file. | ||
| + | *Select whether or not the parameters should be hidden when the report is executed. | ||
| + | *Select the interval to refresh the report as needed (Optional). | ||
| | ||
| − | + | '''Figure 26: Subinventory Detail List Report - Data Source''' | |
| − | + | [[File:Subinventory detail list- data source.png|border|700px|Subinventory detail list- data source.png]] | |
| − | + | | |
| − | '''Figure | + | '''Figure 27: Subinventory Detail List Report''' |
| − | + | [[File:Subinventory detail list report.png|border|900px|Subinventory detail list report.png]] | |
| | ||
| − | + | | |
| − | + | === <span class="mw-headline" id="Tooling_Usage_Report"><span class="mw-headline" id="Tooling_Usage_Report"><span class="mw-headline" id="Tooling_Usage_Report"><span class="mw-headline" id="Tooling_Usage_Report"><span class="mw-headline" id="Tooling_Usage_Report"><span class="mw-headline" id="Tooling_Usage_Report">Tooling Usage Report</span></span></span></span></span></span> === | |
| − | + | The Tooling Usage Report can show the tooling usage records with the Asset ID, Asset Name, Asset Type, Location, Current Usage and Max Usage. | |
| − | + | '''Chart Type''': Data displays in Pareto Charts. | |
| − | 2. | + | #Select Data Source in Step 1. |
| + | #Select '''Next'''. | ||
| + | #Select Parameters in Step 2. | ||
| − | ''' | + | *'''Asset Type''' (Optional). |
| + | *'''Asset ID''' (Optional). | ||
| + | *'''Start Date''' (Optional). | ||
| + | *'''To Date''' (Optional). | ||
| + | *Indicate if users would like to export just the file. | ||
| + | *Select whether or not the parameters should be hidden when the report is executed. | ||
| + | *Select the interval to refresh the report as needed (Optional). | ||
| − | '''[[File: | + | |
| + | |||
| + | '''Figure 28: Tooling Usage Report - Data Source''' | ||
| + | |||
| + | [[File:Tooling usage report - data source.png|border|900px|Tooling usage report - data source.png]] | ||
| − | + | | |
| − | + | '''Figure 29: Tooling Usage Report''' | |
| − | '''Figure | + | '''[[File:Figure 29- Tooling Usage Report1.png|border|900px|Tooling usage report.png]]''' |
| − | + | | |
| − | + | === <span class="mw-headline" id="Tooling_Where_Used_by_Serial_Number"><span class="mw-headline" id="Tooling_Where_Used_by_Serial_Number"><span class="mw-headline" id="Tooling_Where_Used_by_Serial_Number"><span class="mw-headline" id="Tooling_Where_Used_by_Serial_Number"><span class="mw-headline" id="Tooling_Where_Used_by_Serial_Number">Tooling Where Used by Serial Number</span></span></span></span></span> === | |
| − | + | The Tooling Where Used by Serial Number Report can show the tooling where used with the Serial Number, Part Number, Shop Order, Process, Location, and Date. | |
| − | |||
| − | |||
| − | |||
| − | |||
| − | ''' | + | '''Chart Type''': Data displays in Pareto Charts. |
| − | + | #Select Data Source in Step 1. | |
| + | #Select '''Next'''. | ||
| + | #Select Parameters in Step 2. | ||
| − | + | *'''Location'''. | |
| + | *'''From Date'''. | ||
| + | *'''To Date'''. | ||
| + | *Indicate if users would like to export just the file. | ||
| + | *Select whether or not the parameters should be hidden when the report is executed. | ||
| + | *Select the interval to refresh the report as needed (Optional) . | ||
| − | + | | |
| − | + | '''Figure 30: Tooling Where Used by Serial Number - Data Source''' | |
| − | + | [[File:Tooling where used.png|border|900px|Tooling where used.png]] | |
| − | + | | |
| − | + | '''Figure 31: Tooling Where Used by Serial Number Report''' | |
| − | + | [[File:Tooling where used by SN report.png|border|900px|Tooling where used by SN report.png]] | |
| − | + | | |
| − | + | | |
| − | + | === <span class="mw-headline" id="Work_Order_List"><span class="mw-headline" id="Work_Order_List"><span class="mw-headline" id="Work_Order_List"><span class="mw-headline" id="Work_Order_List"><span class="mw-headline" id="Work_Order_List">Work Order List</span></span></span></span></span> === | |
| − | + | The Work Order List Report can show the work orders with the Work Order ID, Work Order Type, PM ID, Location, Line Name, Asset ID, Asset Name and other associated information. | |
| − | + | '''Chart Type''': Data displays in Pareto Charts. | |
| − | ''' | + | #Select Data Source in Step 1. |
| + | #Select '''Next'''. | ||
| + | #Select Parameters in Step 2. | ||
| − | + | *'''Date Range'''. | |
| + | *'''Assigned Group''' (Optional). | ||
| + | *'''Requestor Group''' (Optional). | ||
| + | *'''WO Status''' (Optional). | ||
| + | *'''Asset ID''' (Asset Name) (Optional). | ||
| + | *Indicate if users would like to export just the file. | ||
| + | *Select whether or not the parameters should be hidden when the report is executed. | ||
| + | *Select the interval to refresh the report as needed (Optional). | ||
| | ||
| − | + | '''Figure 32: Work Order List Report - Data Source''' | |
| − | + | [[File:Work Order list- data source.png|border|900px|Work Order list- data source.png]] | |
| − | + | | |
| − | '''[[File: | + | '''Figure 33: Work Order List Report''' |
| + | |||
| + | [[File:Work Order list report.png|border|900px|Work Order list report.png]] | ||
| | ||
| − | = <span class="mw-headline" id=" | + | === <span class="mw-headline" id="Work_Order_Status"><span class="mw-headline" id="Work_Order_Status"><span class="mw-headline" id="Work_Order_Status"><span class="mw-headline" id="Work_Order_Status"><span class="mw-headline" id="Work_Order_Status"><span class="mw-headline" id="Work_Order_Status">Work Order Status</span></span></span></span></span></span> === |
| − | + | The Work Order Status Report can show the Work Order status with the Serial Number, Part Number, Shop Order, Process, Location, and Date. | |
| − | + | '''Chart Type''': Data displays in Pareto Charts. | |
| + | |||
| + | #Select Data Source in Step 1. | ||
| + | #Select '''Next'''. | ||
| + | #Select Parameters in Step 2. | ||
| + | |||
| + | *'''Date Range'''. | ||
| + | *'''Assigned Group''' (Optional). | ||
| + | *Indicate if users would like to export just the file. | ||
| + | *Select whether or not the parameters should be hidden when the report is executed. | ||
| + | *Select the interval to refresh the report as needed (Optional). | ||
| | ||
| − | + | '''Figure 34: Work Order Status Report - Data Source''' | |
| + | |||
| + | [[File:Work order status - data source.png|border|700px|Work order status - data source.png]] | ||
| + | |||
| + | | ||
| + | |||
| + | '''Figure 35: Work Order Status Report''' | ||
| + | |||
| + | [[File:Work order status report.png|border|900px|Work order status report.png]] | ||
| + | | ||
| − | == | + | == <span class="mw-headline" id="Custom_Reports"><span class="mw-headline" id="Custom_Reports"><span class="mw-headline" id="Custom_Reports"><span class="mw-headline" id="Custom_Reports">Custom Reports</span></span></span></span> == |
| − | Custom Reports is a categorization of report types that users can create. Custom reports perform | + | Custom Reports is a categorization of report types that users can create. Custom reports perform the function of default reports and allow users to be more specific and narrow in their searches within the application. |
| − | <br/> See the steps below the steps to generate a Custom Report by Serial Number: | + | <br/> See the steps below the steps to generate a Custom Report by Serial Number:''' ''' |
| − | #Select a data source. | + | #'''Select '''a data source. |
| − | #Insert a serial number. | + | #'''Insert''' a serial number. |
| − | #(Optional) Select a plant. | + | #(Optional) '''Select''' a plant. |
| − | #(Optional) Select a year. | + | #(Optional) '''Select '''a year. |
| − | #(Optional) Select a month. | + | #(Optional) '''Select '''a month. |
| − | ##Select whether or not parameters should be hidden when the report is executed. | + | ##'''Select '''whether or not parameters should be hidden when the report is executed. |
| − | ##(Optional) Select the interval to refresh the report as needed. | + | ##(Optional) '''Select''' the interval to refresh the report as needed. |
| | ||
| − | + | '''Figure 36: Defautl Report 1''' | |
| + | |||
| + | [[File:MWE CustomReport.png|border|900px|MWE CustomReport.png]] | ||
| | ||
| − | '''Figure | + | '''Figure 37: Default Report 1''' |
| − | [[File: | + | [[File:MWE Default Report1.png|border|900px|MWE Default Report1.png]] |
| − | + | | |
'''<u>Note</u>: '''This report will be able to use the serial number for finding its use in all of the materials from PTSR and Fujitrax databases, and show its scan board data and material information. | '''<u>Note</u>: '''This report will be able to use the serial number for finding its use in all of the materials from PTSR and Fujitrax databases, and show its scan board data and material information. | ||
| − | + | '''These same steps can also help users generate a Custom Report by Date Period.''' | |
| + | |||
| + | '''<u>Note</u>: '''This report can use a scanning date period to retrieve its serial number. | ||
| + | |||
| + | | ||
| − | + | === <span class="mw-headline" id="Customer_Active_User_Report"><span class="mw-headline" id="Customer_Active_User_Report"><span class="mw-headline" id="Customer_Active_User_Report"><span class="mw-headline" id="Customer_Active_User_Report"><span class="mw-headline" id="Customer_Active_User_Report">Customer Active User Report</span></span></span></span></span> === | |
| − | + | ||
| − | + | The '''Customer Active User Report''' allows the extraction of active billable users who logged into the 42Q system. The report also provides users with the total billable user count. A billable user is one who is assigned to a billable profile or is assigned to a non-billable profile but has access to reports other than '''Unit History Reports.''' | |
| − | + | ||
| − | + | To access this report navigate to '''Reporting > MESWeb > Activity Reports > Customer Active User Report,''' | |
| − | |||
| − | |||
| | ||
| − | The report | + | #'''Select '''a data source. |
| + | #'''Select''' a Client-Server. | ||
| + | #'''Select''' an IPortal Site. | ||
| + | #'''Select''' a MESWeb Application. | ||
| + | #'''Profile (Optional) '''allows users to filter reports by different profiles. | ||
| + | #'''Set '''the date range to search for which the report should be generated. The date range limit is 31 days. | ||
| + | #'''Click '''on the '''Go''' button. A list of all the active users in the selected date range will be displayed. The last row of the report shows the count of total billable users. | ||
| + | |||
| + | | ||
| + | |||
| + | '''Figure 38: Customer Active User Report Generated''' | ||
| + | |||
| + | '''[[File:MESWebExec65.png|border|900px|MESWebExec65.png]]''' | ||
| + | |||
| + | | ||
| + | |||
| + | === <span class="mw-headline" id="Location_Activity_Report"><span class="mw-headline" id="Location_Activity_Report"><span class="mw-headline" id="Location_Activity_Report"><span class="mw-headline" id="Location_Activity_Report"><span class="mw-headline" id="Location_Activity_Report"><span class="mw-headline" id="Location_Activity_Report"><span class="mw-headline" id="Location_Activity_Report">Location Activity Report</span></span></span></span></span></span></span> === | ||
| + | |||
| + | The '''Location Activity Report '''provides users a list of locations that had any activity recorded (e.g. when a unit is scanned and passed to another location). | ||
| + | |||
| + | To access this report navigate to '''Reporting > MESWeb > Activity Reports > Location Activity Report''' | ||
| + | |||
| + | #'''Select''' a data source. | ||
| + | #'''Select''' the Mfg Line. | ||
| + | #'''Set''' the date range to search for location activities within that date range The date range limit is 90 days. | ||
| + | #'''Click''' on the ''''Go'''' button. A list of locations containing assigned processes, counters of the pass to, and counters of activity. | ||
| + | |||
| + | '''<u>Note</u>:''' '''Pass to count''' is how many units passed from that location and the '''Activity counts''' how many activities were recorded at that location (quantity of attributes or commands that are entered). The report only provides the list of locations that have '''Passed to count '''or '''Activity count '''values greater than 0. | ||
| + | |||
| + | ''' ''' | ||
| + | |||
| + | '''Figure 39: Location Activity Report Generated''' | ||
| + | |||
| + | '''[[File:MW-LocActivityReport.png|border|900px|MW-LocActivityReport.png]]''' | ||
| + | |||
| + | ''' ''' | ||
| + | |||
| + | == <span class="mw-headline" id="Default_Reports"><span class="mw-headline" id="Default_Reports"><span class="mw-headline" id="Default_Reports"><span class="mw-headline" id="Default_Reports"><span class="mw-headline" id="Default_Reports">Default Reports </span></span></span></span></span> == | ||
| + | |||
| + | === <span class="mw-headline" id="Crew_Activity_Reports"><span class="mw-headline" id="Crew_Activity_Reports"><span class="mw-headline" id="Crew_Activity_Reports"><span class="mw-headline" id="Crew_Activity_Reports"><span class="mw-headline" id="Crew_Activity_Reports"><span class="mw-headline" id="Crew_Activity_Reports"><span class="mw-headline" id="Crew_Activity_Reports">Crew Activity Reports</span></span></span></span></span></span></span> === | ||
| + | |||
| + | <br/> <span class="mw-headline" id="The_Crew_Activity_Report_is_a_functionality_that_allows_the_MESWeb_users_.28Regular_and_Crew_Users.29_to_view_the_information_and_activities_related_to_a_specific_Crew_or_Crew_members.">The '''Crew Activity Report''' is a functionality that allows the '''MESWeb '''users (Regular and Crew Users) to view the information and activities related to a specific Crew or Crew member.</span> | ||
| + | |||
| + | To enter the '''Crew Activity Report''' the user must go to '''MESWeb> Reports> Default Reports> Crew Activity.''' | ||
| + | |||
| + | '''<u>Note</u>: '''The user can access Crew Activity Reports by selecting them and inserting information for each step provided. | ||
| + | |||
| + | ''' ''' | ||
| + | |||
| + | '''Figure 40: Crew Activity - Data Source''' | ||
| + | |||
| + | ''''''[[File:CrewActivityDataSource01.png|border|900px|CrewActivityDataSource01.png]]'''''' | ||
| + | |||
| + | ''' ''' | ||
| + | |||
| + | #Choose the '''Data Source '''provided with the drop-down menu of '''Data Source.''' | ||
| + | #In order to choose a Data Source, users must select the customer. Users can search for a specific member report that may be available by '''“Crew” '''or by '''“Employee Number”. ''' | ||
| + | |||
| + | ''' ''' | ||
| + | |||
| + | Users can conduct searches by inserting information in the optional boxes. Users can search by using three options to find searches''':''' | ||
| + | |||
| + | *'''Starts With '''option: Allows users to search using the first few letter(s) of the name. | ||
| + | *'''Contains '''option: This allows users to search with letters that are contained within the name. | ||
| + | *'''Ends With '''option: Allows users to search using the last few letter(s) of the name. | ||
| + | |||
| + | ''' ''' | ||
| + | |||
| + | '''Figure 41: Crew Activity - Crew''' | ||
| + | |||
| + | ''''''[[File:MW-CrewActivityCrew01.png|900px|MW-CrewActivityCrew01.png]]'''''' | ||
| + | |||
| + | ''' ''' | ||
| + | |||
| + | Once the user types in the first few or last few letters to search, click the '''Refresh''' '''button'''. Add the desired choice from the Available list to the '''Selected''' list by clicking the downward arrow. | ||
| + | |||
| + | '''<u>Note</u>: '''A specific Crew name should be selected in order to display the Report Type. | ||
| + | |||
| + | ''' '''The available options for crews are filtered for the crew name options. | ||
| + | |||
| + | '''<u>Note</u>: '''The down arrow will add the selected into the ‘Selected’ box below. The upward arrow will remove the selected from the selected box. | ||
| + | |||
| + | ''' ''' | ||
| + | |||
| + | '''Figure 42: Crew Activity - Report Type''' | ||
| + | |||
| + | ''''''[[File:MW-CrewActivityReportType01.png|900px|MW-CrewActivityReportType01.png]]'''''' | ||
| + | |||
| + | ''' ''' | ||
| + | <ol start="3"> | ||
| + | <li>Next, '''select''' the '''Report Type''' desired. The options are as follows:''' '''</li> | ||
| + | </ol> | ||
| + | |||
| + | *'''Crew Activity ''' | ||
| + | *'''Crew Status''' | ||
| + | <ol start="4"> | ||
| + | <li>Insert the desired time period using the '''From''' and '''To''' options and select the time for each. </li> | ||
| + | </ol> | ||
| + | |||
| + | *'''Setting a time period will allow users to see all the activities for a specific crew name selected.''' | ||
| + | |||
| + | ''' <u>Note</u>:''' Checking the box for the '''Hide''' '''on''' '''executing''' parameters option will hide the parameters once the report is executed. | ||
| + | <ol start="5"> | ||
| + | <li>Click '''Go'''. The reports will be displayed as follows based on the Report Type chosen: </li> | ||
| + | </ol> | ||
| + | |||
| + | ''' ''' | ||
| + | |||
| + | ==== <span class="mw-headline" id="Crew_Activity"><span class="mw-headline" id="Crew_Activity"><span class="mw-headline" id="Crew_Activity"><span class="mw-headline" id="Crew_Activity"><span class="mw-headline" id="Crew_Activity"><span class="mw-headline" id="Crew_Activity"><span class="mw-headline" id="Crew_Activity"><span class="mw-headline" id="Crew_Activity">Crew Activity</span></span></span></span></span></span></span></span> ==== | ||
| + | |||
| + | <br/> When the '''Crew Activity Report''' is selected, the final form will allow users to view a specific crew name and description concerning information about when the user logged in and logged out. | ||
| + | |||
| + | ''' ''' | ||
| + | |||
| + | '''Figure 43: Report Type - Crew Activity''' | ||
| + | |||
| + | ''''''[[File:MW-ReportTypeCrewActivity.png|900px|MW-ReportTypeCrewActivity.png]]'''''' | ||
| + | |||
| + | ''' ''' | ||
| + | |||
| + | | ||
| + | |||
| + | | ||
| + | |||
| + | ==== <span class="mw-headline" id="Crew_Status"><span class="mw-headline" id="Crew_Status"><span class="mw-headline" id="Crew_Status"><span class="mw-headline" id="Crew_Status"><span class="mw-headline" id="Crew_Status"><span class="mw-headline" id="Crew_Status"><span class="mw-headline" id="Crew_Status"><span class="mw-headline" id="Crew_Status"><span class="mw-headline" id="Crew_Status">Crew Status</span></span></span></span></span></span></span></span></span> ==== | ||
| + | |||
| + | When the '''Crew Status Report''' is selected, the final form will allow users to view information concerning crew members' names, descriptions, employee ID, and names. | ||
| + | |||
| + | ''' ''' | ||
| + | |||
| + | '''Figure 44: Report Type - Crew Status''' | ||
| + | |||
| + | ''''''[[File:MW-ReportTypeCrewStatus.png|900px|MW-ReportTypeCrewStatus.png]]'''''' | ||
| + | |||
| + | | ||
| + | |||
| + | | ||
| + | |||
| + | | ||
| + | |||
| + | === <span class="mw-headline" id="Cycle_Time_Details_Report"><span class="mw-headline" id="Cycle_Time_Details_Report"><span class="mw-headline" id="Cycle_Time_Details_Report"><span class="mw-headline" id="Cycle_Time_Details_Report"><span class="mw-headline" id="Cycle_Time_Details_Report"><span class="mw-headline" id="Cycle_Time_Details_Report"><span class="mw-headline" id="Cycle_Time_Details_Report"><span class="mw-headline" id="Cycle_Time_Details_Report">Cycle Time Details Report</span></span></span></span></span></span></span></span> === | ||
| + | |||
| + | Cycle Time Details Report provides essential metrics including cycle time, hands-on time, unattended time, and wait time, segmented by each serial and operator activity. | ||
| + | |||
| + | | ||
| + | |||
| + | '''Figure 45: Cycle Time Details Report''' | ||
| + | |||
| + | '''[[File:MESWeb detailRep.png|border|900px|MESWeb detailRep.png]]''' | ||
| + | |||
| + | | ||
| + | |||
| + | | ||
| + | |||
| + | | ||
| + | |||
| + | Cycle Time Details report allows user to filter the report by: | ||
| + | |||
| + | *'''Part Number: '''Users can optionally select one or multiple parts, for searching a part number use the product list box. | ||
| + | *'''Process: '''Users can select one or multiple processes, but are not required, to search for a process users need to use the process list box. | ||
| + | |||
| + | If a part is selected for the report generation, the selection of the process in the parameter can be optional. | ||
| + | |||
| + | If a part is not selected then the selection of the process should be mandatory in the parameter. | ||
| + | |||
| + | | ||
| + | |||
| + | Cycle Time by Details report shows records of individual activity for all the serials and operators. It shows the record of: | ||
| + | |||
| + | *'''Serial Number''' | ||
| + | *'''Employee Number''' | ||
| + | *'''Hands-on Time''' | ||
| + | *'''Cycle Time''' | ||
| + | *'''Unattended time''' | ||
| + | *'''Wait Time''' | ||
| + | |||
| + | At the end of the report provide the total, minimum, maximum, average, and quantity of serials for all the times (hands-on time, unattended time, cycle time, and wait time) add all the Cycle Time reports and Labor by SO/Serial reports as default reports. | ||
| + | |||
| + | Provide the Unit of Measure(UOM) for each time-based data reported (like cycle time, and unattended time). | ||
| + | |||
| + | | ||
| + | |||
| + | | ||
| + | |||
| + | === <span class="mw-headline" id="_Cycle_Time_Report"><span class="mw-headline" id="_Cycle_Time_Report"><span class="mw-headline" id="_Cycle_Time_Report"><span class="mw-headline" id="_Cycle_Time_Report"><span class="mw-headline" id="_Cycle_Time_Report"><span class="mw-headline" id="_Cycle_Time_Report"><span class="mw-headline" id="_Cycle_Time_Report"><span class="mw-headline" id="_Cycle_Time_Report"><span class="mw-headline" id="_Cycle_Time_Report"><span class="mw-headline" id="_.27Cycle_Time_Report.27">''' '''Cycle Time Report</span></span></span></span></span></span></span></span></span></span> === | ||
| + | |||
| + | Cycle Time report displays hands-on time, unattended time, cycle time, and wait time averaged by each process for each part number selected. | ||
| + | |||
| + | | ||
| + | |||
| + | ==== <span class="mw-headline" id="Prerequisites"><span class="mw-headline" id="Prerequisites"><span class="mw-headline" id="Prerequisites"><span class="mw-headline" id="Prerequisites">Prerequisites</span></span></span></span> ==== | ||
| + | |||
| + | ==== <span class="mw-headline" id="Before_Moving_to_the_cycle_time_report:"><span class="mw-headline" id="Before_Moving_to_the_cycle_time_report:"><span class="mw-headline" id="Before_Moving_to_the_cycle_time_report:"><span class="mw-headline" id="Before_Moving_to_the_cycle_time_report:">Before Moving to the cycle time report:</span></span></span></span> ==== | ||
| + | |||
| + | #Set the Generic attribute '''“ps_cylce_time_enable”''' as True. By default this attribute is empty. | ||
| + | |||
| + | ''' '''Navigate through:''''''Administration >Generic Attribute Maintenance''''' | ||
| + | |||
| + | By setting this attribute to true, the Cycle time calculator starts automatically and records the cycle time. | ||
| + | |||
| + | | ||
| + | |||
| + | '''Figure 46: Cycle Time Report''' | ||
| − | + | [[File:MESWEB CycleTime Report.png|border|900px|MESWEB CycleTime Report.png]] | |
| − | + | | |
| − | + | #Choose the parameters - Data source, Partno, Process. | |
| − | + | If the part number is chosen, then choosing the Process name becomes optional | |
| | ||
| − | + | For each process cycle time is the average of all the locations for that process. | |
| − | + | Cycle Time report allows users to filter the report by: | |
| + | |||
| + | *'''Part Numbers: '''Users can optionally select one or multiple parts, this should include product families as well, if a product family is selected provide the cycle time, hands-on time, unattended time, and wait time product family. | ||
| + | *'''Process:''' Users can optionally select one or multiple processes, for searching by process number use the process list box. | ||
| − | + | If a part(s) is selected for the report generation, the selection of process in the parameter can be optional. If a part(s) is not selected then the selection of process should be mandatory in the parameter. It has to be either selected by part(s) or by process(s). | |
| − | + | | |
| − | + | '''<u>Note:</u> '''Date Range (99 days maximum) required field. | |
| − | + | Cycle Time report shows the comparison with the baseline setup in SQC Configuration''':''' | |
| − | + | *'''Baseline column: '''The baseline for a process is the standard time stored in the baseline table for that process by part number. If no baseline is defined in the SQC table display the value as ‘n.a’ | |
| + | *'''Efficiency column:''' Efficiency is ((Cycle time/Baseline Column Value)*100). If the baseline value is ‘n.a.’ display the efficiency value as ‘n.a’ | ||
| − | The report | + | '''<u>Note:</u> '''The cycle time report provides a drill down from cycle time values to the Cycle Time Details report. |
| − | + | | |
| − | + | === <span class="mw-headline" id="Labor_Tracking_Reports"><span class="mw-headline" id="Labor_Tracking_Reports"><span class="mw-headline" id="Labor_Tracking_Reports"><span class="mw-headline" id="Labor_Tracking_Reports"><span class="mw-headline" id="Labor_Tracking_Reports"><span class="mw-headline" id="Labor_Tracking_Reports"><span class="mw-headline" id="Labor_Tracking_Reports">Labor Tracking Reports</span></span></span></span></span></span></span> === | |
| − | + | MESWeb '''Labor Tracking Report '''allows administrators to track employee labor records over a 90-day span. Administrators can then '''Print''', '''Export''', '''Share via Email/Link''', or create a '''Snapshot'''. | |
| − | + | <br/> To access the''' Labor Tracking Report''', the user must go to '''MESWeb > Reports > Default Reports > Labor Tracking'''. | |
| − | + | <br/> '''Figure 47: Labor Tracking - Data Source''' | |
| − | + | ''''''[[File:LaborTrackingDataSource.png|border|900px|LaborTrackingDataSource..png]]'''''' | |
| − | + | ''' ''' | |
| − | + | #'''Choose '''the data source from the '''‘Data Source’ '''drop-down menu. | |
| + | #'''Click '''Next'''.''' | ||
| − | + | ''' ''' | |
| − | + | '''Figure 48: Labor Tracking - Customers''' | |
| − | ''' | + | ''''''[[File:LaborTrackingCustomers.png|border|900px|LaborTrackingCustomers.png]]'''''' |
| − | ''' | + | ''' ''' |
| + | <ol start="3"> | ||
| + | <li>'''A list of customers will be displayed once the data source is selected. '''</li> | ||
| + | <li>'''Select '''the customer desired. Once the customer is chosen, it will appear within the selected box'''.'''</li> | ||
| + | <li>'''Click '''“Next”. </li> | ||
| + | </ol> | ||
| | ||
| − | By | + | '''Figure 49: Labor Tracking - Products''' |
| + | |||
| + | ''''''[[File:MW-LaborTrackingProducts01.png|border|900px|MW-LaborTrackingProducts01.png]]'''''' | ||
| + | |||
| + | ''' ''' | ||
| + | <ol start="6"> | ||
| + | <li>Within '''Step 3''', users will have four '''<u>optional</u>''' parameters to conduct a search. Those options are as follows:</li> | ||
| + | </ol> | ||
| + | |||
| + | *By selecting one or more optional '''Products.''' | ||
| + | *By selecting one or more optional '''Shop Orders.''' | ||
| + | *By selecting one or more optional '''Processes.''' | ||
| + | *By selecting the optional '''Employee.''' | ||
| | ||
| − | + | '''Figure 50: Labor Tracking - Shop Orders''' | |
| + | |||
| + | ''''''[[File:MW-LaborTrackingShopOrders01.png|border|900px|MW-LaborTrackingShopOrders01.png]]'''''' | ||
| + | |||
| + | ''' ''' | ||
| + | |||
| + | Users can search by '''Shop''' '''Order''' by inserting the Shop Order number into the box provided and clicking the refresh button. | ||
| + | |||
| + | ''' ''' | ||
| + | |||
| + | '''Figure 51: Labor Tracking - Processes''' | ||
| + | |||
| + | ''''''[[File:MW-LaborTrackingProcesses01.png|border|900px|MW-LaborTrackingProcesses01.png]]'''''' | ||
| + | |||
| + | ''' ''' | ||
| + | |||
| + | Users can search by '''Processes''' by inserting the processes title into the box provided and clicking the refresh button. | ||
| + | |||
| + | ''' ''' | ||
| + | |||
| + | '''Figure 52: Labor Tracking - Employee''' | ||
| + | |||
| + | ''''''[[File:MW-LaborTrackingEmployee01.png|900px|MW-LaborTrackingEmployee01.png]]'''''' | ||
| + | |||
| + | ''' ''' | ||
| + | |||
| + | Users can search by '''Employee''' by inserting the Employee number into the box provided and clicking the refresh button. | ||
| + | |||
| + | ''' ''' | ||
| − | + | '''Figure 53: Labor Tracking - Report Type''' | |
| + | |||
| + | ''''''[[File:MW-LaborTrackingReportType01.png|border|900px|MW-LaborTrackingReportType01.png]]'''''' | ||
| + | |||
| + | ''' ''' | ||
| + | |||
| + | ==== <span class="mw-headline" id="Report_Types"><span class="mw-headline" id="Report_Types"><span class="mw-headline" id="Report_Types"><span class="mw-headline" id="Report_Types"><span class="mw-headline" id="Report_Types"><span class="mw-headline" id="Report_Types"><span class="mw-headline" id="Report_Types">Report Types</span></span></span></span></span></span></span> ==== | ||
| + | |||
| + | For Labor Tracking, there are different Report Types such as''' Employee Efficiency,''' '''Labor''' '''Tracking''', '''Shop Order Direct,''' and '''Indirect Details.''' | ||
| + | |||
| + | Each one of those reports supports different filters to consume the information of the activity tables. | ||
| + | <ol start="7"> | ||
| + | <li>Upon choosing the desired Report Type, click ‘Next’. </li> | ||
| + | </ol> | ||
| + | |||
| + | ''' ''' | ||
| + | |||
| + | '''Figure 54: Labor Tracking - Report Time''' | ||
| − | + | ''''''[[File:LaborTrackingReportTime01.png|border|900px|LaborTrackingReportTime01.png]]'''''' | |
| − | + | ''' ''' | |
| + | <ol start="8"> | ||
| + | <li>Depending on the previous Report Type chosen, users will then be able to continue with Step 4 by selecting the options desired in each drop-down menu. </li> | ||
| + | <li>'''Select''' the '''Report Time'''. Options are as follows:</li> | ||
| + | </ol> | ||
| + | |||
| + | *'''Hours''' | ||
| + | *'''Minutes''' | ||
| + | <ol start="10"> | ||
| + | <li>'''Select''' the field to '''Group By''', which has a given option based on the Report Type chosen.</li> | ||
| + | <li>Insert the desired time period using the '''From''' and '''To''' options and select the time for each. </li> | ||
| + | </ol> | ||
| − | + | ''' <u>Note:</u> '''Checking the box for the '''Hide on execute''' parameters option will hide the parameters once the report is executed. | |
| − | + | <br/> Click Go. The reports will be displayed as follows based on the Report Type chosen: | |
| − | + | ==== <span class="mw-headline" id="Employee_Efficiency"><span class="mw-headline" id="Employee_Efficiency"><span class="mw-headline" id="Employee_Efficiency"><span class="mw-headline" id="Employee_Efficiency"><span class="mw-headline" id="Employee_Efficiency"><span class="mw-headline" id="Employee_Efficiency"><span class="mw-headline" id="Employee_Efficiency">Employee Efficiency</span></span></span></span></span></span></span> ==== | |
| − | + | When the '''Employee Efficiency''' report is ''''Grouped By' Employee and/or Shift''', the final form will allow users to view:' | |
| − | + | *'''The specific time''' that a member was working on a certain activity. | |
| + | *'''Good:''' quantity of units passed in the period of time selected by each employee. | ||
| + | *'''Scrap:''' quantity of units scrapped in the period of time selected by each employee. | ||
| + | *'''Standard Hours:''' the average time or number of hours that takes to manufacture a unit or assembly. | ||
| + | *'''Actual Indirect Hours:''' total time of indirect activities recorded against specific department/work center throughout Labor Tracking. | ||
| + | *'''Actual Direct Hours:''' elapsed time between the clock in and clock out of Labor activities. | ||
| + | *'''Actual Total Hours:''' this comes from the calculation of total hours of indirect/direct activities recorded by employees against a department. | ||
| + | *'''Run Earned Hours:''' comes from the calculation of actual good parts produced (passed units) * quoted parts per hour (standard run hours). | ||
| + | *'''Run Efficiency Percentage: '''results from the calculation of Actual Total Hours/(Standard Hours * Throughput) *100. | ||
| + | *'''Utilization Percentage:''' comes from the calculation of (Direct Hours/Actual Total Hours) * 100. | ||
| − | + | ''' ''' | |
| − | + | '''Figure 55: Report Type - Employee Efficiency Example (left side)''' | |
| − | + | ''''''[[File:MW-Report Type - EmployeeEffExampleLS.png|900px|MW-Report Type -EmployeeEffExampleLS.png]]'''''' | |
| − | + | ''' ''' | |
| − | + | '''Figure 56: Report Type - Employee Efficiency Example (right side)''' | |
| − | + | ''''''[[File:MW-Report Type - EmployeeEffExampleRS.png|900px|Report Type - EmployeeEffExampleRS.png]]'''''' | |
| − | + | ''' ''' | |
| − | + | <br/> <span class="mw-headline" id="When_the_Labor_Tracking_report_is_Group_By_Shop_Order.2C_Product.2C_Employee.2C_Shift.2C_Process.2C_and.2For_Location.2C_the_final_form_will_allow_users_to_view_the_Shop_Order.2C_Product.2C_Employee.2C_Shift.2C_Process.2C_or_Location.2C_and_the_direct_hours_associated_with_each.">When the Labor Tracking report is '''Group By''' '''Shop Order, Product, Employee, Shift, Process, and/or Location''', the final form will allow users to view the Shop Order, Product, Employee, Shift, Process, or Location, and the direct hours associated with each.</span> | |
| − | + | | |
| − | + | '''Figure 57: Report Type - Labor Tracking Example''' | |
| − | ''' | + | ''''''[[File:RTLaborTrackingExamples01.png|900px|RTLaborTrackingExamples01.png]]'''''' |
| − | ''' | + | ''' ''' |
| | ||
| + | |||
| + | === <span class="mw-headline" id="Shop_Order_Direct"><span class="mw-headline" id="Shop_Order_Direct"><span class="mw-headline" id="Shop_Order_Direct"><span class="mw-headline" id="Shop_Order_Direct"><span class="mw-headline" id="Shop_Order_Direct"><span class="mw-headline" id="Shop_Order_Direct"><span class="mw-headline" id="Shop_Order_Direct">Shop Order Direct</span></span></span></span></span></span></span> === | ||
| + | |||
| + | When the Shop Order Direct report information is '''Group By Shop Order, Employee, Shift, and / or Process''' the final form will allow users to view the employees and the direct hours spent on specific activities. | ||
| + | |||
| + | ''' ''' | ||
| + | |||
| + | '''Figure 58: Report Type - Shop Order Direct Example''' | ||
| + | |||
| + | ''''''[[File:ReportTypeShopOrderDE01.png|900px|ReportTypeShopOrderDE01.png]]'''''' | ||
| + | |||
| + | ''' ''' | ||
| | ||
| − | === <span class="mw-headline" id=" | + | === <span class="mw-headline" id="Indirect_Details"><span class="mw-headline" id="Indirect_Details"><span class="mw-headline" id="Indirect_Details"><span class="mw-headline" id="Indirect_Details"><span class="mw-headline" id="Indirect_Details"><span class="mw-headline" id="Indirect_Details"><span class="mw-headline" id="Indirect_Details"><span class="mw-headline" id="Indirect_Details"><span class="mw-headline" id="Indirect_Details"><span class="mw-headline" id="Indirect_Details"><span class="mw-headline" id="Indirect_Details">Indirect Details</span></span></span></span></span></span></span></span></span></span></span> === |
| + | |||
| + | When the '''Indirect Detailed''' reports are ''''Group By' Employee and/or Shift''', the final form will allow users to view information regarding employees and direct hours spent on specific activities. | ||
| − | + | ''' ''' | |
| + | |||
| + | '''Figure 59: Report Type - Indirect Details Example''' | ||
| − | + | ''''''[[File:ReporTypeIDE01.png|900px|ReportTypeIDE01.png]]'''''' | |
| − | + | | |
| − | + | | |
| − | |||
| − | + | === <span class="mw-headline" id="QCP_Details"><span class="mw-headline" id="QCP_Details"><span class="mw-headline" id="QCP_Details"><span class="mw-headline" id="QCP_Details"><span class="mw-headline" id="QCP_Details"><span class="mw-headline" id="QCP_Details"><span class="mw-headline" id="QCP_Details"><span class="mw-headline" id="QCP_Details"><span class="mw-headline" id="QCP"><span class="mw-headline" id="QCP"><span class="mw-headline" id="QCP_Details">QCP Details</span></span></span></span></span></span></span></span></span></span></span> === | |
| − | + | <span class="mw-headline" id="The_QCP_Checklist_is_a_functionality_that_allows_the_MESWeb_users_to_access_a_set_of_questions_and_answers_done_previously_in_Production_Workbench.">The '''QCP Checklist''' is a functionality that allows the '''MESWeb''' users to access a set of questions and answers done previously in '''Production''' '''Workbench'''.</span> | |
| − | + | To enter the '''QCP Checklist '''the user must go to '''MESWeb>Reports>Default Reports''', there, three different reports are available: '''QCP History, QCP Details, '''and '''QCP Serials'''. | |
| − | + | '''<u>Note:</u> '''The user can access '''QCP History, '''QCP Details''', and '''QCP Serials '''by selecting them.''' | |
| − | + | '''QCP Details''' allows the user to see and customize the information placed into the '''QCP checklist; Employee name, Execution date, Validation date, Action, Approver, and Justification'''. It also allows the user to see the list of the '''current and previous questions and answers, approved or reopened''' related to the selected QCP displayed with a v'''isual indicator''' of whether the answers failed or passed.<br/> ''' ''' | |
| − | + | To access, navigate to '''MESWeb > Reports > Default Reports > QCP Details'''. | |
| − | + | #Select a '''data source'''. | |
| + | #*(Optional) Select '''QCP''' | ||
| + | #*(Optional) Select '''Part Number''' | ||
| + | #*(Optional) Select '''Process''' | ||
| + | #*(Optional) Select '''Locations''' | ||
| + | #*(Optional) Select '''employee''' | ||
| + | #Check QCP obsoletes. | ||
| + | #Filter data by a date range. | ||
| + | #'''Indicate''' if you would like to export just the file. | ||
| + | #'''Select''' whether or not parameters should be hidden when the report is executed. | ||
| + | #*(Optional) Select the interval to refresh the report as needed. | ||
| − | + | | |
| − | + | '''Figure 69: QCP Details parameter''' | |
| − | + | [[File:MESWEB QCP Details parameter.png|900px]] | |
| − | + | | |
| − | + | '''Figure 70: QCP Details Report''' | |
| − | + | [[File:MESWEB QCP Details Report.png|900px]] | |
| − | + | | |
| − | + | '''Figure 71: QCP Details Report Justification''' | |
| − | + | [[File:MESWEB QCP Details Report Justification.png|900px]] | |
| − | + | | |
| − | + | <u>'''Note:'''</u> The color on the sidebar, changes according to the status; Red= Expired, Green= Active | |
| − | + | ''' ''' | |
| − | |||
| − | + | === <span class="mw-headline" id="QCP_History"><span class="mw-headline" id="QCP_History"><span class="mw-headline" id="QCP_History"><span class="mw-headline" id="QCP_History"><span class="mw-headline" id="QCP_History"><span class="mw-headline" id="QCP_History"><span class="mw-headline" id="QCP_History"><span class="mw-headline" id="QCP_History"><span class="mw-headline" id="QCP_History"><span class="mw-headline" id="QCP_History">QCP History</span></span></span></span></span></span></span></span></span></span> === | |
| − | + | <span class="mw-headline"><span class="mw-headline"><span class="mw-headline"><span class="mw-headline"><span class="mw-headline"><span class="mw-headline"><span class="mw-headline"><span class="mw-headline"><span class="mw-headline">To access '''QCP History''', navigate to '''MESWeb > Reports > Default Reports >QCP History.''' Users can get the report by following the parameters given below:</span></span></span></span></span></span></span></span></span> | |
| − | + | #<span class="mw-headline"><span class="mw-headline"><span class="mw-headline"><span class="mw-headline"><span class="mw-headline"><span class="mw-headline"><span class="mw-headline"><span class="mw-headline"><span class="mw-headline">Select a data source.</span></span></span></span></span></span></span></span></span> | |
| + | #*<span class="mw-headline"><span class="mw-headline"><span class="mw-headline"><span class="mw-headline"><span class="mw-headline"><span class="mw-headline"><span class="mw-headline"><span class="mw-headline"><span class="mw-headline">(Optional) Select '''QCP'''</span></span></span></span></span></span></span></span></span> | ||
| + | #*<span class="mw-headline"><span class="mw-headline"><span class="mw-headline"><span class="mw-headline"><span class="mw-headline"><span class="mw-headline"><span class="mw-headline"><span class="mw-headline"><span class="mw-headline">(Optional) Select '''Part Number'''</span></span></span></span></span></span></span></span></span> | ||
| + | #*<span class="mw-headline"><span class="mw-headline"><span class="mw-headline"><span class="mw-headline"><span class="mw-headline"><span class="mw-headline"><span class="mw-headline"><span class="mw-headline"><span class="mw-headline">(Optional) Select '''Process'''</span></span></span></span></span></span></span></span></span> | ||
| + | #*<span class="mw-headline"><span class="mw-headline"><span class="mw-headline"><span class="mw-headline"><span class="mw-headline"><span class="mw-headline"><span class="mw-headline"><span class="mw-headline"><span class="mw-headline">(Optional) Select '''Locations'''</span></span></span></span></span></span></span></span></span> | ||
| + | #*<span class="mw-headline"><span class="mw-headline"><span class="mw-headline"><span class="mw-headline"><span class="mw-headline"><span class="mw-headline"><span class="mw-headline"><span class="mw-headline"><span class="mw-headline">(Optional) Select '''employee'''</span></span></span></span></span></span></span></span></span> | ||
| + | #<span class="mw-headline"><span class="mw-headline"><span class="mw-headline"><span class="mw-headline"><span class="mw-headline"><span class="mw-headline"><span class="mw-headline"><span class="mw-headline"><span class="mw-headline">Check '''QCP obsoletes'''</span></span></span></span></span></span></span></span></span> | ||
| + | #<span class="mw-headline"><span class="mw-headline"><span class="mw-headline"><span class="mw-headline"><span class="mw-headline"><span class="mw-headline"><span class="mw-headline"><span class="mw-headline"><span class="mw-headline">Select a date range</span></span></span></span></span></span></span></span></span> | ||
| + | #<span class="mw-headline"><span class="mw-headline"><span class="mw-headline"><span class="mw-headline"><span class="mw-headline"><span class="mw-headline"><span class="mw-headline"><span class="mw-headline"><span class="mw-headline">'''Indicate''' if you would like to export just the file.</span></span></span></span></span></span></span></span></span> | ||
| + | #<span class="mw-headline"><span class="mw-headline"><span class="mw-headline"><span class="mw-headline"><span class="mw-headline"><span class="mw-headline"><span class="mw-headline"><span class="mw-headline"><span class="mw-headline">Select whether or not parameters should be hidden when report is executed.</span></span></span></span></span></span></span></span></span> | ||
| + | #*<span class="mw-headline"><span class="mw-headline"><span class="mw-headline"><span class="mw-headline"><span class="mw-headline"><span class="mw-headline"><span class="mw-headline"><span class="mw-headline"><span class="mw-headline">(Optional) '''Select''' the interval to refresh the report as needed.</span></span></span></span></span></span></span></span></span> | ||
| − | + | <span class="mw-headline"><span class="mw-headline"><span class="mw-headline"><span class="mw-headline"><span class="mw-headline"><span class="mw-headline"><span class="mw-headline"><span class="mw-headline"><span class="mw-headline">The '''Date Range''' allows the user to search the previously filled/answered '''QCP checklists''' in the selected date ranges; once the user fills in the date and time, they can click the '''Go button'''.</span></span></span></span></span></span></span></span></span> | |
| − | + | '''<u>Note:</u>''' These configurations are showing on the left side of the screen, as displayed in the following image: | |
| − | + | ''' ''' | |
| − | + | '''Figure 70: QCP History parameters ''' | |
| − | + | [[File:MESWeb QCP History parameters .png|900px]] | |
| − | + | | |
| − | The | + | The QCP information will be displayed on the screen, with their respective configuration; '''Name, Version, Action, Approver Name and Number, Process, Part number, Location etc'''. It also shows the '''Effective Date and the Expiration Date''', and also displays the '''Status''' of the QCP; this can be either '''<span style="color:#2ecc71;">Active</span>''' or '''<span style="color:#d35400;">Expired</span>''', and the '''Employee Number and Name''' of the user who filled out the '''QCP checklist'''. |
| − | + | | |
| − | + | '''Figure 72: QCP History Report1''' | |
| − | + | [[File:MESWeb QCP History Report1.png|900px]] | |
| − | + | | |
| − | + | '''Figure 73: QCP History Report2''' | |
| − | + | [[File:MESWeb QCP History Report2.png|900px]] | |
| − | + | The user can drill down from '''QCP History to QCP Details''', by selecting the '''QCP Name '''in the list.<br/> | |
| − | + | '''<u>Note:</u> '''The Effective Date and the Expiration Date information is associated with every Serial Number, scanned between the active period of the checklist and before it expires. | |
| − | + | ''' ''' | |
| − | + | === <span class="mw-headline" id="QCP_Serials"><span class="mw-headline" id="QCP_Serials"><span class="mw-headline" id="QCP_Serials"><span class="mw-headline" id="QCP_Serials"><span class="mw-headline" id="QCP_Serials"><span class="mw-headline" id="QCP_Serials"><span class="mw-headline" id="QCP_Serials"><span class="mw-headline" id="QCP_Serials"><span class="mw-headline" id="QCP_Serials">QCP Serials</span></span></span></span></span></span></span></span></span> === | |
| − | + | To access the '''QCP Serials''', the user can select the option from the '''QCP Details''' page, as displayed in the following image: | |
| − | + | | |
| − | + | '''Figure 64: QCP Serials''' | |
| − | + | '''''[[File:MW-QCPSerials.png|border|900px|MW-QCPSerials.png]]'''''' | |
| − | + | Once this option is selected, the screen will display the '''QCP Serials''', allowing the users to see the list of serials and their respective information, Serial Number, Part Number, Process, Location QCP name, and the QCP version. | |
| − | + | | |
| − | + | '''Figure 65: QCP Serials Detail Chart''' | |
| − | + | '''[[File:MW-SerialsDetailChart.png|border|900px|MW-SerialDetailChart.png]]''' | |
| − | + | ''' ''' | |
| − | + | By selecting the '''Serial Number''', shown in the image above; the user is able to see the '''Unit History'''. | |
| − | + | This allows the user to see detailed information about the '''Serial''' '''Numbers''' and all their activity throughout their lifecycle. | |
| − | + | | |
| − | '''Figure | + | '''Figure 66: Unit History''' |
| − | '''[[File: | + | '''''[[File:MW-Unit History.png|900px|MW-Unit History.png]]'''''' |
| | ||
| − | === <span class="mw-headline" id=" | + | === <span class="mw-headline" id="Shop_Order"><span class="mw-headline" id="Shop_Order"><span class="mw-headline" id="Shop_Order"><span class="mw-headline" id="Shop_Order"><span class="mw-headline" id="Shop_Order"><span class="mw-headline" id="Shop_Order"><span class="mw-headline" id="Shop_Order"><span class="mw-headline" id="Shop_Order_Report"><span class="mw-headline" id="Shop_Order_Report"><span class="mw-headline" id="Shop_Order_Report"><span class="mw-headline" id="Shop_Order_Report"><span class="mw-headline" id="Shop_Order_Report"><span class="mw-headline" id="Shop_Order_Report"><span class="mw-headline" id="Shop_Order_Report"><span class="mw-headline" id="Shop_Order_Report"><span class="mw-headline" id="Shop_Order_Report"><span class="mw-headline" id="Shop_Order_Report"><span class="mw-headline" id="Shop_Order_Report"><span class="mw-headline" id="Shop_Order_Report"><span class="mw-headline" id="Shop_Order_Report"><span class="mw-headline" id="Shop_Order_Report"><span class="mw-headline" id="Shop_Order_Report"><span class="mw-headline" id="Shop_Order_Report"><span class="mw-headline" id="Shop_Order_Report"><span class="mw-headline" id="Shop_Order_Report"><span class="mw-headline" id="Shop_Order_Report"><span class="mw-headline" id="Shop_Order_Report"><span class="mw-headline" id="Shop_Order_Report"><span class="mw-headline" id="Shop_Order_Report"><span class="mw-headline" id="Shop_Order_Report"><span class="mw-headline" id="Shop_Order_Report"><span class="mw-headline" id="Shop_Order_Report"><span class="mw-headline" id="Shop_Order_Report"><span class="mw-headline" id="Shop_Order_Report"><span class="mw-headline" id="Shop_Order_Report"><span class="mw-headline" id="Shop_Order_Report"><span class="mw-headline" id="Shop_Order_Report"><span class="mw-headline" id="Shop_Order_Report"><span class="mw-headline" id="Shop_Order_Report"><span class="mw-headline" id="Shop_Order_Report"><span class="mw-headline" id="Shop_Order_Report"><span class="mw-headline" id="Shop_Order_Report"><span class="mw-headline" id="Shop_Order_Report"><span class="mw-headline" id="Shop_Order_Report"><span class="mw-headline" id="Shop_Order_Report"><span class="mw-headline" id="Shop_Order_Report"><span class="mw-headline" id="Shop_Order_Report"><span class="mw-headline" id="Shop_Order_Report"><span class="mw-headline" id="Shop_Order_Report"><span class="mw-headline" id="Shop_Order_Report"><span class="mw-headline" id="Shop_Order_Report"><span class="mw-headline" id="Shop_Order_Report"><span class="mw-headline" id="Shop_Order_Report"><span class="mw-headline" id="Shop_Order_Report"><span class="mw-headline" id="Shop_Order_Report"><span class="mw-headline" id="Shop_Order_Report"><span class="mw-headline" id="Shop_Order_Report"><span class="mw-headline" id="Shop_Order_Report"><span class="mw-headline" id="Shop_Order_Report"><span class="mw-headline" id="Shop_Order_Report"><span class="mw-headline" id="Shop_Order_Report"><span class="mw-headline" id="Shop_Order_Report"><span class="mw-headline" id="Shop_Order_Report"><span class="mw-headline" id="Shop_Order_Report"><span class="mw-headline" id="Shop_Order_Report"><span class="mw-headline" id="Shop_Order_Report"><span class="mw-headline" id="Shop_Order_Report"><span class="mw-headline" id="Shop_Order_Report"><span class="mw-headline" id="Shop_Order_Report"><span class="mw-headline" id="Shop_Order_Report"><span class="mw-headline" id="Shop_Order_Report"><span class="mw-headline" id="Shop_Order_Report"><span class="mw-headline" id="Shop_Order_Report"><span class="mw-headline" id="Shop_Order_Report"><span class="mw-headline" id="Shop_Order_Report"><span class="mw-headline" id="Shop_Order_Report"><span class="mw-headline" id="Shop_Order_Report"><span class="mw-headline" id="Shop_Order_Report"><span class="mw-headline" id="Shop_Order_Report"><span class="mw-headline" id="Shop_Order_Report"><span class="mw-headline" id="Shop_Order_Report"><span class="mw-headline" id="Shop_Order_Report"><span class="mw-headline" id="Shop_Order_Report"><span class="mw-headline" id="Shop_Order_Report"><span class="mw-headline" id="Shop_Order_Report"><span class="mw-headline" id="Shop_Order_Report">Shop Order</span></span></span></span></span></span></span></span></span></span></span></span></span></span></span></span></span></span></span></span></span></span></span></span></span></span></span></span></span></span></span></span></span></span></span></span></span></span></span></span></span></span></span></span></span></span></span></span></span></span></span></span></span></span></span></span></span></span></span></span></span></span></span></span></span></span></span></span></span></span></span></span></span></span></span></span></span></span></span></span></span></span></span></span></span></span> === |
| − | The | + | The Shop Order Report presents details for one or more shop orders along with all serials associated with them. It is important for users to track shop orders, and in order to do so, a user needs to be able to see the details of the units that comprise the shop order. |
| − | Follow the steps below to generate a | + | Follow the steps below to generate a Shop Order Report: |
| − | 1. Select a Data Source | + | 1. '''Select''' a Data Source |
| − | 2. | + | 2. '''Enter''' up to 1000 Shop Order Numbers |
| − | 3. Select | + | 3. '''Select''' whether or not parameters should be hidden when the report is executed |
| − | 4. Select | + | 4. (Optional) '''Select '''the interval to refresh the report as needed |
| − | + | | |
| − | + | | |
| − | + | | |
| − | + | === <span class="mw-headline" id="Shop_Order_Summary"><span class="mw-headline" id="Shop_Order_Summary"><span class="mw-headline" id="Shop_Order_Summary"><span class="mw-headline" id="Shop_Order_Summary"><span class="mw-headline" id="Shop_Order_Summary"><span class="mw-headline" id="Shop_Order_Summary"><span class="mw-headline" id="Shop_Order_Summary"><span class="mw-headline" id="Shop_Order_Summary"><span class="mw-headline" id="Shop_Order_Summary"><span class="mw-headline" id="Shop_Order_Summary"><span class="mw-headline" id="Shop_Order_Summary"><span class="mw-headline" id="Shop_Order_Summary_Report"><span class="mw-headline" id="Shop_Order_Summary_Report"><span class="mw-headline" id="Shop_Order_Summary_Report"><span class="mw-headline" id="Shop_Order_Summary_Report"><span class="mw-headline" id="Shop_Order_Summary_Report"><span class="mw-headline" id="Shop_Order_Summary_Report"><span class="mw-headline" id="Shop_Order_Summary_Report"><span class="mw-headline" id="Shop_Order_Summary_Report"><span class="mw-headline" id="Shop_Order_Summary_Report"><span class="mw-headline" id="Shop_Order_Summary_Report"><span class="mw-headline" id="Shop_Order_Summary_Report"><span class="mw-headline" id="Shop_Order_Summary_Report"><span class="mw-headline" id="Shop_Order_Summary_Report"><span class="mw-headline" id="Shop_Order_Summary_Report"><span class="mw-headline" id="Shop_Order_Summary_Report"><span class="mw-headline" id="Shop_Order_Summary_Report"><span class="mw-headline" id="Shop_Order_Summary_Report"><span class="mw-headline" id="Shop_Order_Summary_Report"><span class="mw-headline" id="Shop_Order_Summary_Report"><span class="mw-headline" id="Shop_Order_Summary_Report"><span class="mw-headline" id="Shop_Order_Summary_Report"><span class="mw-headline" id="Shop_Order_Summary_Report"><span class="mw-headline" id="Shop_Order_Summary_Report"><span class="mw-headline" id="Shop_Order_Summary_Report"><span class="mw-headline" id="Shop_Order_Summary_Report"><span class="mw-headline" id="Shop_Order_Summary_Report"><span class="mw-headline" id="Shop_Order_Summary_Report"><span class="mw-headline" id="Shop_Order_Summary_Report"><span class="mw-headline" id="Shop_Order_Summary_Report"><span class="mw-headline" id="Shop_Order_Summary_Report"><span class="mw-headline" id="Shop_Order_Summary_Report"><span class="mw-headline" id="Shop_Order_Summary_Report"><span class="mw-headline" id="Shop_Order_Summary_Report"><span class="mw-headline" id="Shop_Order_Summary_Report"><span class="mw-headline" id="Shop_Order_Summary_Report"><span class="mw-headline" id="Shop_Order_Summary_Report"><span class="mw-headline" id="Shop_Order_Summary_Report"><span class="mw-headline" id="Shop_Order_Summary_Report"><span class="mw-headline" id="Shop_Order_Summary_Report"><span class="mw-headline" id="Shop_Order_Summary_Report"><span class="mw-headline" id="Shop_Order_Summary_Report"><span class="mw-headline" id="Shop_Order_Summary_Report"><span class="mw-headline" id="Shop_Order_Summary_Report"><span class="mw-headline" id="Shop_Order_Summary_Report"><span class="mw-headline" id="Shop_Order_Summary_Report"><span class="mw-headline" id="Shop_Order_Summary_Report"><span class="mw-headline" id="Shop_Order_Summary_Report"><span class="mw-headline" id="Shop_Order_Summary_Report"><span class="mw-headline" id="Shop_Order_Summary_Report"><span class="mw-headline" id="Shop_Order_Summary_Report"><span class="mw-headline" id="Shop_Order_Summary_Report"><span class="mw-headline" id="Shop_Order_Summary_Report"><span class="mw-headline" id="Shop_Order_Summary_Report"><span class="mw-headline" id="Shop_Order_Summary_Report"><span class="mw-headline" id="Shop_Order_Summary_Report"><span class="mw-headline" id="Shop_Order_Summary_Report"><span class="mw-headline" id="Shop_Order_Summary_Report"><span class="mw-headline" id="Shop_Order_Summary_Report"><span class="mw-headline" id="Shop_Order_Summary_Report"><span class="mw-headline" id="Shop_Order_Summary_Report"><span class="mw-headline" id="Shop_Order_Summary_Report"><span class="mw-headline" id="Shop_Order_Summary_Report"><span class="mw-headline" id="Shop_Order_Summary_Report"><span class="mw-headline" id="Shop_Order_Summary_Report"><span class="mw-headline" id="Shop_Order_Summary_Report"><span class="mw-headline" id="Shop_Order_Summary_Report"><span class="mw-headline" id="Shop_Order_Summary_Report"><span class="mw-headline" id="Shop_Order_Summary_Report"><span class="mw-headline" id="Shop_Order_Summary_Report"><span class="mw-headline" id="Shop_Order_Summary_Report"><span class="mw-headline" id="Shop_Order_Summary_Report"><span class="mw-headline" id="Shop_Order_Summary_Report"><span class="mw-headline" id="Shop_Order_Summary_Report"><span class="mw-headline" id="Shop_Order_Summary_Report"><span class="mw-headline" id="Shop_Order_Summary_Report"><span class="mw-headline" id="Shop_Order_Summary_Report"><span class="mw-headline" id="Shop_Order_Summary_Report"><span class="mw-headline" id="Shop_Order_Summary_Report"><span class="mw-headline" id="Shop_Order_Summary_Report"><span class="mw-headline" id="Shop_Order_Summary_Report"><span class="mw-headline" id="Shop_Order_Summary_Report"><span class="mw-headline" id="Shop_Order_Summary_Report">Shop Order Summary</span></span></span></span></span></span></span></span></span></span></span></span></span></span></span></span></span></span></span></span></span></span></span></span></span></span></span></span></span></span></span></span></span></span></span></span></span></span></span></span></span></span></span></span></span></span></span></span></span></span></span></span></span></span></span></span></span></span></span></span></span></span></span></span></span></span></span></span></span></span></span></span></span></span></span></span></span></span></span></span></span></span></span></span></span></span></span></span></span></span></span></span></span> === | |
| − | + | The Shop Order Summary Report displays information about the part numbers, the order status, and the number of units in each status of a shop order. | |
| − | + | Follow the steps below to execute the Shop Order Summary Report: | |
| − | + | 1. '''Select '''a Data Source | |
| − | + | 2. '''Enter '''up to 100 Shop Orders (only one per line) | |
| − | + | 3. '''Select''' whether or not parameters should be hidden when the report is executed | |
| − | + | 4. (Optional) '''Select '''the interval to refresh the report as needed | |
The report result is: | The report result is: | ||
| − | '''Figure | + | |
| + | |||
| + | '''Figure 67: Shop Order Summary Report''' | ||
| + | |||
| + | '''[[File:Shop Order Summary Report.png|900px|Shop Order Summary Report.png]] ''' | ||
| + | |||
| + | | ||
| + | |||
| + | By entering one or several Shop orders this report will display information about, their part numbers, order status, and the quantity of units in each status. | ||
| + | |||
| + | | ||
| + | |||
| + | === <span class="mw-headline" id="Solder_Paste_Process_Tracking"><span class="mw-headline" id="Solder_Paste_Process_Tracking"><span class="mw-headline" id="Solder_Paste_Process_Tracking"><span class="mw-headline" id="Solder_Paste_Process_Tracking"><span class="mw-headline" id="Solder_Paste_Process_Tracking"><span class="mw-headline" id="Solder_Paste_Process_Tracking"><span class="mw-headline" id="Solder_Paste_Process_Tracking"><span class="mw-headline" id="Solder_Paste_Process_Tracking"><span class="mw-headline" id="Solder_Paste_Process_Tracking"><span class="mw-headline" id="Solder_Paste_Process_Tracking"><span class="mw-headline" id="Solder_Paste_Process_Tracking">Solder Paste Process Tracking </span></span></span></span></span></span></span></span></span></span></span> === | ||
| − | ''' | + | The '''Solder Paste Process Tracking Report''' details the Process of any items with the '''Solder Paste inventory''', specified by part and serial numbers. It shows the process, with timestamp data. See the steps below the steps to generate the Solder Paste Process Tracking Report |
| + | |||
| + | #Select a '''data source''' | ||
| + | #(Optional) Select a '''Solder Paste P/N''', users can select Starts with/Contains/Ends with the characters | ||
| + | #(Optional) Select a '''Solder Paste S/N''' | ||
| + | #(Optional) Select a '''Process''' | ||
| + | #(Optional) Select a '''Step by''' | ||
| + | #Select a '''date range''' | ||
| + | #Select Display Data as users can select by Web View/Excel File/Google Sheet/XML File/CSV File/Text File | ||
| + | #Select whether or not parameters should be hidden when the report is executed. | ||
| + | #(Optional) Select the interval to refresh the report as needed. | ||
| + | |||
| + | The report result is: | ||
| | ||
| − | + | '''Figure 68: Solder Paste Process Tracking Report Result''' | |
| + | |||
| + | [[File:Process tracking report.png|border|900px|Process tracking report.png]] | ||
| − | + | | |
| − | + | | |
| − | + | === <span class="mw-headline" id="Solder_Paste_Status_Report"><span class="mw-headline" id="Solder_Paste_Status_Report"><span class="mw-headline" id="Solder_Paste_Status_Report"><span class="mw-headline" id="Solder_Paste_Status_Report"><span class="mw-headline" id="Solder_Paste_Status_Report"><span class="mw-headline" id="Solder_Paste_Status_Report"><span class="mw-headline" id="Solder_Paste_Status_Report"><span class="mw-headline" id="Solder_Paste_Status_Report"><span class="mw-headline" id="Solder_Paste_Status_Report"><span class="mw-headline" id="Solder_Paste_Status_Report">Solder Paste Status Report </span></span></span></span></span></span></span></span></span></span> === | |
| − | + | The '''Solder Paste Status Report''' details the status of any items with the '''Solder Paste inventory''', specified by part and serial numbers. It shows the current status, with timestamp data. | |
| − | + | See the steps below the steps to generate a Solder Paste Status Report | |
| − | ''' | + | #'''Select''' a data source |
| + | #(Optional) '''Select''' a Solder Paste P/N | ||
| + | #(Optional) '''Select''' a Solder Paste S/N | ||
| + | #(Optional) '''Select''' a Solder Paste Status | ||
| + | #'''Select''' a date range | ||
| + | #'''Select''' whether or not parameters should be hidden when the report is executed. | ||
| + | #(Optional) '''Select''' the interval to refresh the report as needed. | ||
| − | [[File: | + | The report result is: |
| + | |||
| + | '''Figure 69: Solder Paste Status Report Result''' | ||
| + | |||
| + | ''''''[[File:Solder Paste Status Report Result.png|border|900px|Solder Paste Status Report Result.png]]''''' | ||
| | ||
| − | + | | |
| − | + | | |
| − | |||
| − | + | === <span class="mw-headline" id="Unit_History_Report"><span class="mw-headline" id="Unit_History_Report"><span class="mw-headline" id="Unit_History_Report"><span class="mw-headline" id="Unit_History_Report"><span class="mw-headline" id="Unit_History_Report"><span class="mw-headline" id="Unit_History_Report">Unit History Report</span></span></span></span></span></span> === | |
| + | |||
| + | The Unit History Report gives detailed information about a specific unit and all its activities throughout its lifecycle. This allows users to see information about a specific unit and its activity. | ||
| + | |||
| + | Follow the steps below to generate a Unit History Report: | ||
| + | |||
| + | 1. '''Enter''' up to 150 Serials | ||
| + | |||
| + | 2. '''Select''' whether or not parameters should be hidden when the report is executed | ||
| + | |||
| + | 3. (Optional) '''Select''' the interval to refresh the report as needed | ||
| | ||
| − | + | '''Figure 80: Unit History''' | |
| + | |||
| + | '''[[File:Mw-Unit History.png|900px|Mw-Unit History.png]]''' | ||
| + | |||
| + | Unit History Report now has the capability to query data from the MES Archive integrated into the report. | ||
| + | |||
| + | The '''Archive''' parameter was added to the report to query archive data or only be notified when searched serials have already been archived'''.''' | ||
| + | |||
| + | <br/> '''Figure 81: Unit History''' | ||
| + | |||
| + | '''[[File:Unithistory36.png|RTENOTITLE]]''' | ||
| + | |||
| + | ''' ''' | ||
| + | |||
| + | When the report is executed with the Include Archive parameter selected, it will query Archive data for all searched serials that have been archived. Archived serials will be labeled as such, and data will be presented in the same format as regular serials. Both archived and regular serials can be searched at the same time. | ||
| + | |||
| + | When the report is executed with the Include Archive parameter unselected, serials that have been archived will be labeled as such, and the user will be given the option to click the link in order to get the data from Archive. This is to prevent a longer execution time in case the user is unaware serials have been already archived. | ||
A Report executed with Include Archive selected | A Report executed with Include Archive selected | ||
| − | '''Figure | + | |
| + | |||
| + | '''Figure 82: Unit History''' | ||
| + | |||
| + | '''[[File:Unithistoryrep38.png|900px|Unithistoryrep38.png]]''' | ||
| + | |||
| + | | ||
| + | |||
| + | '''Figure 83: Unit History''' | ||
| + | |||
| + | A report executed with Include Archive selected | ||
| + | |||
| + | '''[[File:Unithistoryrep37.png|900px|Unithistoryrep37.png]]''' | ||
| + | |||
| + | ''' '''A report executed with Include Archive unselected | ||
| + | |||
| + | ''' ''' | ||
| + | |||
| + | | ||
| + | |||
| + | ==== <span class="mw-headline" id="Export_UH"><span class="mw-headline" id="Export_UH"><span class="mw-headline" id="Export_UH"><span class="mw-headline" id="Export_UH"><span class="mw-headline" id="Export_UH"><span class="mw-headline" id="Export_UH"><span class="mw-headline" id="Export_UH"><span class="mw-headline" id="Export_UH">Export UH</span></span></span></span></span></span></span></span> ==== | ||
| + | |||
| + | Allows the user to export the report with the selected format without the render on the screen and to improve the performance. | ||
| + | |||
| + | | ||
| − | [[File: | + | '''Figure 84: Export UH''' |
| + | |||
| + | ''''''[[File:MESWeb Export UH.png|900px|MESWeb Export UH.png]]'''''' | ||
| + | |||
| + | Export UH contains two options to export the file; '''Exclude Measurement Information '''and '''Split by Serial and Export '''as a '''ZIP file.''' | ||
| | ||
| − | + | '''Figure 85: Options for Export UH''' | |
| + | |||
| + | ''''''[[File:MESWeb OptionsforExportUH.png|MESWeb OptionsforExportUH.png]]'''''' | ||
| − | + | '''<u>Note:</u> '''If the users choose to split by serial and export as a Zip if there are multiple serial numbers, the Zip file will create a folder with all the numbers in a file. | |
| − | ''' | + | '''Display Data as '''would allow users to choose from several different kinds of files to download/ view; '''Web view, Excel File, Google Sheet, XML File CSV File, and Text File.''' |
| − | + | ''' ''' | |
| + | |||
| + | '''Unit History '''report has a link where users are able to open the QCP Details report tied to the specific serial number. Once the user, '''selects''' this icon displayed at the location column, it redirects to the QCP Details report. | ||
| + | |||
| + | If the serial number has more than one QCP but belongs to a different location/process, then the system will display separate links for each location/process that has a related QCP. | ||
| | ||
| + | |||
| + | '''Figure 86: Link to QCP Details Report''' | ||
| + | |||
| + | [[File:MESWeb Link to QCP Details Report.png|900px|MESWeb Link to QCP Details Report.png]] | ||
| + | |||
| + | <br/> If the serial has more than one QCP associated to it, it will display the latest QCP checklist information at the top of the QCP details report list. If the serial displayed in Unit History does not have any QCP associated with it, the Unit History report won't display any QCP link. | ||
| | ||
| − | ==== | + | '''Figure 87: QCP Details Report''' |
| + | |||
| + | [[File:MESWeb QCP Details Report.png|900px|MESWeb QCP Details Report.png]] | ||
| + | |||
| + | | ||
| + | |||
| + | ==== <span class="mw-headline" id="Unit_History_With_Multimedia_File"><span class="mw-headline" id="Unit_History_With_Multimedia_File"><span class="mw-headline" id="Unit_History_With_Multimedia_File"><span class="mw-headline" id="Unit_History_With_Multimedia_File"><span class="mw-headline" id="Unit_History_With_Multimedia_File"><span class="mw-headline" id="Unit_History_With_Multimedia_File"><span class="mw-headline" id="Unit_History_With_Multimedia_File">Unit History With Multimedia File </span></span></span></span></span></span></span> ==== | ||
Production Workbench supports Multimedia Data Collection (PDF, Imagen, and Video) and users can take photos using their computer or tablet camera and upload any multimedia file. | Production Workbench supports Multimedia Data Collection (PDF, Imagen, and Video) and users can take photos using their computer or tablet camera and upload any multimedia file. | ||
| − | This will | + | This will be reflected in the Unit History report, where the user is able to see the image upload for the SN. |
For more information about Multimedia files, refer to [https://42qrpt1.42-q.com/mes_wiki/index.php/42Q-MES0145-C_Production_Workbench Production Workbench] SOP. | For more information about Multimedia files, refer to [https://42qrpt1.42-q.com/mes_wiki/index.php/42Q-MES0145-C_Production_Workbench Production Workbench] SOP. | ||
| Line 788: | Line 1,552: | ||
| | ||
| − | '''Figure | + | '''Figure 88: Unit History with Multimedia File Attached''' |
| + | |||
| + | '''[[File:Unit History with Multimedia File Attached.png|900px|Unit History with Multimedia File Attached.png]]''' | ||
| + | |||
| + | ''' ''' | ||
| + | |||
| + | Clicking on the image icon, the attached file will be displayed: | ||
| + | |||
| + | '''Figure 89: Expanded Image''' | ||
| + | |||
| + | '''[[File:Expanded Image.png|900px|Expanded Image.png]]''' | ||
| + | |||
| + | Select the expand icon to see just the image. | ||
| + | |||
| + | ''' ''' | ||
| + | |||
| + | '''Figure 90: Uploaded Image Details''' | ||
| + | |||
| + | '''[[File:Uploaded Image Details.png|900px|Uploaded Image Details.png]]''' | ||
| + | |||
| + | | ||
| + | |||
| + | | ||
| + | |||
| + | ==== <span class="mw-headline" id="Part_Order_Summary_Report"><span class="mw-headline" id="Part_Order_Summary_Report"><span class="mw-headline" id="Part_Order_Summary_Report"><span class="mw-headline" id="Part_Order_Summary_Report"><span class="mw-headline" id="Part_Order_Summary_Report"><span class="mw-headline" id="Part_Order_Summary_Report"><span class="mw-headline" id="Part_Order_Summary_Report">Part Order Summary Report</span></span></span></span></span></span></span> ==== | ||
| + | |||
| + | This report displays the following information about works orders: Part Number, Status, Quantity, and Serial Quantity. It also shows the due date, last activity, and how many days have passed before the due date. | ||
| + | |||
| + | Follow the steps below to generate a Part Order Report: | ||
| + | |||
| + | 1. '''Select''' a Data Source | ||
| + | |||
| + | 2. '''Enter''' up to 500 Part Numbers (one per line) | ||
| − | + | 3. '''Select''' whether or not parameters should be hidden when the report is executed | |
| + | |||
| + | 4. (Optional) '''Select''' the interval to refresh the report as needed | ||
| | ||
| − | + | '''Figure 79: Part Order Summary''' | |
| + | |||
| + | ''''''[[File:SOP-5-I-MES0055-C RA1 Part Order Summary.jpg|900px|RTENOTITLE]]'''''' | ||
| + | |||
| + | | ||
| | ||
| − | + | ==== <span class="mw-headline" id="RTY_Report"><span class="mw-headline" id="RTY_Report"><span class="mw-headline" id="RTY_Report"><span class="mw-headline" id="RTY_Report"><span class="mw-headline" id="RTY_Report"><span class="mw-headline" id="RTY_Report"><span class="mw-headline" id="RTY_Report">RTY Report</span></span></span></span></span></span></span> ==== | |
| − | + | RTY shows how many activities were created by a Global Process. The report can display the results by month, week, or day. | |
| − | Select the | + | Follow the steps below to generate an RTY Report: |
| + | |||
| + | 1. '''Select '''a Data Source | ||
| + | |||
| + | 2. '''Select '''one or more Customers | ||
| + | |||
| + | 3. '''Select''' the Data Range (Start and End Dates) | ||
| + | |||
| + | 4. '''Select''' whether or not parameters should be hidden when the report is executed | ||
| + | |||
| + | 5. (Optional) '''Select''' the interval to refresh the report as needed | ||
| | ||
| − | '''Figure | + | '''Figure 80: RTY Report''' |
| − | [[File: | + | ''''''[[File:SOP-5-I-MES0055-C RA1 RTY Report.jpg|900px|RTENOTITLE]]''''' |
| | ||
| − | + | | |
| − | + | | |
| + | |||
| + | === <span class="mw-headline" id="WIP_Distribution_Report"><span class="mw-headline" id="WIP_Distribution_Report"><span class="mw-headline" id="WIP_Distribution_Report"><span class="mw-headline" id="WIP_Distribution_Report"><span class="mw-headline" id="WIP_Distribution_Report"><span class="mw-headline" id="WIP_Distribution_Report">WIP Distribution Report</span></span></span></span></span></span> === | ||
| + | |||
| + | The WIP Distribution Report is designed to take the parameters specified by the user and return the number of units that are currently in WIP based on those parameters. The WIP Distribution Report can group results in several ways, depending on the user's preferences. The top level of the results offers the ability to drill down to the unit details. The WIP Distribution Report aims to give users the ability to get a snapshot of where their plant s workload is distributed. | ||
| + | |||
| + | Follow the steps below to generate a WIP Distribution Report: | ||
| + | |||
| + | 1. '''Select''' a Data Source | ||
| + | |||
| + | 2. '''Select''' one or more Customers | ||
| + | |||
| + | 3. '''Select''' one or more Products | ||
| + | |||
| + | 4. (Optional) null | ||
| + | |||
| + | 5. '''Select''' one or more Departments | ||
| − | + | 6. '''Select''' one or more Unit Statuses | |
| − | + | 7. (Optional) '''Select''' one or more Processes | |
| − | + | 8. '''Select '''one or more Workstations | |
| − | + | 9. '''Select '''whether or not parameters should be hidden when the report is executed | |
| − | + | 10. (Optional) '''Select''' the interval to refresh the report as needed | |
| | ||
| − | '''Figure | + | '''Figure 81: WIP Distribution Report''' |
| − | '''[[File: | + | '''[[File:MESWebExec31.png|900px|MESWebExec31.png]]''' |
| | ||
| Line 836: | Line 1,664: | ||
| | ||
| − | + | | |
| − | + | === <span class="mw-headline" id="WIP_Serials_Report"><span class="mw-headline" id="WIP_Serials_Report"><span class="mw-headline" id="WIP_Serials_Report"><span class="mw-headline" id="WIP_Serials_Report"><span class="mw-headline" id="WIP_Serials_Report"><span class="mw-headline" id="WIP_Serials_Report">WIP Serials Report</span></span></span></span></span></span> === | |
| + | |||
| + | The WIP (Work in Process) Serials Report displays all the serial numbers that are in production. | ||
| + | |||
| + | Follow the steps below to generate a '''WIP Serial Report:''' | ||
| + | |||
| + | 1. '''Select''' a Data Source | ||
| + | |||
| + | 2. '''Select''' one or more Customers | ||
| + | |||
| + | 3. '''Select''' one or more Products | ||
| + | |||
| + | 4. '''Select''' the order that should be used to filter the results | ||
| + | |||
| + | 5. '''Select '''one or more Departments | ||
| + | |||
| + | 6. '''Select''' one or more Unit Status | ||
| + | |||
| + | 7. '''Select '''one or more ways to group the information | ||
| + | |||
| + | 8. (Optional) '''Select''' a field to group by | ||
| − | + | 9. '''Indicate''' if you would like to display charts or not | |
| − | + | 10. '''Select''' whether or not parameters should be hidden when the report is executed | |
| − | + | 11. (Optional) '''Select''' the interval to refresh the report as needed | |
| − | + | The report result is: | |
| − | + | | |
| − | + | '''Figure 82: WIP Serials''' | |
| − | ''' | + | '''[[File:MW-WIP Serials.png|900px|MW-WIP Serials.png]]''' |
| − | + | | |
| | ||
| Line 860: | Line 1,708: | ||
| | ||
| − | === | + | === <span class="mw-headline" id="Workstation_Monitor_Report"><span class="mw-headline" id="Workstation_Monitor_Report"><span class="mw-headline" id="Workstation_Monitor_Report"><span class="mw-headline" id="Workstation_Monitor_Report"><span class="mw-headline" id="Workstation_Monitor_Report"><span class="mw-headline" id="Workstation_Monitor_Report">Workstation Monitor Report</span></span></span></span></span></span> === |
The Workstation Monitor Report shows how many units have been processed on a particular station. | The Workstation Monitor Report shows how many units have been processed on a particular station. | ||
| Line 866: | Line 1,714: | ||
{| border="0" cellspacing="2" width="100%" | {| border="0" cellspacing="2" width="100%" | ||
|- | |- | ||
| − | | Follow the steps below to generate a | + | | Follow the steps below to generate a Workstation MonitorReport: |
| | | | ||
|} | |} | ||
| − | 1. Select a Data Source | + | 1. '''Select''' a Data Source |
| + | |||
| + | 2. '''Select '''a Customer | ||
| + | |||
| + | 3. '''Select''' a Product | ||
| + | |||
| + | 4. '''Select''' a Workstation | ||
| − | + | 5. '''Select''' the Date and Time Range for the Shift | |
| − | + | 6. '''Enter''' the start time for the first break (format: HH:mm) | |
| − | + | 7. '''Enter''' the end time for the first break (HH:mm) | |
| − | + | 8. (Optional) '''Enter '''the start time for the second break (HH:mm) | |
| − | + | 9. (Optional) '''Enter''' the end time for the second break (HH:mm) | |
| − | + | 10. (Optional) '''Enter''' the start time for the third break (HH:mm) | |
| − | + | 11. (Optional) '''Enter '''the end time for the third break (HH:mm) | |
| − | + | 12. '''Enter''' UPH target. | |
| − | + | 13. '''Select '''whether or not parameters should be hidden when the report is executed | |
| − | + | 14. (Optional) '''Select''' the interval to refresh the report as needed | |
| − | + | | |
| − | + | '''Figure 83: Workstation Monitor''' | |
| − | + | ''''''[[File:SOP-5-I-MES0055-C RA1 Workstation Monitor.jpg|900px|RTENOTITLE]]'''''' | |
| − | + | | |
| − | + | | |
| | ||
| − | === <span class="mw-headline" id=" | + | === <span class="mw-headline" id="Yield_.26_Defect_Report"><span class="mw-headline" id="Yield_.26_Defect_Report"><span class="mw-headline" id="Yield_.26_Defect_Report"><span class="mw-headline" id="Yield_.26_Defect_Report"><span class="mw-headline" id="Yield_.26_Defect_Report"><span class="mw-headline" id="Yield_.26_Defect_Report">Yield & Defect Report</span></span></span></span></span></span> === |
| − | The | + | The purpose of the Yield & Defect Report is to give users a high-level overview of progress. It lists the total number of units with activity, pass/fail quantity, and the yield for each process that is selected (filtered by other parameters as well). From there users can see details about the most common defects for a given process as well as details about each unit. |
| + | |||
| + | Managers can use this information to pinpoint the areas on the floor that require their attention and discover why. To execute this report, the user must be in Execution Module, where he/she should select the Reports menu and navigate to Default Reports Yield & Defect Report. | ||
| − | Follow the steps below to generate a | + | Follow the steps below to generate a Yield & Defect Report: |
1. Select a Data Source | 1. Select a Data Source | ||
| Line 916: | Line 1,772: | ||
3. Select one or more Products | 3. Select one or more Products | ||
| − | 4. Select the | + | 4. Select one or more Processes |
| + | |||
| + | 5. Select one or more Lines | ||
| + | |||
| + | 6. Select a Pass to view | ||
| + | |||
| + | 7. Select one or more Shifts | ||
| + | |||
| + | 8. Select one or more Workstations | ||
| + | |||
| + | 9. Enter a Date Range or select one or more Orders | ||
| + | |||
| + | 10. Select a field to group by | ||
| + | |||
| + | 11. (Optional) Select a second field to group by | ||
| + | |||
| + | 12. Choose whether to include moving units | ||
| + | |||
| + | 13. Indicate if you would like to consider "No Fault Found" as passes | ||
| + | |||
| + | 14. Indicate if you would like to view graphs | ||
| + | |||
| + | 15. Select whether or not parameters should be hidden when the report is executed | ||
| + | |||
| + | 16. (Optional) Select the interval to refresh the report as needed | ||
| + | |||
| + | The report result is: | ||
| + | |||
| + | | ||
| + | |||
| + | '''Figure 84: Yield & Defect Report''' | ||
| + | |||
| + | [[File:Yield Defect.png|900px|Yield Defect.png]] | ||
| + | |||
| + | | ||
| + | |||
| + | | ||
| + | |||
| + | === <span class="mw-headline" id="Yield_Evolution_Report"><span class="mw-headline" id="Yield_Evolution_Report"><span class="mw-headline" id="Yield_Evolution_Report"><span class="mw-headline" id="Yield_Evolution_Report"><span class="mw-headline" id="Yield_Evolution_Report"><span class="mw-headline" id="Yield_Evolution_Report">Yield Evolution Report</span></span></span></span></span></span> === | ||
| + | |||
| + | This report displays the percentage of success of the product for a determined period (Hour/Day/Week/Month). Users can view charts of this data and have tabular data presenting the hour/date/unit/passed/yield of a product. This data is presented via "All Products". | ||
| + | |||
| + | A drilldown report, which offers more details about the product, is available for unit/passed/failed. To execute this report, the user must be in Execution Module, where he/she should select the Reports menu and navigate to Default Reports Yield Evolution Report. | ||
| + | |||
| + | Follow the steps below to generate a Yield Evolution Report: | ||
| − | + | 1. '''Select''' a Data Source | |
| − | + | 2. '''Select''' one or more Customers | |
| − | + | 3. '''Select''' one or more Products | |
| − | + | 4. '''Select''' one or more Processes | |
| − | + | 5. '''Select '''one or more Lines | |
| − | + | 6. '''Select''' a pass to view | |
| − | 11. (Optional) Select the interval to refresh the report as needed | + | 7. '''Select '''one or more Shifts |
| + | |||
| + | 8. '''Set '''the values for the Evolution Parameter | ||
| + | |||
| + | 9. '''Select''' Start Date | ||
| + | |||
| + | 10. '''Select''' which field to group by first | ||
| + | |||
| + | 11. (Optional) '''Select '''which field to group by the second | ||
| + | |||
| + | 12. '''Choose '''whether to include moving units | ||
| + | |||
| + | 13. '''Indicate''' if you would like to display charts | ||
| + | |||
| + | 14. '''Select '''whether or not parameters should be hidden when the report is executed | ||
| + | |||
| + | 15. (Optional) '''Select '''the interval to refresh the report as needed | ||
The report result is: | The report result is: | ||
| − | + | | |
| − | [[File: | + | '''Figure 85: Yield Evolution Report''' |
| + | |||
| + | ''''''[[File:SOP-5-I-MES0055-C RA1 Yield Evolution Report.jpg|900px|RTENOTITLE]]'''''' | ||
| | ||
| − | + | | |
| | ||
| − | The | + | === <span class="mw-headline" id="Yield_Serials_Report"><span class="mw-headline" id="Yield_Serials_Report"><span class="mw-headline" id="Yield_Serials_Report"><span class="mw-headline" id="Yield_Serials_Report"><span class="mw-headline" id="Yield_Serials_Report">Yield Serials Report</span></span></span></span></span> === |
| + | |||
| + | The Yield Serials Report displays the following information: Serial Number, Product, Workstation where the action occurred, Serial Quantity, Date of Action, and the Action. | ||
| + | |||
| + | Follow the steps below to generate a Yield Serials Report: | ||
| − | + | 1. '''Select '''a Data Source | |
| + | |||
| + | 2. '''Select '''one or more Customers | ||
| + | |||
| + | 3. '''Select '''one or more Products | ||
| − | + | 4. '''Select''' one or more Processes | |
| − | |||
| − | |||
| − | |||
| − | |||
| − | |||
| − | |||
| − | + | 5. (Optional) '''Select''' one or more Lines | |
| − | ''' | + | 6. '''Select''' a pass to view |
| − | ''' | + | 7. (Optional) '''Select '''one or more Shifts |
| − | + | 8. (Optional) '''Select '''one or more Global Processes | |
| − | + | 9. (Optional) '''Select''' one or more Workstations | |
| − | + | 10. (Optional) '''Filter''' Data by a Date Range | |
| − | + | 11. (Optional) '''Select the '''number of Shop Orders | |
| − | + | 12. '''Select''' one or more Actions | |
| − | + | 13. '''Select '''whether or not parameters should be hidden when the report is executed | |
| − | + | 14. (Optional) '''Select '''the interval to refresh the report as needed | |
| − | + | The report result is: | |
| − | + | | |
| − | '''Figure | + | '''Figure 86: Yield Serials Report''' |
| − | '''[[File: | + | ''''''[[File:MW-Yield Serials Report.png|900px|RTENOTITLE]]'''''' |
| | ||
| Line 988: | Line 1,908: | ||
| | ||
| − | = <span class="mw-headline" id=" | + | === <span class="mw-headline" id="Top_Defect_Evolution_Report"><span class="mw-headline" id="Top_Defect_Evolution_Report"><span class="mw-headline" id="Top_Defect_Evolution_Report"><span class="mw-headline" id="Top_Defect_Evolution_Report"><span class="mw-headline" id="Top_Defect_Evolution_Report"><span class="mw-headline" id="Top_Defect_Evolution_Report"><span class="mw-headline" id="Top_Defect_Evolution_Report"><span class="mw-headline" id="Top_Defect_Evolution_Report"><span class="mw-headline" id="Top_Defect_Evolution_Report"><span class="mw-headline" id="Top_Defect_Evolution_Report"><span class="mw-headline" id="Top_Defect_Evolution_Report"><span class="mw-headline" id="Top_Defect_Evolution_Report"><span class="mw-headline" id="Top_Defect_Evolution_Report"><span class="mw-headline" id="Top_Defect_Evolution_Report"><span class="mw-headline" id="Top_Defect_Evolution_Report"><span class="mw-headline" id="Top_Defect_Evolution_Report"><span class="mw-headline" id="Top_Defect_Evolution_Report"><span class="mw-headline" id="Top_Defect_Evolution_Report"><span class="mw-headline" id="Top_Defect_Evolution_Report"><span class="mw-headline" id="Top_Defect_Evolution_Report"><span class="mw-headline" id="Top_Defect_Evolution_Report"><span class="mw-headline" id="Top_Defect_Evolution_Report"><span class="mw-headline" id="Top_Defect_Evolution_Report"><span class="mw-headline" id="Top_Defect_Evolution_Report"><span class="mw-headline" id="Top_Defect_Evolution_Report"><span class="mw-headline" id="Top_Defect_Evolution_Report"><span class="mw-headline" id="Top_Defect_Evolution_Report"><span class="mw-headline" id="Top_Defect_Evolution_Report"><span class="mw-headline" id="Top_Defect_Evolution_Report"><span class="mw-headline" id="Top_Defect_Evolution_Report"><span class="mw-headline" id="Top_Defect_Evolution_Report"><span class="mw-headline" id="Top_Defect_Evolution_Report"><span class="mw-headline" id="Top_Defect_Evolution_Report"><span class="mw-headline" id="Top_Defect_Evolution_Report"><span class="mw-headline" id="Top_Defect_Evolution_Report"><span class="mw-headline" id="Top_Defect_Evolution_Report"><span class="mw-headline" id="Top_Defect_Evolution_Report"><span class="mw-headline" id="Top_Defect_Evolution_Report"><span class="mw-headline" id="Top_Defect_Evolution_Report"><span class="mw-headline" id="Top_Defect_Evolution_Report"><span class="mw-headline" id="Top_Defect_Evolution_Report"><span class="mw-headline" id="Top_Defect_Evolution_Report"><span class="mw-headline" id="Top_Defect_Evolution_Report"><span class="mw-headline" id="Top_Defect_Evolution_Report"><span class="mw-headline" id="Top_Defect_Evolution_Report"><span class="mw-headline" id="Top_Defect_Evolution_Report"><span class="mw-headline" id="Top_Defect_Evolution_Report"><span class="mw-headline" id="Top_Defect_Evolution_Report"><span class="mw-headline" id="Top_Defect_Evolution_Report"><span class="mw-headline" id="Top_Defect_Evolution_Report"><span class="mw-headline" id="Top_Defect_Evolution_Report"><span class="mw-headline" id="Top_Defect_Evolution_Report"><span class="mw-headline" id="Top_Defect_Evolution_Report"><span class="mw-headline" id="Top_Defect_Evolution_Report"><span class="mw-headline" id="Top_Defect_Evolution_Report"><span class="mw-headline" id="Top_Defect_Evolution_Report"><span class="mw-headline" id="Top_Defect_Evolution_Report"><span class="mw-headline" id="Top_Defect_Evolution_Report"><span class="mw-headline" id="Top_Defect_Evolution_Report"><span class="mw-headline" id="Top_Defect_Evolution_Report"><span class="mw-headline" id="Top_Defect_Evolution_Report"><span class="mw-headline" id="Top_Defect_Evolution_Report"><span class="mw-headline" id="Top_Defect_Evolution_Report"><span class="mw-headline" id="Top_Defect_Evolution_Report"><span class="mw-headline" id="Top_Defect_Evolution_Report"><span class="mw-headline" id="Top_Defect_Evolution_Report"><span class="mw-headline" id="Top_Defect_Evolution_Report"><span class="mw-headline" id="Top_Defect_Evolution_Report"><span class="mw-headline" id="Top_Defect_Evolution_Report"><span class="mw-headline" id="Top_Defect_Evolution_Report"><span class="mw-headline" id="Top_Defect_Evolution_Report"><span class="mw-headline" id="Top_Defect_Evolution_Report"><span class="mw-headline" id="Top_Defect_Evolution_Report"><span class="mw-headline" id="Top_Defect_Evolution_Report"><span class="mw-headline" id="Top_Defect_Evolution_Report"><span class="mw-headline" id="Top_Defect_Evolution_Report"><span class="mw-headline" id="Top_Defect_Evolution_Report"><span class="mw-headline" id="Top_Defect_Evolution_Report"><span class="mw-headline" id="Top_Defect_Evolution_Report"><span class="mw-headline" id="Top_Defect_Evolution_Report"><span class="mw-headline" id="Top_Defect_Evolution_Report"><span class="mw-headline" id="Top_Defect_Evolution_Report"><span class="mw-headline" id="Top_Defect_Evolution_Report"><span class="mw-headline" id="Top_Defect_Evolution_Report"><span class="mw-headline" id="Top_Defect_Evolution_Report"><span class="mw-headline" id="Top_Defect_Evolution_Report"><span class="mw-headline" id="Top_Defect_Evolution_Report">Top Defect Evolution Report</span></span></span></span></span></span></span></span></span></span></span></span></span></span></span></span></span></span></span></span></span></span></span></span></span></span></span></span></span></span></span></span></span></span></span></span></span></span></span></span></span></span></span></span></span></span></span></span></span></span></span></span></span></span></span></span></span></span></span></span></span></span></span></span></span></span></span></span></span></span></span></span></span></span></span></span></span></span></span></span></span></span></span></span></span></span></span> === |
| + | |||
| + | The Top Defect Evolution Report allows users to have a better view of defects registered in MESR for one or more products. Those defects are classified by defect name, which produces a sum (number of defects and percent defect from total) of defects found in a given range for the specific defect. This report also lists the defect total based on a range of time. | ||
| + | |||
| + | Follow the steps below to generate a Top Defect Evolution Report: | ||
| + | |||
| + | 1. '''Select '''a Data Source | ||
| + | |||
| + | 2. '''Select''' one or more Customers | ||
| + | |||
| + | 3. '''Select '''one or more Products | ||
| + | |||
| + | 4. '''Select''' one or more Processes | ||
| + | |||
| + | 5. '''Select''' one or more Lines | ||
| + | |||
| + | 6. '''Select''' a Pass to view | ||
| + | |||
| + | 7. '''Select '''one or more Shifts | ||
| + | |||
| + | 8. '''Set''' the values for the Evolution Parameter | ||
| + | |||
| + | 9. '''Select''' Start Date | ||
| + | |||
| + | 10. '''Select''' which field to group by first | ||
| + | |||
| + | 11. (Optional) '''Select '''which field to group by the second | ||
| + | |||
| + | 12. '''Select '''the type of report you want to run | ||
| + | |||
| + | 13. '''Indicate '''if you would like to view graphs, and, if so, select the type | ||
| + | |||
| + | 14. '''Select '''whether or not parameters should be hidden when the report is executed | ||
| + | |||
| + | 15. (Optional) '''Select '''the interval to refresh the report as needed | ||
| + | |||
| + | The report result is: | ||
| + | |||
| + | | ||
| − | + | '''Figure 87: Top Defect Evolution Report''' | |
| − | + | '''''[[File:SOP-5-I-MES0055-C RA1 Top Defect Evolution Report.jpg|900px|RTENOTITLE]]'''''' | |
| | ||
| − | + | | |
| − | + | | |
| − | + | | |
| | ||
| Line 1,006: | Line 1,964: | ||
| | ||
| − | == <span class="mw-headline" id=" | + | = <span class="mw-headline" id="OEE_Drill_Down"><span class="mw-headline" id="OEE_Drill_Down"><span class="mw-headline" id="OEE_Drill_Down"><span class="mw-headline" id="OEE_Drill_Down"><span class="mw-headline" id="OEE_Drill_Down"><span class="mw-headline" id="OEE_Drill_Down"><span class="mw-headline" id="OEE_Drill_Down"><span class="mw-headline" id="OEE_Drill_Down">OEE Drill Down</span></span></span></span></span></span></span></span> = |
| + | |||
| + | To view each report in detail and its corresponding work orders | ||
| + | |||
| + | == <span class="mw-headline" id="Downtime_Problem_Trend_And_Frequency"><span class="mw-headline" id="Downtime_Problem_Trend_And_Frequency"><span class="mw-headline" id="Downtime_Problem_Trend_And_Frequency">Downtime Problem Trend And Frequency</span></span></span> == | ||
| + | |||
| + | The Downtime Problem Trend and Frequency Report shows production line patterns over time. | ||
| + | |||
| + | #Select '''Data Source'''. | ||
| + | #Select '''Next'''. | ||
| + | #Select Site and Date Range: Select the time period (To/From) for the report using the drop-down calendar. | ||
| + | #Select Parameters in Step 3 | ||
| + | |||
| + | *'''By''': Select time frame: Month, Week, or Day. (Week is the default). | ||
| + | *'''Display by''':: Select if users would like the chart to display the number of times the problem occurred (Occurrences) or the time period during which the problem persisted (Duration). | ||
| + | *'''KPI By''': Select the Key Performance Indicator the chart will show: Problem, Problem Type, Problem Category, Location, Line, Project, Asset Type, Asset ID, or Overall. | ||
| + | *'''Production PN''': (Optional) Select the PN to analyze. | ||
| + | |||
| + | <u>'''Note'''</u>: PN reports will show data about the product being built. | ||
| + | |||
| + | *Production WO: (Optional) Select the Production WO analysis. | ||
| + | |||
| + | <u>'''Note'''</u>: Work Order refers to the work order assigned in Oracle, and will show data connected to the product build. | ||
| + | |||
| + | *Non Stop: (Optional. Default is checked): Check the box to view data that pertains to machinery problems on lines that are still running (nonstop). Uncheck to view only lines which have been shut down due to machinery problems. | ||
| + | *Location: (Optional) Select the building, floor, level, etc., etc. Department, Location, or Line. | ||
| + | *Production Line: (Optional) Select the manufacturing line. | ||
| + | *Asset: (Optional): Select the individual Asset to analyze downtime trends. | ||
| + | *Asset Type: (Optional) Select the machine (Asset) type to analyze. | ||
| + | *WO Project: (Optional) Select the Work Order Project from Oracle’s database to analyze. | ||
| + | *Problem Category: (Optional): Select data to display according to a specific Asset Problem (e.g. Misalignment, Jammed). Asset Problems are configured in CMMS Asset. | ||
| + | *Problem Type: (Optional): Select data to display according to a specific Asset Problem Type (e.g. Damaged Sensor). Asset Problems are configured in CMMS Asset. | ||
| + | <ol start="4"> | ||
| + | <li>Set Parameters in Step 4:</li> | ||
| + | </ol> | ||
| + | |||
| + | *Problem: (Optional): Select the Problem for display in the Downtime Trend Report. | ||
| + | *Display Data as: (Checked by default) Uncheck to see parameters displayed next to the report. | ||
| + | *Refresh Rate: (Do not Refresh is default) Users can change the refresh rate by minutes up to one hour. | ||
| + | <ol start="5"> | ||
| + | <li>Select '''Go'''.</li> | ||
| + | </ol> | ||
| + | |||
| + | '''Figure 90: Downtime Trend and Frequency Report''' | ||
| + | |||
| + | [[File:Figure 68- Downtime Trend and Frequency Report2.png|border|800px|Figure 68- Downtime Trend and Frequency Report2.png]] | ||
| + | |||
| + | == <span class="mw-headline" id="Downtime_Root_Cause_Trend_And_Frequency"><span class="mw-headline" id="Downtime_Root_Cause_Trend_And_Frequency"><span class="mw-headline" id="Downtime_Root_Cause_Trend_And_Frequency">Downtime Root Cause Trend And Frequency</span></span></span> == | ||
| + | |||
| + | The Downtime Root Cause Trend And Frequency Report can show the Downtime Root Cause Trend chart. | ||
| + | |||
| + | Step 1 | ||
| + | |||
| + | *Select a data source | ||
| + | |||
| + | Step 2 | ||
| + | |||
| + | *Select a plant site | ||
| + | *Select the start date | ||
| + | *(Optional) Select a the end date(default Today) | ||
| + | *Select how the graphic is going to show the date format. | ||
| + | |||
| + | Step 3 | ||
| − | + | *(Optional) Enter a production PN. | |
| + | *(Optional) Enter a production WO. | ||
| + | *Select if including non stop. | ||
| + | *(Optional) Select a location | ||
| + | *(Optional) Select a production line | ||
| + | *(Optional) Select an asset | ||
| + | *(Optional) Select a asset type | ||
| + | *(Optional) Select a WO project | ||
| + | *(Optional) Select the Root Cause Category | ||
| − | + | Step 4 | |
| − | |||
| − | |||
| − | |||
| − | + | *(Optional) Select the Root Cause Name | |
| + | *Indicate if you would like to export just the file. | ||
| + | *Select whether or not parameters should be hidden when the report is executed. | ||
| + | *(Optional) Select the interval to refresh the report as needed. | ||
| + | |||
| + | Select '''Go'''. | ||
| + | |||
| + | '''Figure 91: Downtime Root Cause Trend And Frequency''' | ||
| + | |||
| + | [[File:Figure- Downtime Root Cause Trend And Frequency.png|border|800px|Figure- Downtime Root Cause Trend And Frequency.png]] | ||
| + | |||
| + | <span class="mw-headline" id=""><span class="mw-headline" id=""> </span></span> | ||
| | ||
| − | '''Figure | + | == <span class="mw-headline" id="History_Status"><span class="mw-headline" id="History_Status"><span class="mw-headline" id="History_Status"><span class="mw-headline" id="History_Status">History Status</span></span></span></span> == |
| + | |||
| + | Users can view the history status by the history status report with Asset name, time to repair, time between Failures, Problem Type. | ||
| + | |||
| + | Step 1 | ||
| + | |||
| + | *Select a data source. | ||
| + | |||
| + | Step 2 | ||
| + | |||
| + | *Select a site | ||
| + | |||
| + | Step 3 | ||
| + | |||
| + | *Select an asset | ||
| + | *Date Range | ||
| + | *Indicate if you would like to export just the file. | ||
| + | *Select whether or not parameters should be hidden when the report is executed. | ||
| + | *(Optional) Select the interval to refresh the report as needed. | ||
| + | |||
| + | Select '''Go'''. | ||
| + | |||
| + | '''Figure 92: History Status Report''' | ||
| + | |||
| + | [[File:History status reports1.png|border|800px|History status reports1.png]] | ||
| + | |||
| + | == <span class="mw-headline" id="OEE_Asset_Status_Problem"><span class="mw-headline" id="OEE_Asset_Status_Problem"><span class="mw-headline" id="OEE_Asset_Status_Problem">OEE Asset Status Problem</span></span></span> == | ||
| + | |||
| + | The OEE Asset Status Problem Report can show the Asset’s status and Problem lists with the Asset ID, Status, Problem Type, Problem Name, Start Date, and End Date. | ||
| + | |||
| + | Step 1 | ||
| + | |||
| + | *Select a data source | ||
| + | |||
| + | Step 2 | ||
| − | '''[[File: | + | *Select a site |
| + | |||
| + | Step 3 | ||
| + | |||
| + | *Select one of the parameters Location, Line, or Asset. | ||
| + | *Select the status you want to see. | ||
| + | *Filter data by a date range. | ||
| + | *Indicate if you would like to export just the file. | ||
| + | *Select whether or not parameters should be hidden when the report is executed. | ||
| + | *(Optional) Select the interval to refresh the report as needed. | ||
| + | |||
| + | Select '''Go''' | ||
| + | |||
| + | '''Figure 93: OEE Asset Status Problem Report''' | ||
| + | |||
| + | [[File:OEE Asset Status Problem report.png|border|800px|OEE Asset Status Problem report.png]] | ||
| + | |||
| + | == <span class="mw-headline" id="OEE_Asset_Status_Trend"><span class="mw-headline" id="OEE_Asset_Status_Trend"><span class="mw-headline" id="OEE_Asset_Status_Trend">OEE Asset Status Trend</span></span></span> == | ||
| + | |||
| + | The OEE Asset Status Trend Report can show the Asset Status Occurrences and Asset Status Duration charts.<br/> Step 1 | ||
| + | |||
| + | *Select a data source | ||
| + | |||
| + | Step 2 | ||
| + | |||
| + | *Select a site | ||
| + | |||
| + | Step 3 | ||
| + | |||
| + | *Select one of the parameters Location, Line or Asset. | ||
| + | *Filter data by a date range. | ||
| + | *Select the chart you want to see. | ||
| + | *Indicate if you would like to export just the file. | ||
| + | *Select whether or not parameters should be hidden when the report is executed. | ||
| + | *(Optional) Select the interval to refresh the report as needed. | ||
| + | |||
| + | Select '''Go'''. | ||
| + | |||
| + | '''Figure 94: OEE Asset Status Trend - Data Source''' | ||
| + | |||
| + | '''[[File:OEE Asset Status Trend - Data Source.png|border|OEE Asset Status Trend - Data Source.png]]''' | ||
| + | |||
| + | '''Figure 95: OEE Asset Status Trend Report''' | ||
| + | |||
| + | [[File:OEE Asset Status Trend Report.png|border|800px|OEE Asset Status Trend Report.png]] | ||
| + | |||
| + | == <span class="mw-headline" id="OEE_Availability"><span class="mw-headline" id="OEE_Availability"><span class="mw-headline" id="OEE_Availability">OEE Availability</span></span></span> == | ||
| + | |||
| + | The OEE Availability Report can show the OEE availability with the WO, Asset, Shop Order, Downtime, Uptime, Problem and Root Cause. | ||
| + | |||
| + | Step 1 | ||
| + | |||
| + | *Select a data source. | ||
| + | |||
| + | Step 2 | ||
| + | |||
| + | *select a Site | ||
| + | |||
| + | Step 3 | ||
| + | |||
| + | *Asset ID (Asset Name) | ||
| + | *From Date | ||
| + | *To date | ||
| + | *Indicate if you would like to export just the file. | ||
| + | *Select whether or not parameters should be hidden when the report is executed. | ||
| + | *(Optional) Select the interval to refresh the report as needed. | ||
| + | |||
| + | Select '''Go'''. | ||
| + | |||
| + | '''Figure 96: OEE Availability Report''' | ||
| + | |||
| + | [[File:OEE Availability Report.png|border|800px|OEE Availability Report.png]] | ||
| + | |||
| + | == <span class="mw-headline" id="OEE_By_Asset"><span class="mw-headline" id="OEE_By_Asset"><span class="mw-headline" id="OEE_By_Asset">OEE By Asset</span></span></span> == | ||
| + | |||
| + | The OEE By Asset Report can show the OEE charts by Asset. | ||
| + | |||
| + | Step 1 | ||
| + | |||
| + | *Select a data source | ||
| + | |||
| + | Step 2 | ||
| + | |||
| + | *Select a site | ||
| + | |||
| + | Step 3 | ||
| + | |||
| + | *Select one of the parameters, Department, Location, Line or Asset. | ||
| + | *(Optional) Select a time range type | ||
| + | *(Optional) Filter data by a date range. | ||
| + | *Select the chart you want to see. | ||
| + | *Indicate if you would like to export just the file. | ||
| + | *Select whether or not parameters should be hidden when the report is executed. | ||
| + | *(Optional) Select the interval to refresh the report as needed. | ||
| + | |||
| + | Select '''Go'''. | ||
| + | |||
| + | '''Figure 97: OEE By Asset Report''' | ||
| + | |||
| + | '''[[File:OEE By Asset Report.png|border|800px|OEE By Asset Report.png]]''' | ||
| + | |||
| + | == <span class="mw-headline" id="OEE_Performance"><span class="mw-headline" id="OEE_Performance"><span class="mw-headline" id="OEE_Performance">OEE Performance</span></span></span> == | ||
| + | |||
| + | The OEE Performance Report can show the OEE Performance lists with the Asset/Line, Time Range, Target QTY and Finished QTY. | ||
| + | |||
| + | Step 1 | ||
| + | |||
| + | *Select a data source. | ||
| + | |||
| + | Step 2 | ||
| + | |||
| + | *select a Site | ||
| + | |||
| + | Step 3 | ||
| + | |||
| + | *Asset ID (Asset Name) | ||
| + | *From Date | ||
| + | *To Date | ||
| + | *Indicate if you would like to export just the file. | ||
| + | *Select whether or not parameters should be hidden when the report is executed. | ||
| + | *(Optional) Select the interval to refresh the report as needed. | ||
| + | |||
| + | Select '''Go'''.<br/> '''Figure 98: OEE Performance Report''' | ||
| + | |||
| + | [[File:OEE Performance Report.png|border|800px|OEE Performance Report.png]] <br/> | ||
| + | |||
| + | == <span class="mw-headline" id="OEE_Performance_Details"><span class="mw-headline" id="OEE_Performance_Details"><span class="mw-headline" id="OEE_Performance_Details">OEE Performance Details</span></span></span> == | ||
| + | |||
| + | The OEE Performance Details Report can show the OEE Performance Details lists with the Asset, Finished QTY, Serial Record Date, Part Number, Process, WorkStation and Serial. | ||
| + | |||
| + | Users can also go to the Unit History Report from this Details report by clicking on the Serial column. | ||
| + | |||
| + | Step 1 | ||
| + | |||
| + | *Select a data source. | ||
| + | |||
| + | Step 2 | ||
| + | |||
| + | *Asset Id | ||
| + | *From Date | ||
| + | *To Date | ||
| + | *Indicate if you would like to export just the file. | ||
| + | *Select whether or not parameters should be hidden when the report is executed. | ||
| + | *(Optional) Select the interval to refresh the report as needed. | ||
| + | |||
| + | Select '''Go'''. | ||
| + | |||
| + | '''Figure 99: OEE Performance Details Report''' | ||
| + | |||
| + | '''[[File:OEE Performance Details Report.png|border|800px|OEE Performance Details Report.png]]''' | ||
| + | |||
| + | Users can access the corresponding Unit History Report within this report by clicking the column Serial.<br/> '''Figure 100: OEE Performance Details - Unit History''' | ||
| + | |||
| + | [[File:OEE Performance Details - Unit History.png|border|800px|OEE Performance Details - Unit History.png]] | ||
| + | |||
| + | == <span class="mw-headline" id="OEE_Production_Time"><span class="mw-headline" id="OEE_Production_Time"><span class="mw-headline" id="OEE_Production_Time">OEE Production Time</span></span></span> == | ||
| + | |||
| + | The OEE Production Time Report can show the OEE production Time lists with the WO, Asset, Shop Order, Downtime, Uptime, Running Time, Idle time, Problem and Root Cause. | ||
| + | |||
| + | Step 1 | ||
| + | |||
| + | *Select a data source. | ||
| + | |||
| + | Step 2 | ||
| + | |||
| + | *Select the Site | ||
| + | |||
| + | Step 3 | ||
| + | |||
| + | *Asset ID (Asset Name) | ||
| + | *From Date | ||
| + | *To Date | ||
| + | *Indicate if you would like to export just the file. | ||
| + | *Select whether or not parameters should be hidden when the report is executed. | ||
| + | *(Optional) Select the interval to refresh the report as needed. | ||
| + | |||
| + | Select Go. | ||
| + | |||
| + | '''Figure 100: OEE Production Time Report''' | ||
| + | |||
| + | [[File:OEE Production Time Report.png|border|800px|OEE Production Time Report.png]] <br/> | ||
| + | |||
| + | == <span class="mw-headline" id="OEE_Quality"><span class="mw-headline" id="OEE_Quality"><span class="mw-headline" id="OEE_Quality">OEE Quality</span></span></span> == | ||
| + | |||
| + | The OEE Quality Report can show the OEE Quality lists with the Asset, Shop Order, Time Range, Target UPH, Finished QTY and Good QTY. | ||
| + | |||
| + | Step 1 | ||
| + | |||
| + | *Select a data source. | ||
| + | |||
| + | Step 2 | ||
| + | |||
| + | *Site | ||
| + | |||
| + | Step 3 | ||
| + | |||
| + | *Asset ID (Asset Name) | ||
| + | *From Date | ||
| + | *To Date | ||
| + | *Indicate if you would like to export just the file. | ||
| + | *Select whether or not parameters should be hidden when the report is executed. | ||
| + | *(Optional) Select the interval to refresh the report as needed. | ||
| + | |||
| + | Select '''Go'''.<br/> '''Figure 102: OEE Quality Report''' | ||
| + | |||
| + | [[File:OEE Quality Report.png|border|800px|OEE Quality Report.png]] | ||
| + | |||
| + | == <span class="mw-headline" id="OEE_Quality_Details"><span class="mw-headline" id="OEE_Quality_Details"><span class="mw-headline" id="OEE_Quality_Details">OEE Quality Details</span></span></span> == | ||
| + | |||
| + | The OEE Quality Details Report can show the OEE Quality Details lists with the Asset, Finished QTY, Process, WorkStation, Serial Record Date, Part Number, Serial, Action, and Defect Code. | ||
| + | |||
| + | Users can also go to the Unit History Report from this Details report by clicking on the Serial column.<br/> Step 1 | ||
| + | |||
| + | *Select a data source. | ||
| + | |||
| + | Step 2 | ||
| + | |||
| + | *Asset Id | ||
| + | *From Date | ||
| + | *To Date | ||
| + | *Indicate if you would like to export just the file. | ||
| + | *Select whether or not parameters should be hidden when the report is executed. | ||
| + | *(Optional) Select the interval to refresh the report as needed. | ||
| + | |||
| + | Select '''Go'''. | ||
| + | |||
| + | '''Figure 103: OEE Quality Details Report''' | ||
| + | |||
| + | '''[[File:OEE Quality Details Report.png|border|800px|OEE Quality Details Report.png]]''' | ||
| + | |||
| + | Users can access the corresponding Unit History Report within this report by clicking the column Serial. | ||
| + | |||
| + | '''Figure 104: OEE Quality Details- Unit History''' | ||
| + | |||
| + | [[File:OEE Quality Details- Unit History.png|border|800px|OEE Quality Details- Unit History.png]] | ||
| + | |||
| + | == <span class="mw-headline" id="OEE_Scheduled_Downtime"><span class="mw-headline" id="OEE_Scheduled_Downtime"><span class="mw-headline" id="OEE_Scheduled_Downtime">OEE Scheduled Downtime</span></span></span> == | ||
| + | |||
| + | The OEE Scheduled Downtime Report can show the Scheduled downtime lists with the WO, Asset, Shop Order, Downtime, Uptime, Scheduled Downtime, Problem/Reason, and Root Cause. | ||
| + | |||
| + | Step 1 | ||
| + | |||
| + | *Select a data source. | ||
| + | |||
| + | Step 2 | ||
| + | |||
| + | *select a site | ||
| + | |||
| + | Step 3 | ||
| + | |||
| + | *Asset ID (Asset Name) | ||
| + | *From Date | ||
| + | *To Date | ||
| + | *Indicate if you would like to export just the file. | ||
| + | *Select whether or not parameters should be hidden when the report is executed. | ||
| + | *(Optional) Select the interval to refresh the report as needed. | ||
| + | |||
| + | Select Go. | ||
| + | |||
| + | '''Figure 105: OEE Scheduled Downtime Report''' | ||
| + | |||
| + | [[File:OEE Scheduled Downtime Report.png|border|800px|OEE Scheduled Downtime Report.png]] | ||
| + | |||
| + | == <span class="mw-headline" id="OEE_Unscheduled_Downtime"><span class="mw-headline" id="OEE_Unscheduled_Downtime"><span class="mw-headline" id="OEE_Unscheduled_Downtime">OEE Unscheduled Downtime</span></span></span> == | ||
| + | |||
| + | The OEE Unscheduled Downtime Report can show the unscheduled downtime lists with the WO, Asset, Shop Order, Downtime, Uptime, Unscheduled Downtime, Problem/Reason, and Root Cause. | ||
| + | |||
| + | Step 1 | ||
| + | |||
| + | *Select a data source. | ||
| + | |||
| + | Step 2 | ||
| + | |||
| + | *select a site | ||
| + | |||
| + | Step 3 | ||
| + | |||
| + | *Asset ID (Asset Name) | ||
| + | *From Date | ||
| + | *To Date | ||
| + | *Indicate if you would like to export just the file. | ||
| + | *Select whether or not parameters should be hidden when the report is executed. | ||
| + | *(Optional) Select the interval to refresh the report as needed. | ||
| + | |||
| + | Select Go. | ||
| + | |||
| + | '''Figure 106: OEE Unscheduled Downtime Report''' | ||
| + | |||
| + | [[File:OEE Unscheduled Downtime Report.png|border|800px|OEE Unscheduled Downtime Report.png]] <br/> | ||
| + | |||
| + | == <span class="mw-headline" id="Work_Order_Report_By_Problem"><span class="mw-headline" id="Work_Order_Report_By_Problem"><span class="mw-headline" id="Work_Order_Report_By_Problem">Work Order Report By Problem</span></span></span> == | ||
| + | |||
| + | The Work Order Report By Problem can show the Work Order lists with the Work Order, Location, Line Name, Asset, Problem, Problem Category, and Asset Downtime. | ||
| + | |||
| + | Step 1 | ||
| + | |||
| + | *Select a data source. | ||
| + | |||
| + | Step 2 | ||
| + | |||
| + | *site | ||
| + | *Problem By | ||
| + | |||
| + | Step 3 | ||
| + | |||
| + | *Please select a value from list | ||
| + | *(Optional) Time Range Type | ||
| + | *(Optional) Date Range | ||
| + | *Indicate if you would like to export just the file. | ||
| + | *Select whether or not parameters should be hidden when the report is executed. | ||
| + | *(Optional) Select the interval to refresh the report as needed. | ||
| + | |||
| + | Select Go. | ||
| + | |||
| + | '''Figure 107: Work Order Report By Problem Report''' | ||
| + | |||
| + | [[File:Work Order Report By Problem Report.png|border|800px|Work Order Report By Problem Report.png]] | ||
| + | |||
| + | == <span class="mw-headline" id="Work_Order_Report_By_Root_Cause"><span class="mw-headline" id="Work_Order_Report_By_Root_Cause"><span class="mw-headline" id="Work_Order_Report_By_Root_Cause">Work Order Report By Root Cause</span></span></span> == | ||
| + | |||
| + | The Work Order Report By Root Cause can show the Work Order lists with the Work Order, Location, Line Name, Asset, Problem, Problem Category, Root Cause, Root Cause Category and Asset Downtime. | ||
| + | |||
| + | Step 1 | ||
| + | |||
| + | *Select a data source. | ||
| + | |||
| + | Step 2 | ||
| + | |||
| + | *site | ||
| + | *Cause By | ||
| + | |||
| + | Step 3 | ||
| + | |||
| + | *Please select a value from list | ||
| + | *(Optional) Time Range Type | ||
| + | *(Optional) Date Range | ||
| + | *Indicate if you would like to export just the file. | ||
| + | *Select whether or not parameters should be hidden when the report is executed. | ||
| + | *(Optional) Select the interval to refresh the report as needed. | ||
| + | |||
| + | '''Figure 108: Work Order Report By Root Cause Report''' | ||
| + | |||
| + | [[File:Figure 106- Work Order Report By Root Cause Report.png|border|800px|Figure 106- Work Order Report By Root Cause Report.png]] | ||
| | ||
| − | + | = <span class="mw-headline" id="OEE_Reports"><span class="mw-headline" id="OEE_Reports"><span class="mw-headline" id="OEE_Reports"><span class="mw-headline" id="OEE_Reports"><span class="mw-headline" id="OEE_Reports"><span class="mw-headline" id="OEE_Reports"><span class="mw-headline" id="OEE_Reports"><span class="mw-headline" id="OEE_Reports"><span class="mw-headline" id="OEE_Reports"><span class="mw-headline" id="OEE_Reports"><span class="mw-headline" id="OEE_Reports"><span class="mw-headline" id="OEE_Reports"><span class="mw-headline" id="OEE_Reports"><span class="mw-headline" id="OEE_Reports"><span class="mw-headline" id="OEE_Reports"><span class="mw-headline" id="OEE_Reports"><span class="mw-headline" id="OEE_Reports"><span class="mw-headline" id="OEE_Reports"><span class="mw-headline" id="OEE_Reports"><span class="mw-headline" id="OEE_Reports"><span class="mw-headline" id="OEE_Reports"><span class="mw-headline" id="OEE_Reports"><span class="mw-headline" id="OEE_Reports"><span class="mw-headline" id="OEE_Reports"><span class="mw-headline" id="OEE_Reports"><span class="mw-headline" id="OEE_Reports"><span class="mw-headline" id="OEE_Reports"><span class="mw-headline" id="OEE_Reports"><span class="mw-headline" id="OEE_Reports"><span class="mw-headline" id="OEE_Reports"><span class="mw-headline" id="OEE_Reports"><span class="mw-headline" id="OEE_Reports"><span class="mw-headline" id="OEE_Reports"><span class="mw-headline" id="OEE_Reports"><span class="mw-headline" id="OEE_Reports"><span class="mw-headline" id="OEE_Reports"><span class="mw-headline" id="OEE_Reports"><span class="mw-headline" id="OEE_Reports"><span class="mw-headline" id="OEE_Reports"><span class="mw-headline" id="OEE_Reports"><span class="mw-headline" id="OEE_Reports"><span class="mw-headline" id="OEE_Reports"><span class="mw-headline" id="OEE_Reports"><span class="mw-headline" id="OEE_Reports"><span class="mw-headline" id="OEE_Reports"><span class="mw-headline" id="OEE_Reports"><span class="mw-headline" id="OEE_Reports"><span class="mw-headline" id="OEE_Reports"><span class="mw-headline" id="OEE_Reports"><span class="mw-headline" id="OEE_Reports"><span class="mw-headline" id="OEE_Reports"><span class="mw-headline" id="OEE_Reports"><span class="mw-headline" id="Oee_Reports"><span class="mw-headline" id="Oee_Reports">OEE Reports</span></span></span></span></span></span></span></span></span></span></span></span></span></span></span></span></span></span></span></span></span></span></span></span></span></span></span></span></span></span></span></span></span></span></span></span></span></span></span></span></span></span></span></span></span></span></span></span></span></span></span></span></span></span> = | |
| − | The | + | The OEE Reports are available in MESWeb to include all historical OEE and underlying metrics data available in 42Q. |
| − | ''' | + | The following section will go over each available '''OEE Report''', their parameter options, and drill-down features that will help users to go from broader, higher-level information into the details that will help teams troubleshoot and find efficiency-related problems on assets and manufacturing lines. |
| − | + | | |
| − | The ''' | + | == <span class="mw-headline" id="Downtime_Root_Cause_Analysis_Report"><span class="mw-headline" id="Downtime_Root_Cause_Analysis_Report"><span class="mw-headline" id="Downtime_Root_Cause_Analysis_Report"><span class="mw-headline" id="Downtime_Root_Cause_Analysis_Report"><span class="mw-headline" id="Downtime_Root_Cause_Analysis_Report"><span class="mw-headline" id="Downtime_Root_Cause_Analysis_Report"><span class="mw-headline" id="Downtime_Root_Cause_Analysis_Report"><span class="mw-headline" id="Downtime_Root_Cause_Analysis_Report"><span class="mw-headline" id="Downtime_Root_Cause_Analysis_Report"><span class="mw-headline" id="Downtime_Root_Cause_Analysis_Report"><span class="mw-headline" id="Downtime_Root_Cause_Analysis_Report"><span class="mw-headline" id="Downtime_Root_Cause_Analysis_Report"><span class="mw-headline" id="Downtime_Root_Cause_Analysis_Report"><span class="mw-headline" id="Downtime_Root_Cause_Analysis_Report"><span class="mw-headline" id="Downtime_Root_Cause_Analysis_Report"><span class="mw-headline" id="Downtime_Root_Cause_Analysis_Report"><span class="mw-headline" id="Downtime_Root_Cause_Analysis_Report"><span class="mw-headline" id="Downtime_Root_Cause_Analysis_Report"><span class="mw-headline" id="Downtime_Root_Cause_Analysis_Report"><span class="mw-headline" id="Downtime_Root_Cause_Analysis_Report"><span class="mw-headline" id="Downtime_Root_Cause_Analysis_Report"><span class="mw-headline" id="Downtime_Root_Cause_Analysis_Report"><span class="mw-headline" id="Downtime_Root_Cause_Analysis_Report"><span class="mw-headline" id="Downtime_Root_Cause_Analysis_Report"><span class="mw-headline" id="Downtime_Root_Cause_Analysis_Report"><span class="mw-headline" id="Downtime_Root_Cause_Analysis_Report"><span class="mw-headline" id="Downtime_Root_Cause_Analysis_Report"><span class="mw-headline" id="Downtime_Root_Cause_Analysis_Report"><span class="mw-headline" id="Downtime_Root_Cause_Analysis_Report"><span class="mw-headline" id="Downtime_Root_Cause_Analysis_Report"><span class="mw-headline" id="Downtime_Root_Cause_Analysis_Report"><span class="mw-headline" id="Downtime_Root_Cause_Analysis_Report"><span class="mw-headline" id="Downtime_Root_Cause_Analysis_Report"><span class="mw-headline" id="Downtime_Root_Cause_Analysis_Report"><span class="mw-headline" id="Downtime_Root_Cause_Analysis_Report"><span class="mw-headline" id="Downtime_Root_Cause_Analysis_Report"><span class="mw-headline" id="Downtime_Root_Cause_Analysis_Report"><span class="mw-headline" id="Downtime_Root_Cause_Analysis_Report"><span class="mw-headline" id="Downtime_Root_Cause_Analysis_Report"><span class="mw-headline" id="Downtime_Root_Cause_Analysis_Report"><span class="mw-headline" id="Downtime_Root_Cause_Analysis_Report"><span class="mw-headline" id="Downtime_Root_Cause_Analysis_Report"><span class="mw-headline" id="Downtime_Root_Cause_Analysis_Report"><span class="mw-headline" id="Downtime_Root_Cause_Analysis_Report"><span class="mw-headline" id="Downtime_Root_Cause_Analysis_Report"><span class="mw-headline" id="Downtime_Root_Cause_Analysis_Report"><span class="mw-headline" id="Downtime_Root_Cause_Analysis_Report"><span class="mw-headline" id="Downtime_Root_Cause_Analysis_Report"><span class="mw-headline" id="Downtime_Root_Cause_Analysis_Report"><span class="mw-headline" id="Downtime_Root_Cause_Analysis_Report"><span class="mw-headline" id="Downtime_Root_Cause_Analysis_Report"><span class="mw-headline" id="Downtime_Root_Cause_Analysis_Report"><span class="mw-headline" id="Downtime_Root_Cause_Analysis_Report"><span class="mw-headline" id="Downtime_Root_Cause_Analysis_Report">Downtime Root Cause Analysis Report</span></span></span></span></span></span></span></span></span></span></span></span></span></span></span></span></span></span></span></span></span></span></span></span></span></span></span></span></span></span></span></span></span></span></span></span></span></span></span></span></span></span></span></span></span></span></span></span></span></span></span></span></span></span> == |
| + | |||
| + | The Downtime'''Root Cause Analysis''' report is the primary OEE Configuration MESWeb Report. | ||
| + | |||
| + | *'''Drill Down: '''Users can access the corresponding '''Downtime''' '''Problem''' and '''Downtime Root Cause Charts''' through this report. | ||
| + | *'''Chart Type: '''Downtime Root Cause Analysis displays as a Pie Chart (by default) or Pareto Chart. | ||
| | ||
| − | ''' | + | #Select '''Data Source''' |
| + | #Select '''Site''': Select the Plant’s Location. | ||
| + | #Select Date Range in '''Step 3''' | ||
| − | + | | |
| − | + | '''Figure 109: Downtime Root Cause Analysis''' | |
| − | + | [[File:Downtime Root Cause Analysis-Data source.png|border|800px|MESWeb DowntimeRootCauseAnalysis.png]] | |
| | ||
| − | == <span class="mw-headline" id=" | + | === <span class="mw-headline" id="Parameters_for_Downtime_Root_Cause_Analysis"><span class="mw-headline" id="Parameters_for_Downtime_Root_Cause_Analysis"><span class="mw-headline" id="Parameters_for_Downtime_Root_Cause_Analysis"><span class="mw-headline" id="Parameters_for_Downtime_Root_Cause_Analysis"><span class="mw-headline" id="Parameters_for_Downtime_Root_Cause_Analysis"><span class="mw-headline" id="Parameters_for_Downtime_Root_Cause_Analysis"><span class="mw-headline" id="Parameters_for_Downtime_Root_Cause_Analysis"><span class="mw-headline" id="Parameters_for_Downtime_Root_Cause_Analysis"><span class="mw-headline" id="Parameters_for_Downtime_Root_Cause_Analysis"><span class="mw-headline" id="Parameters_for_Downtime_Root_Cause_Analysis"><span class="mw-headline" id="Parameters_for_Downtime_Root_Cause_Analysis"><span class="mw-headline" id="Parameters_for_Downtime_Root_Cause_Analysis"><span class="mw-headline" id="Parameters_for_Downtime_Root_Cause_Analysis"><span class="mw-headline" id="Parameters_for_Downtime_Root_Cause_Analysis"><span class="mw-headline" id="Parameters_for_Downtime_Root_Cause_Analysis"><span class="mw-headline" id="Parameters_for_Downtime_Root_Cause_Analysis"><span class="mw-headline" id="Parameters_for_Downtime_Root_Cause_Analysis"><span class="mw-headline" id="Parameters_for_Downtime_Root_Cause_Analysis"><span class="mw-headline" id="Parameters_for_Downtime_Root_Cause_Analysis"><span class="mw-headline" id="Parameters_for_Downtime_Root_Cause_Analysis"><span class="mw-headline" id="Parameters_for_Downtime_Root_Cause_Analysis"><span class="mw-headline" id="Parameters_for_Downtime_Root_Cause_Analysis"><span class="mw-headline" id="Parameters_for_Downtime_Root_Cause_Analysis"><span class="mw-headline" id="Parameters_for_Downtime_Root_Cause_Analysis"><span class="mw-headline" id="Parameters_for_Downtime_Root_Cause_Analysis"><span class="mw-headline" id="Parameters_for_Downtime_Root_Cause_Analysis"><span class="mw-headline" id="Parameters_for_Downtime_Root_Cause_Analysis"><span class="mw-headline" id="Parameters_for_Downtime_Root_Cause_Analysis"><span class="mw-headline" id="Parameters_for_Downtime_Root_Cause_Analysis"><span class="mw-headline" id="Parameters_for_Downtime_Root_Cause_Analysis"><span class="mw-headline" id="Parameters_for_Downtime_Root_Cause_Analysis"><span class="mw-headline" id="Parameters_for_Downtime_Root_Cause_Analysis"><span class="mw-headline" id="Parameters_for_Downtime_Root_Cause_Analysis"><span class="mw-headline" id="Parameters_for_Downtime_Root_Cause_Analysis"><span class="mw-headline" id="Parameters_for_Downtime_Root_Cause_Analysis"><span class="mw-headline" id="Parameters_for_Downtime_Root_Cause_Analysis"><span class="mw-headline" id="Parameters_for_Downtime_Root_Cause_Analysis"><span class="mw-headline" id="Parameters_for_Downtime_Root_Cause_Analysis"><span class="mw-headline" id="Parameters_for_Downtime_Root_Cause_Analysis"><span class="mw-headline" id="Parameters_for_Downtime_Root_Cause_Analysis"><span class="mw-headline" id="Parameters_for_Downtime_Root_Cause_Analysis"><span class="mw-headline" id="Parameters_for_Downtime_Root_Cause_Analysis"><span class="mw-headline" id="Parameters_for_Downtime_Root_Cause_Analysis"><span class="mw-headline" id="Parameters_for_Downtime_Root_Cause_Analysis"><span class="mw-headline" id="Parameters_for_Downtime_Root_Cause_Analysis"><span class="mw-headline" id="Parameters_for_Downtime_Root_Cause_Analysis"><span class="mw-headline" id="Parameters_for_Downtime_Root_Cause_Analysis"><span class="mw-headline" id="Parameters_for_Downtime_Root_Cause_Analysis"><span class="mw-headline" id="Parameters_for_Downtime_Root_Cause_Analysis"><span class="mw-headline" id="Parameters_for_Downtime_Root_Cause_Analysis"><span class="mw-headline" id="Parameters_for_Downtime_Root_Cause_Analysis"><span class="mw-headline" id="Parameters_for_Downtime_Root_Cause_Analysis"><span class="mw-headline" id="Parameters_for_Downtime_Root_Cause_Analysis"><span class="mw-headline" id="Parameters_for_Downtime_Root_Cause_Analysis"><span class="mw-headline" id="Parameters_for_Downtime_Root_Cause_Analysis"><span class="mw-headline" id="Parameters_for_Downtime_Root_Cause_Analysis"><span class="mw-headline" id="Parameters_for_Downtime_Root_Cause_Analysis"><span class="mw-headline" id="Parameters_for_Downtime_Root_Cause_Analysis">Parameters for Downtime Root Cause Analysis</span></span></span></span></span></span></span></span></span></span></span></span></span></span></span></span></span></span></span></span></span></span></span></span></span></span></span></span></span></span></span></span></span></span></span></span></span></span></span></span></span></span></span></span></span></span></span></span></span></span></span></span></span></span></span></span></span></span> === |
| − | ''' | + | *'''Time Range'''(Optional): Selecting the Current Shift, Last Hour, Current Day, Last 24 hours. |
| + | *'''Date Range: '''Select the time span (From/To) for the report using the drop-down calendar. | ||
| + | *'''Location:''' (Optional) Select the building, floor, level, etc., etc. Department, Location, or Line | ||
| + | *'''Production Line:''' (Optional) Select the manufacturing line | ||
| + | *'''Asset ID:''' (Optional) Select the machine to analyze its performance | ||
| + | *'''Asset Type: '''(Optional) Select the machine type to analyze | ||
| + | *'''Project: '''(Optional) Select the project for analysis | ||
| + | *'''Asset: '''(Optional) Select the machine to analyze its performance | ||
| + | *'''Production PN:''' (Optional) Select the PN to analyze | ||
| − | + | '''<u>Note:</u> '''PN reports show data about the product being built according to the specified Part Number (PN). | |
| − | '''Note:''' | + | *'''Production WO: '''(Optional) Select the Production WO to analyze |
| + | |||
| + | '''<u>Note:</u> '''Work Order refers to the work order assigned in Oracle, and will show data connected to all activity for the specified Work Order. | ||
| + | |||
| + | *'''Non Stop:''' (Optional. Default is checked): Check the box to view data that pertains to machinery problems on lines that are still running (non stop). Uncheck to view only lines which have been shut down due to machinery problems | ||
| + | *'''Problem Category: (Optional):''' Select data to display according to a specific Asset Problem Category (e.g. Misalignment, Jammed). Asset Problem Categories are configured in CMMS Asset | ||
| + | *'''Problem Type: (Optional): '''Select data to display according to a specific Asset Problem Type (e.g. Damaged Sensor). Asset Problems are configured in CMMS Asset | ||
| + | *'''Display by:''' Select the type of Problems to display in the charts. Options include Problem, Problem Type, or Problem Category. Asset Problems are configured in CMMS Asset. | ||
| + | *'''Root Cause By: '''Select if you would like the chart to display all Root Causes (Root Cause) or a broader set of data (Root Cause Category). | ||
| + | *'''Calculate by: '''Select if you would like the chart to display the number of times the problem occurred (Occurrences) or the time period during which the problem persisted (Duration)''' ''' | ||
| + | *'''Chart Type: '''Select Pareto or Pie Chart | ||
| + | *'''Top: '''(Optional) (Default is 5) Select the number of results to display in the chart. (5 - 20) | ||
| + | *'''Charts to Display: '''Tell the system to create the type and number of charts to create: Both Problem/Root Cause (will display together), Downtime Problem, or Downtime Root Cause. | ||
| + | *'''Display Data as: '''Select the kind of document you want, Web view, Excel, Google sheet, XML, CSV, or Text. | ||
| + | *'''Parameters: '''(Checked by default) Uncheck to see parameters displayed next to the report. | ||
| + | *'''Refresh Rate: '''(Do not Refresh is the default) Users can change the refresh rate by minutes up to one hour. | ||
| | ||
| − | '''Figure | + | '''Figure 110: Downtime Root Cause and Downtime Problem Pie Chart''' |
| + | |||
| + | [[File:MESWeb DowntimeRootCauseandDowntimeProblemPieChart.png|900px|MESWeb DowntimeRootCauseandDowntimeProblemPieChart.png]] | ||
| + | |||
| + | | ||
| − | ''' | + | '''Figure 111: Downtime Root Cause and Downtime Problem Pareto Chart ''' |
| − | ''' | + | '''[[File:MESWeb DowntimeRootCauseandDowntimeProblemParetoChart .png|900px|MESWeb DowntimeRootCauseandDowntimeProblemParetoChart .png]]''' |
| | ||
| − | == | + | |
| + | |||
| + | | ||
| + | |||
| + | === <span class="mw-headline" id="Drill_down"><span class="mw-headline" id="Drill_down"><span class="mw-headline" id="Drill_down"><span class="mw-headline" id="Drill_down"><span class="mw-headline" id="Drill_down"><span class="mw-headline" id="Drill_down">Drill down</span></span></span></span></span></span> === | ||
| + | |||
| + | '''Drill Down''': Users can access the corresponding '''Downtime Trend and Frequency Report '''and the '''Work Order Report by Problem '''within this report. | ||
| + | |||
| + | To view each report in detail and its corresponding work orders: | ||
| + | |||
| + | Double-click on the desired section of the pie chart or data point on the Pareto chart. The system will prompt the user to select one of the following: | ||
| + | |||
| + | *Downtime Trend and Frequency Report | ||
| + | *Work Order Report by Problem | ||
| + | |||
| + | '''Figure 112: System Prompt: Select Report for Drilldown''' | ||
| + | |||
| + | [[File:System Prompt- Select Report for Drilldown.png|border|800px|System Prompt- Select Report for Drilldown.png]] | ||
| − | + | Double click on the desired report. The next two figures show each report in a close-up view. | |
| − | '''Figure | + | '''Figure 113: Drill down Downtime Problem Trend and Frequency Report''' |
| − | '''[[File: | + | ''' ''' [[File:Figure 68- Downtime Trend and Frequency Report2.png|border|800px|Figure 68- Downtime Trend and Frequency Report2.png]] |
| + | |||
| + | '''Figure 114: Work Order By Problem Report Drilldown''' | ||
| + | |||
| + | [[File:WO report by problem.png|border|800px|WO report by problem.png]] | ||
| + | |||
| + | <br/> To view the Work Order, copy the W/O # and search in Production > CMMS Work Order. | ||
| | ||
| − | + | == <span class="mw-headline" id="Downtime_Trend_Analysis_Report"><span class="mw-headline" id="Downtime_Trend_Analysis_Report"><span class="mw-headline" id="Downtime_Trend_Analysis_Report">Downtime Trend Analysis Report</span></span></span> == | |
| − | + | The Downtime Trend Analysis report is the primary OEE Configuration MESWeb Report. | |
| − | [[File: | + | *Drill Down: Users can access the corresponding Downtime Problem and Downtime Root Cause Charts through this report. |
| + | *Drill Down: Users can access the corresponding Downtime Trend and Frequency Report and the Work Order Report by Problem within this report. | ||
| + | *Chart Type: Downtime Root Cause Analysis displays as a Pie Chart (by default) or Pareto Chart. | ||
| + | |||
| + | Step 1 | ||
| + | |||
| + | *Select a data source | ||
| + | |||
| + | Step 2 | ||
| + | |||
| + | *Select a plant site | ||
| + | |||
| + | Step 3 | ||
| + | |||
| + | *(Optional) Filter data by a date range. | ||
| + | *Select how the graphic is going to show the date format. | ||
| + | *Select display by. | ||
| + | *Select KPI. | ||
| + | |||
| + | Step 4 | ||
| + | |||
| + | *(Optional) Enter a production PN. | ||
| + | *(Optional) Enter a production WO. | ||
| + | *Select if including non stop. | ||
| + | *(Optional) Select a location | ||
| + | *(Optional) Select a production line | ||
| + | *(Optional) Select an asset | ||
| + | *(Optional) Select a asset type | ||
| + | *(Optional) Select a WO project | ||
| + | *(Optional) Select a problem category | ||
| + | *(Optional) Select a problem type | ||
| + | |||
| + | Step 5 | ||
| + | |||
| + | *(Optional) Select a problem | ||
| + | *Indicate if you would like to export just the file. | ||
| + | *Select whether or not parameters should be hidden when the report is executed. | ||
| + | *(Optional) Select the interval to refresh the report as needed. | ||
| + | |||
| + | Select '''Go'''. | ||
| + | |||
| + | '''Figure 115: Downtime Trend Analysis Report''' | ||
| + | |||
| + | [[File:Figure- Downtime Trend Analysis Report.png|border|800px|Figure- Downtime Trend Analysis Report.png]] | ||
| + | |||
| + | === <span class="mw-headline" id="Drill_Down_2"><span class="mw-headline" id="Drill_Down_2"><span class="mw-headline" id="Drill_Down">Drill Down</span></span></span> === | ||
| + | |||
| + | Drill Down: Users can access the corresponding Downtime Trend and Frequency Report and the Work Order Report by Problem within this report. | ||
| + | |||
| + | To view each report in detail and its corresponding work orders: Double-click on the desired section of the pie chart or data point on the Pareto chart. The system will prompt the user to select one of the following: | ||
| + | |||
| + | *'''Downtime Trend and Frequency Report''' | ||
| + | *'''Work Order Report by Problem''' | ||
| + | |||
| + | == <span class="mw-headline" id="Energy_Consumption_by_Product"><span class="mw-headline" id="Energy_Consumption_by_Product"><span class="mw-headline" id="Energy_Consumption_by_Product"><span class="mw-headline" id="Energy_Consumption_by_Product"><span class="mw-headline" id="Energy_Consumption_by_Product"><span class="mw-headline" id="Energy_Consumption_by_Product"><span class="mw-headline" id="Energy_Consumption_by_Product"><span class="mw-headline" id="Energy_Consumption_by_Product"><span class="mw-headline" id="Energy_Consumption_by_Product"><span class="mw-headline" id="Energy_Consumption_by_Product">Energy Consumption by Product</span></span></span></span></span></span></span></span></span></span> == | ||
| + | |||
| + | The Energy Consumption By Product Report allows users to display the data by product. | ||
| + | |||
| + | Chart Type: Data displays in Pareto Charts. | ||
| + | |||
| + | #Select '''Data Source'''. | ||
| + | #Select '''Site'''. | ||
| + | #Select '''Next'''. | ||
| + | #Select Parameters in Step 3 | ||
| | ||
| − | + | *(Optional) '''Asset ID''' (Asset Name) | |
| + | *(Optional) '''Line Name''' | ||
| + | *(Optional)'''Part Number''' | ||
| + | *'''Sensor Type''': Power, Gas, Water. | ||
| + | *'''Start Time''' | ||
| + | *'''End Time''' | ||
| + | *Indicate if you would like to export just the file. | ||
| + | *Select whether or not parameters should be hidden when the report is executed. | ||
| + | *(Optional) Select the interval to refresh the report as needed. | ||
| − | + | <br/> '''Figure 116: Energy Consumption by Product- Data source''' | |
| − | '''Figure | + | [[File:Figure 51- Energy Consumption by Production- Data source.png|border|800px|Figure 51- Energy Consumption by Production- Data source.png]]<br/> <br/> <br/> '''Figure 117: Energy Consumption by Product Report''' |
| − | + | [[File:Figure 51a- Energy Consumption by Production Report.png|border|800px|Figure 51a- Energy Consumption by Production Report.png]] | |
| | ||
| Line 1,095: | Line 2,635: | ||
| | ||
| + | == <span class="mw-headline" id="Energy_Consumption_by_Shop_Order"><span class="mw-headline" id="Energy_Consumption_by_Shop_Order"><span class="mw-headline" id="Energy_Consumption_by_Shop_Order"><span class="mw-headline" id="Energy_Consumption_by_Shop_Order"><span class="mw-headline" id="Energy_Consumption_by_Shop_Order"><span class="mw-headline" id="Energy_Consumption_by_Shop_Order"><span class="mw-headline" id="Energy_Consumption_by_Shop_Order"><span class="mw-headline" id="Energy_Consumption_by_Shop_Order"><span class="mw-headline" id="Energy_Consumption_by_Shop_Order"><span class="mw-headline" id="Energy_Consumption_by_Shop_Order"><span class="mw-headline" id="Energy_Consumption_by_Shop_Order">Energy Consumption by Shop Order</span></span></span></span></span></span></span></span></span></span></span> == | ||
| − | + | The Energy Consumption By Shop Order Report allows users to display the data by shop order. | |
| − | + | Chart Type: Data displays in Pareto Charts. | |
| − | + | #Select '''Data Source'''. | |
| + | #Select '''Site'''. | ||
| + | #Select '''Next'''. | ||
| + | #Select Parameters in Step 3 | ||
| | ||
| − | '''Figure | + | *(Optional) '''Asset ID''' (Asset Name) |
| + | *(Optional) '''Line Name''' | ||
| + | *(Optional) '''Shop Order''' | ||
| + | *'''Sensor Type''': Power, Gas, Water. | ||
| + | *'''Start Time''' | ||
| + | *'''End Time''' | ||
| + | *Indicate if you would like to export just the file. | ||
| + | *Select whether or not parameters should be hidden when the report is executed. | ||
| + | *(Optional) Select the interval to refresh the report as needed. | ||
| + | |||
| + | <br/> '''Figure 118: Energy Consumption by Shop Order - Data source''' | ||
| + | |||
| + | [[File:Figure 52- Energy Consumption by Shop Order - Data source.png|border|800px|Figure 52- Energy Consumption by Shop Order - Data source.png]]<br/> <br/> <br/> '''Figure 119: Energy Consumption by Shop Order Report''' | ||
| − | + | [[File:Figure 52a- Energy Consumption by Shop Order Report.png|border|800px|Figure 52a: Energy Consumption by Shop Order Report.png]] | |
| − | + | | |
| | ||
| − | + | == <span class="mw-headline" id="Historical_Energy_Consumption"><span class="mw-headline" id="Historical_Energy_Consumption"><span class="mw-headline" id="Historical_Energy_Consumption"><span class="mw-headline" id="Historical_Energy_Consumption"><span class="mw-headline" id="Historical_Energy_Consumption"><span class="mw-headline" id="Historical_Energy_Consumption"><span class="mw-headline" id="Historical_Energy_Consumption"><span class="mw-headline" id="Historical_Energy_Consumption"><span class="mw-headline" id="Historical_Energy_Consumption"><span class="mw-headline" id="Historical_Energy_Consumption">Historical Energy Consumption</span></span></span></span></span></span></span></span></span></span> == | |
| − | ''' | + | The Historical Energy Consumption Report allows users to display historical data by product. |
| + | |||
| + | Chart Type: Data displays in Pareto Charts. | ||
| + | |||
| + | #Select '''Data Source'''. | ||
| + | #Select '''Site'''. | ||
| + | #Select '''Next'''. | ||
| + | #Select Parameters in Step 3 | ||
| | ||
| − | + | *(Optional)'''Asset ID''' (Asset Name) | |
| − | + | *(Optional) '''Line Name''' | |
| + | *(Optional) '''Location Name''' | ||
| + | *(Optional) '''Shop Order''' | ||
| + | *(Optional) '''Part Number''' | ||
| + | *'''Sensor Type''': Power, Gas, Water. | ||
| + | *'''Start Time''' | ||
| + | *'''End Time''' | ||
| + | *Indicate if you would like to export just the file. | ||
| + | *Select whether or not parameters should be hidden when the report is executed. | ||
| + | *(Optional) Select the interval to refresh the report as needed. | ||
| + | |||
| + | <br/> '''Figure 120: Historical Energy Consumption - Data source''' | ||
| + | |||
| + | [[File:Figure 53- Historical Energy Consumption - Data source.png|border|800px|Figure 53- Historical Energy Consumption - Data source.png]]<br/> <br/> <br/> '''Figure 121: Historical Energy Consumption Report''' | ||
| + | |||
| + | [[File:Figure 53a- Historical Energy Consumption Report.png|border|800px|Figure 53a- Historical Energy Consumption Report.png]] | ||
| + | |||
| + | | ||
| | ||
| − | + | | |
| | ||
| − | * | + | == <span class="mw-headline" id="_MTBF_And_MTTR_Report"><span class="mw-headline" id="_MTBF_And_MTTR_Report"><span class="mw-headline" id="_MTBF_And_MTTR_Report"><span class="mw-headline" id=""> </span>MTBF And MTTR Report</span></span></span> == |
| − | * | + | |
| − | * | + | The MTBF & MTTR are the KPIs for the asset (both CMMS & OEE Configuration system. |
| + | |||
| + | Use Case | ||
| + | |||
| + | *The product manager views the MTBF & MTTR reports in the monthly machine downtime review meeting. | ||
| + | *The product manager determines that all or some of the machine MTBF is out of the expected range. | ||
| + | *The repair team needs to look at those lower MTFB hour machine OEE Configuration downtime records and drill down into the root cause of why those machines break quite often. This aims at increasing the production uptime. It might be caused by expired regular maintenance/service etc. | ||
| + | *The product manager finds out the overall or MTTR value is longer than the expected recovery time. | ||
| + | *The repair team needs to go through the longest MTTR value machine to figure out why the repair time is too long. The repair team needs to identify the root cause, then they will be able to repair the same issue in the shortest time to increase production uptime. | ||
| | ||
| − | + | === <span class="mw-headline" id="MTBF_and_MTTR_Fields"><span class="mw-headline" id="MTBF_and_MTTR_Fields"><span class="mw-headline" id="MTBF_and_MTTR_Fields">MTBF and MTTR Fields</span></span></span> === | |
| − | + | The Mean Time Between Failures (MTBF) and Mean Time To Repair (MTTR) Reports provide a more detailed view of asset activity, specifically regarding asset failure and repair. | |
| + | |||
| + | *Drill Down: Users can access the corresponding Downtime Problem Chart, as well as corresponding individual problem, reports through this report. | ||
| + | *Chart Type: MTBF and MTTR Report display in Report format. | ||
| | ||
| − | + | #Select Data Source in Step 1. | |
| + | #Select Parameters in Step 2. | ||
| + | |||
| + | *Site: Select the Plant’s Location. | ||
| + | *Location: (Optional) Select the building, floor, level, etc., etc. Department, Location, or Line. | ||
| + | *Asset Type: (Optional) Select the machine (Asset) type to analyze. | ||
| + | *Asset: (Optional) Select the machine to analyze its performance. | ||
| + | *Date Range: Select the time period for the report using the drop-down calendar. | ||
| + | *Parameters: (Checked by default) Uncheck to see parameters displayed next to the report. | ||
| + | *Refresh Rate: (Do not Refresh is default) Users can change the refresh rate by minutes up to one hour. | ||
| + | |||
| + | <br/> '''Figure 122: MTBF and MTTR Report''' | ||
| + | |||
| + | [[File:MESWeb MTBFandMTTRReport.png|border|800px|MESWeb MTBFandMTTRReport.png]] | ||
| + | |||
| + | === <span class="mw-headline" id="Drill_Downs:_MTBF_and_MTTR_Reports"><span class="mw-headline" id="Drill_Downs:_MTBF_and_MTTR_Reports"><span class="mw-headline" id="Drill_Downs:_MTBF_and_MTTR_Reports">Drill Downs: MTBF and MTTR Reports</span></span></span> === | ||
| + | |||
| + | To see the detailed report for each MTBF And MTTR Report, double click on the Asset ID name. | ||
| + | |||
| + | #The Downtime Problem Analysis Chart displays. | ||
| + | |||
| + | <br/> '''Figure 123: MTBF and MTTR Report Drill Down Downtime Problem Analysis Chart''' | ||
| + | |||
| + | [[File:MESWeb MTBFMTTRReportDrillDownDowntimeProblemAnalysisChart.png|border|800px|MESWeb MTBFMTTRReportDrillDownDowntimeProblemAnalysisChart.png]] | ||
| + | <ol start="2"> | ||
| + | <li>Double click on the section of the pie to select reports specific to that problem.</li> | ||
| + | </ol> | ||
| − | '''< | + | *'''Downtime Trend and Frequency Report''' |
| + | *'''Work Order Report by Problem''' | ||
| + | <ol start="3"> | ||
| + | <li>Select the desired report. See Drill Downs: Root Cause Analysis Reports to see how the reports and prompts appear in the system.</li> | ||
| + | </ol> | ||
| + | |||
| + | | ||
| | ||
| − | The | + | == <span class="mw-headline" id="MTBF_And_MTTR_Trend_Report"><span class="mw-headline" id="MTBF_And_MTTR_Trend_Report"><span class="mw-headline" id="MTBF_And_MTTR_Trend_Report">MTBF And MTTR Trend Report</span></span></span> == |
| + | |||
| + | The MTBF and MTTR Trend Report shows machine failure and repair averages over time. | ||
| + | |||
| + | === <span class="mw-headline" id="Drill_Down_3"><span class="mw-headline" id="Drill_Down_3"><span class="mw-headline" id="Drill_Down">Drill Down</span></span></span> === | ||
| + | |||
| + | Users can access the corresponding Downtime Problem and Downtime Root Cause Charts, as well as a corresponding individual problem, reports through this report. Chart Type: MTBF and MTTR Trend Report displays as a Pareto Chart format. | ||
| + | |||
| + | #Select Data Source. and Next. | ||
| + | #Select Site: Select the Plant’s Location. | ||
| + | |||
| + | === <span class="mw-headline" id="Parameters_for_MTBF_And_MTTR_Trend_Report"><span class="mw-headline" id="Parameters_for_MTBF_And_MTTR_Trend_Report"><span class="mw-headline" id="Parameters_for_MTBF_And_MTTR_Trend_Report">Parameters for MTBF And MTTR Trend Report</span></span></span> === | ||
| + | <ol start="3"> | ||
| + | <li>Select Parameters in Step 3.</li> | ||
| + | </ol> | ||
| + | |||
| + | *Location: (Optional) Select the building, floor, level, etc., etc. Department, Location, or Line. | ||
| + | *Asset Type: (Optional) Select the machine (Asset) type to analyze. | ||
| + | *Asset: (Optional) Select the machine to analyze its performance. | ||
| + | *Date Range: Select the time period for the report using the drop-down calendar. | ||
| + | *Date Type: View by Day, Week, or Month (Week is Default). | ||
| + | *Parameters: (Checked by default) Uncheck to see parameters displayed next to the report. | ||
| + | *Refresh Rate: (Do not Refresh is default) Users can change the refresh rate by minutes up to one hour. | ||
| + | |||
| + | <br/> '''Figure 124: MTBF and MTTR Trend Report''' | ||
| + | |||
| + | [[File:MESWeb MTBFandMTTRTrendReport.png|border|800px|MESWeb MTBFandMTTRTrendReport.png]] | ||
| + | |||
| + | === <span class="mw-headline" id="Drill_Downs:_MTBF_and_MTTR_Trend_Reports"><span class="mw-headline" id="Drill_Downs:_MTBF_and_MTTR_Trend_Reports"><span class="mw-headline" id="Drill_Downs:_MTBF_and_MTTR_Trend_Reports">Drill Downs: MTBF and MTTR Trend Reports</span></span></span> === | ||
| + | |||
| + | To view each MTBF And MTTR Trend Report and their corresponding Work Orders, double-click on the desired data point on the Pareto Chart. The Downtime Problem Analysis and Downtime Root Cause Analysis Charts are displayed. | ||
| + | |||
| + | '''Figure 125: Drill down for MTBF and MTTR Trend Reports''' | ||
| + | |||
| + | [[File:MESWeb DrilldownMTBFMTTRTrendReports.png|border|800px|MESWeb DrilldownMTBFMTTRTrendReports.png]] | ||
| + | <ol start="2"> | ||
| + | <li>Double-click on the section of the pie to select reports specific to that problem and its corresponding Work Order:</li> | ||
| + | </ol> | ||
| + | |||
| + | *'''Downtime Trend and Frequency Report''' | ||
| + | *'''Work Order Report by Problem''' | ||
| + | <ol start="3"> | ||
| + | <li>Select the desired report. See Drill Downs: Root Cause Analysis Reports to see how the reports and prompts appear in the system.</li> | ||
| + | </ol> | ||
| | ||
| − | + | == <span class="mw-headline" id="OEE_Dashboard"><span class="mw-headline" id="OEE_Dashboard"><span class="mw-headline" id="OEE_Dashboard"><span class="mw-headline" id="OEE_Dashboard"><span class="mw-headline" id="OEE_Dashboard"><span class="mw-headline" id="OEE_Dashboard"><span class="mw-headline" id="OEE_Dashboard"><span class="mw-headline" id="OEE_Dashboard"><span class="mw-headline" id="OEE_Dashboard"><span class="mw-headline" id="OEE_Dashboard"><span class="mw-headline" id="OEE_Dashboard"><span class="mw-headline" id="OEE_Dashboard"><span class="mw-headline" id="OEE_Dashboard"><span class="mw-headline" id="OEE_Dashboard"><span class="mw-headline" id="OEE_Dashboard"><span class="mw-headline" id="OEE_Dashboard"><span class="mw-headline" id="OEE_Dashboard"><span class="mw-headline" id="OEE_Dashboard"><span class="mw-headline" id="OEE_Dashboard"><span class="mw-headline" id="OEE_Dashboard"><span class="mw-headline" id="OEE_Dashboard"><span class="mw-headline" id="OEE_Dashboard"><span class="mw-headline" id="OEE_Dashboard"><span class="mw-headline" id="OEE_Dashboard"><span class="mw-headline" id="OEE_Dashboard"><span class="mw-headline" id="OEE_Dashboard"><span class="mw-headline" id="OEE_Dashboard"><span class="mw-headline" id="OEE_Dashboard"><span class="mw-headline" id="OEE_Dashboard"><span class="mw-headline" id="OEE_Dashboard"><span class="mw-headline" id="OEE_Dashboard"><span class="mw-headline" id="OEE_Dashboard"><span class="mw-headline" id="OEE_Dashboard"><span class="mw-headline" id="OEE_Dashboard"><span class="mw-headline" id="OEE_Dashboard"><span class="mw-headline" id="OEE_Dashboard"><span class="mw-headline" id="OEE_Dashboard"><span class="mw-headline" id="OEE_Dashboard"><span class="mw-headline" id="OEE_Dashboard"><span class="mw-headline" id="OEE_Dashboard"><span class="mw-headline" id="OEE_Dashboard"><span class="mw-headline" id="OEE_Dashboard"><span class="mw-headline" id="OEE_Dashboard"><span class="mw-headline" id="OEE_Dashboard"><span class="mw-headline" id="OEE_Dashboard"><span class="mw-headline" id="OEE_Dashboard"><span class="mw-headline" id="OEE_Dashboard"><span class="mw-headline" id="OEE_Dashboard"><span class="mw-headline" id="OEE_Dashboard"><span class="mw-headline" id="OEE_Dashboard"><span class="mw-headline" id="OEE_Dashboard"><span class="mw-headline" id="OEE_Dashboard"><span class="mw-headline" id="OEE_Dashboard"><span class="mw-headline" id="OEE_Dashboard"><span class="mw-headline" id="OEE_Dashboard"><span class="mw-headline" id="OEE_Dashboard"><span class="mw-headline" id="OEE_Dashboard"><span class="mw-headline" id="OEE_Dashboard"><span class="mw-headline" id="OEE_Dashboard">OEE Dashboard</span></span></span></span></span></span></span></span></span></span></span></span></span></span></span></span></span></span></span></span></span></span></span></span></span></span></span></span></span></span></span></span></span></span></span></span></span></span></span></span></span></span></span></span></span></span></span></span></span></span></span></span></span></span></span></span></span></span></span> == | |
| − | + | The '''OEE Dashboard Report''' allows users to display historical data in a similar fashion that the 42Q Operations Dashboard OEE Widget would.<br/> | |
| + | |||
| + | *'''Drill Down Reports:''' Users can access the corresponding '''Downtime Problem and Downtime Root Cause Charts''', as well as corresponding individual reports through this report. | ||
| + | *'''Chart Type:''' Data displays in Gauge meters with a target range of colors noted as critical (<span style="color:#c0392b;">red</span>), cautionary (<span style="color:#f1c40f;">yellow</span>), or performing as expected (<span style="color:#27ae60;">green</span>). Gauge meters follow the same configuration rules set for 42Q Live in Target Maintenance. See '''[https://docs.google.com/document/d/1F2c5M3uWYHLAnAhYlOwthfjAnHo1V1XqDCigAYpIwnM/edit#heading=h.he919odn5mdf Setting Target UPHs] '''for configuration steps. | ||
| + | |||
| + | #'''Select Data Source''' | ||
| + | #'''Select Next''' | ||
| + | #'''Select Date Range''' | ||
| + | #'''Select Parameters in Step 2''' | ||
| + | |||
| + | '''Site: '''Select the Plant’s location | ||
| + | |||
| + | '''Group by: '''Select Department, Location, or Line | ||
| + | |||
| + | '''Time Range Type (Optional): '''Select Last hour, Last 24 hours, Current day, or Current shift | ||
| + | |||
| + | '''Date Range:''' Select the time period for the report using the drop-down calendar | ||
| + | |||
| + | '''Display By:''' (Optional) Select OEE, TEEP, or OEE & TEEP | ||
| + | |||
| + | '''Order By:''' (Optional) Select ASC, DESC | ||
| + | |||
| + | '''Parameters: '''(Checked by default) Uncheck to see parameters displayed next to the report | ||
| + | |||
| + | '''Refresh Rate: '''(Do not Refresh is the default) Users can change the refresh rate by minutes up to one hour: | ||
| + | |||
| + | * Do not refresh(by default) | ||
| + | * 1 -5 minutes | ||
| + | *10 minutes | ||
| + | *15 minutes | ||
| + | *30 minutes | ||
| + | *60 minutes | ||
| + | |||
| + | <u>'''Note: '''</u>Users can view all production lines simultaneously on a single screen, or select a single production line or machine.<br/> | ||
| + | |||
| + | '''Figure 126: OEE Dashboard Report''' | ||
| + | |||
| + | '''[[File:MESWeb OEEDashboardReport.png|900px|MESWeb OEEDashboardReport.png]]''' | ||
| | ||
| − | + | === <span class="mw-headline" id="Drill_Downs:_OEE_By_Asset"><span class="mw-headline" id="Drill_Downs:_OEE_By_Asset">Drill Downs: OEE By Asset</span></span> === | |
| + | |||
| + | To see the corresponding OEE by asset Charts: | ||
| + | |||
| + | #Select the OEE value in the center of the gauge. | ||
| + | #The OEE by Asset chart will show. | ||
| + | |||
| + | '''Figure 127: OEE by Asset''' | ||
| + | |||
| + | [[File:Figure 55a- OEE by Asset1.png|border|800px|Figure 55a- OEE by Asset1.png]] | ||
| + | |||
| + | Calculation: Parallel/Serie. | ||
| + | |||
| + | *'''Parallel''': The Line OEE value will show the OEE average value of all the assets. | ||
| + | *'''Serial''': The Line OEE value will show the OEE asset with the less OEE belonging to the line selected. | ||
| + | |||
| + | Select the desired report. See Drill Downs: Root Cause Analysis Reports to see how the reports and prompts appear in the system.<br/> <u>'''Note'''</u>: Please make sure to first configure the location, department, and production line, before viewing the reports. | ||
| | ||
| − | + | === <span class="mw-headline" id="Drill_Downs:_OEE_Performance_By_Asset"><span class="mw-headline" id="Drill_Downs:_OEE_Performance_By_Asset"><span class="mw-headline" id="Drill_Downs:_OEE_Performance_By_Asset"><span class="mw-headline" id="Drill_Downs:_OEE_Performance_By_Asset"><span class="mw-headline" id="Drill_Downs:_OEE_Performance_By_Asset"><span class="mw-headline" id="Drill_Downs:_OEE_Performance_By_Asset"><span class="mw-headline" id="Drill_Downs:_OEE_Performance_By_Asset"><span class="mw-headline" id="Drill_Downs:_OEE_Performance_By_Asset"><span class="mw-headline" id="Drill_Downs:_OEE_Performance_By_Asset"><span class="mw-headline" id="Drill_Downs:_OEE_Performance_By_Asset"><span class="mw-headline" id="Drill_Downs:_OEE_Performance_By_Asset"><span class="mw-headline" id="Drill_Downs:_OEE_Performance_By_Asset"><span class="mw-headline" id="Drill_Downs:_OEE_Performance_By_Asset"><span class="mw-headline" id="Drill_Downs:_OEE_Performance_By_Asset"><span class="mw-headline" id="Drill_Downs:_OEE_Performance_By_Asset"><span class="mw-headline" id="Drill_Downs:_OEE_Performance_By_Asset"><span class="mw-headline" id="Drill_Downs:_OEE_Performance_By_Asset"><span class="mw-headline" id="Drill_Downs:_OEE_Performance_By_Asset"><span class="mw-headline" id="Drill_Downs:_OEE_Performance_By_Asset"><span class="mw-headline" id="Drill_Downs:_OEE_Performance_By_Asset"><span class="mw-headline" id="Drill_Downs:_OEE_Performance_By_Asset"><span class="mw-headline" id="Drill_Downs:_OEE_Performance_By_Asset"><span class="mw-headline" id="Drill_Downs:_OEE_Performance_By_Asset"><span class="mw-headline" id="Drill_Downs:_OEE_Performance_By_Asset"><span class="mw-headline" id="Drill_Downs:_OEE_Performance_By_Asset"><span class="mw-headline" id="Drill_Downs:_OEE_Performance_By_Asset"><span class="mw-headline" id="Drill_Downs:_OEE_Performance_By_Asset"><span class="mw-headline" id="Drill_Downs:_OEE_Performance_By_Asset"><span class="mw-headline" id="Drill_Downs:_OEE_Performance_By_Asset"><span class="mw-headline" id="Drill_Downs:_OEE_Performance_By_Asset"><span class="mw-headline" id="Drill_Downs:_OEE_Performance_By_Asset"><span class="mw-headline" id="Drill_Downs:_OEE_Performance_By_Asset"><span class="mw-headline" id="Drill_Downs:_OEE_Performance_By_Asset"><span class="mw-headline" id="Drill_Downs:_OEE_Performance_By_Asset"><span class="mw-headline" id="Drill_Downs:_OEE_Performance_By_Asset"><span class="mw-headline" id="Drill_Downs:_OEE_Performance_By_Asset"><span class="mw-headline" id="Drill_Downs:_OEE_Performance_By_Asset"><span class="mw-headline" id="Drill_Downs:_OEE_Performance_By_Asset"><span class="mw-headline" id="Drill_Downs:_OEE_Performance_By_Asset"><span class="mw-headline" id="Drill_Downs:_OEE_Performance_By_Asset"><span class="mw-headline" id="Drill_Downs:_OEE_Performance_By_Asset"><span class="mw-headline" id="Drill_Downs:_OEE_Performance_By_Asset"><span class="mw-headline" id="Drill_Downs:_OEE_Performance_By_Asset"><span class="mw-headline" id="Drill_Downs:_OEE_Performance_By_Asset"><span class="mw-headline" id="Drill_Downs:_OEE_Performance_By_Asset"><span class="mw-headline" id="Drill_Downs:_OEE_Performance_By_Asset"><span class="mw-headline" id="Drill_Downs:_OEE_Performance_By_Asset"><span class="mw-headline" id="Drill_Downs:_OEE_Performance_By_Asset"><span class="mw-headline" id="Drill_Downs:_OEE_Performance_By_Asset"><span class="mw-headline" id="Drill_Downs:_OEE_Performance_By_Asset"><span class="mw-headline" id="Drill_Downs:_OEE_Performance_By_Asset"><span class="mw-headline" id="Drill_Downs:_OEE_Performance_By_Asset"><span class="mw-headline" id="Drill_Downs:_OEE_Performance_By_Asset"><span class="mw-headline" id="Drill_Downs:_OEE_Performance_By_Asset"><span class="mw-headline" id="Drill_Downs:_OEE_Performance_By_Asset"><span class="mw-headline" id="Drill_Downs:_OEE_Performance_By_Asset">Drill Downs: OEE Performance By Asset</span></span></span></span></span></span></span></span></span></span></span></span></span></span></span></span></span></span></span></span></span></span></span></span></span></span></span></span></span></span></span></span></span></span></span></span></span></span></span></span></span></span></span></span></span></span></span></span></span></span></span></span></span></span></span></span> === | |
| − | + | To see the corresponding OEE Performance by asset Charts: | |
| + | |||
| + | #Select the OEE value in the center of the gauge. | ||
| | ||
| − | + | '''Figure 128: First Drill Down''' | |
| − | + | [[File:Mw-FirstDrillDown.png|border|600px|Mw-FirstDrillDown.png]] | |
| − | + | ||
| + | | ||
<ol start="2"> | <ol start="2"> | ||
| − | <li> | + | <li>The OEE Performance by Asset chart will show</li> |
</ol> | </ol> | ||
| − | * | + | <br/> '''Figure 129: OEE Performance by Asset''' |
| + | |||
| + | '''[[File:Mw-OEEPerformancebyAsset.png|900px|MW-OEEPerformancebyAsset.png]]''' | ||
| + | |||
| + | | ||
| + | |||
| + | '''Calculation: '''Parallel/Serie. | ||
| + | |||
| + | *'''Parallel: '''The Line OEE value will show the OEE average value of all the assets. | ||
| + | *'''Serial: '''The Line OEE value will show the OEE asset with the less OEE belonging to the line selected. | ||
| + | |||
| + | '''Select the desired report. See Drill Downs:''' Root Cause Analysis Reports to see how the reports and prompts appear in the system. | ||
| + | |||
| + | <u>'''Note:'''</u> Please make sure to first configure: Location, department, and production line, before viewing the reports. | ||
| + | |||
| + | | ||
| + | |||
| + | | ||
| + | |||
| + | | ||
| + | |||
| + | == <span class="mw-headline" id="OEE_Report"><span class="mw-headline" id="OEE_Report"><span class="mw-headline" id="OEE_Report"><span class="mw-headline" id="OEE_Report"><span class="mw-headline" id="OEE_Report"><span class="mw-headline" id="OEE_Report"><span class="mw-headline" id="OEE_Report"><span class="mw-headline" id="OEE_Report"><span class="mw-headline" id="OEE_Report"><span class="mw-headline" id="OEE_Report"><span class="mw-headline" id="OEE_Report"><span class="mw-headline" id="OEE_Report"><span class="mw-headline" id="OEE_Report"><span class="mw-headline" id="OEE_Report"><span class="mw-headline" id="OEE_Report"><span class="mw-headline" id="OEE_Report"><span class="mw-headline" id="OEE_Report"><span class="mw-headline" id="OEE_Report"><span class="mw-headline" id="OEE_Report"><span class="mw-headline" id="OEE_Report"><span class="mw-headline" id="OEE_Report"><span class="mw-headline" id="OEE_Report"><span class="mw-headline" id="OEE_Report"><span class="mw-headline" id="OEE_Report"><span class="mw-headline" id="OEE_Report"><span class="mw-headline" id="OEE_Report"><span class="mw-headline" id="OEE_Report"><span class="mw-headline" id="OEE_Report"><span class="mw-headline" id="OEE_Report"><span class="mw-headline" id="OEE_Report"><span class="mw-headline" id="OEE_Report"><span class="mw-headline" id="OEE_Report"><span class="mw-headline" id="OEE_Report"><span class="mw-headline" id="OEE_Report"><span class="mw-headline" id="OEE_Report"><span class="mw-headline" id="OEE_Report"><span class="mw-headline" id="OEE_Report"><span class="mw-headline" id="OEE_Report"><span class="mw-headline" id="OEE_Report"><span class="mw-headline" id="OEE_Report"><span class="mw-headline" id="OEE_Report"><span class="mw-headline" id="OEE_Report"><span class="mw-headline" id="OEE_Report"><span class="mw-headline" id="OEE_Report"><span class="mw-headline" id="OEE_Report"><span class="mw-headline" id="OEE_Report"><span class="mw-headline" id="OEE_Report"><span class="mw-headline" id="OEE_Report"><span class="mw-headline" id="OEE_Report"><span class="mw-headline" id="OEE_Report"><span class="mw-headline" id="OEE_Report"><span class="mw-headline" id="OEE_Report"><span class="mw-headline" id="OEE_Report"><span class="mw-headline" id="OEE_Report"><span class="mw-headline" id="OEE_Report">OEE Report</span></span></span></span></span></span></span></span></span></span></span></span></span></span></span></span></span></span></span></span></span></span></span></span></span></span></span></span></span></span></span></span></span></span></span></span></span></span></span></span></span></span></span></span></span></span></span></span></span></span></span></span></span></span></span> == | ||
| + | |||
| + | The '''OEE Report''' is a linear report that includes the OEE metric (A, P, Q) for each asset by production line over time, according to Asset. | ||
| + | |||
| + | *'''Drill Down:''' Users can access the corresponding'''Downtime Problem and Downtime Root Cause Charts''', as well as a corresponding individual problem, reports through this report. | ||
| + | |||
| + | Other Drill Down Reports available include: | ||
| + | |||
| + | *'''OEE Availability '''Drill Down | ||
| + | *'''OEE Performance''' Detail Drill Down | ||
| + | *'''OEE Quality '''Detail Drill Down | ||
| + | *'''Production Time''' | ||
| + | *'''Scheduled Downtime''' | ||
| + | *'''Unscheduled Downtime''' | ||
| + | *'''Chart Type:''' The OEE Report is displayed in a linear Report style format. | ||
| + | |||
| + | | ||
| + | |||
| + | #Select '''Data Source''' | ||
| + | #'''Select Site: '''Select the Plant’s Location | ||
| + | |||
| + | === <span class="mw-headline" id="Parameters_for_OEE_Report"><span class="mw-headline" id="Parameters_for_OEE_Report"><span class="mw-headline" id="Parameters_for_OEE_Report"><span class="mw-headline" id="Parameters_for_OEE_Report"><span class="mw-headline" id="Parameters_for_OEE_Report"><span class="mw-headline" id="Parameters_for_OEE_Report"><span class="mw-headline" id="Parameters_for_OEE_Report"><span class="mw-headline" id="Parameters_for_OEE_Report"><span class="mw-headline" id="Parameters_for_OEE_Report"><span class="mw-headline" id="Parameters_for_OEE_Report"><span class="mw-headline" id="Parameters_for_OEE_Report"><span class="mw-headline" id="Parameters_for_OEE_Report"><span class="mw-headline" id="Parameters_for_OEE_Report"><span class="mw-headline" id="Parameters_for_OEE_Report"><span class="mw-headline" id="Parameters_for_OEE_Report"><span class="mw-headline" id="Parameters_for_OEE_Report"><span class="mw-headline" id="Parameters_for_OEE_Report"><span class="mw-headline" id="Parameters_for_OEE_Report"><span class="mw-headline" id="Parameters_for_OEE_Report"><span class="mw-headline" id="Parameters_for_OEE_Report"><span class="mw-headline" id="Parameters_for_OEE_Report"><span class="mw-headline" id="Parameters_for_OEE_Report"><span class="mw-headline" id="Parameters_for_OEE_Report"><span class="mw-headline" id="Parameters_for_OEE_Report"><span class="mw-headline" id="Parameters_for_OEE_Report"><span class="mw-headline" id="Parameters_for_OEE_Report"><span class="mw-headline" id="Parameters_for_OEE_Report"><span class="mw-headline" id="Parameters_for_OEE_Report"><span class="mw-headline" id="Parameters_for_OEE_Report"><span class="mw-headline" id="Parameters_for_OEE_Report"><span class="mw-headline" id="Parameters_for_OEE_Report"><span class="mw-headline" id="Parameters_for_OEE_Report"><span class="mw-headline" id="Parameters_for_OEE_Report"><span class="mw-headline" id="Parameters_for_OEE_Report"><span class="mw-headline" id="Parameters_for_OEE_Report"><span class="mw-headline" id="Parameters_for_OEE_Report"><span class="mw-headline" id="Parameters_for_OEE_Report"><span class="mw-headline" id="Parameters_for_OEE_Report"><span class="mw-headline" id="Parameters_for_OEE_Report"><span class="mw-headline" id="Parameters_for_OEE_Report"><span class="mw-headline" id="Parameters_for_OEE_Report"><span class="mw-headline" id="Parameters_for_OEE_Report"><span class="mw-headline" id="Parameters_for_OEE_Report"><span class="mw-headline" id="Parameters_for_OEE_Report"><span class="mw-headline" id="Parameters_for_OEE_Report"><span class="mw-headline" id="Parameters_for_OEE_Report"><span class="mw-headline" id="Parameters_for_OEE_Report"><span class="mw-headline" id="Parameters_for_OEE_Report"><span class="mw-headline" id="Parameters_for_OEE_Report"><span class="mw-headline" id="Parameters_for_OEE_Report"><span class="mw-headline" id="Parameters_for_OEE_Report"><span class="mw-headline" id="Parameters_for_OEE_Report"><span class="mw-headline" id="Parameters_for_OEE_Report"><span class="mw-headline" id="Parameters_for_OEE_Report"><span class="mw-headline" id="Parameters_for_OEE_Report"><span class="mw-headline" id="Parameters_for_OEE_Report">Parameters for OEE Report</span></span></span></span></span></span></span></span></span></span></span></span></span></span></span></span></span></span></span></span></span></span></span></span></span></span></span></span></span></span></span></span></span></span></span></span></span></span></span></span></span></span></span></span></span></span></span></span></span></span></span></span></span></span></span></span> === | ||
<ol start="3"> | <ol start="3"> | ||
| − | <li>''' | + | <li>'''Select '''Parameters in '''Step 3'''</li> |
</ol> | </ol> | ||
| + | |||
| + | *'''Line Name: '''(Optional) Select the manufacturing line | ||
| + | *'''Asset ID (Asset Name): '''(Optional) Select the name of the Asset to analyze | ||
| + | *'''Date Range:''' | ||
| + | * | ||
| + | **'''From: '''Selects the time period for the report using the drop-down calendar | ||
| + | * | ||
| + | **'''To: '''Select the time period for the report using the drop-down calendar | ||
| + | *'''Group By: '''Select the option to group by '''Month, Week, Shift, or Day''' | ||
| + | *'''Display Data as: '''Selects the view options of the file | ||
| + | *'''Parameters: (Checked by default) Uncheck to see parameters displayed next to the report.''' | ||
| + | *'''Refresh Rate: (Do not Refresh is the default) Users can change the refresh rate by minutes up to one hour.''' | ||
| + | |||
| + | | ||
| + | |||
| + | '''Figure 130: OEE Report''' | ||
| + | |||
| + | [[File:MESWeb OEER.png|900px|MESWeb OEER.png]] | ||
| | ||
| + | |||
| + | To see the OEE Availability report for each OEE Configuration Report, click on the Availability name. | ||
| | ||
| − | + | '''Figure 131: OEE Availability''' | |
| − | + | '''[[File:MESWeb OEEAV.png|border|900px|MESWeb OEEAV.png]]''' | |
| | ||
| − | + | | |
| − | '''[[File: | + | == <span class="mw-headline" id="OEE_Trend_Chart_Report"><span class="mw-headline" id="OEE_Trend_Chart_Report"><span class="mw-headline" id="OEE_Trend_Chart_Report"><span class="mw-headline" id="OEE_Trend_Chart_Report"><span class="mw-headline" id="OEE_Trend_Chart_Report"><span class="mw-headline" id="OEE_Trend_Chart_Report"><span class="mw-headline" id="OEE_Trend_Chart_Report"><span class="mw-headline" id="OEE_Trend_Chart_Report"><span class="mw-headline" id="OEE_Trend_Chart_Report"><span class="mw-headline" id="OEE_Trend_Chart_Report"><span class="mw-headline" id="OEE_Trend_Chart_Report"><span class="mw-headline" id="OEE_Trend_Chart_Report"><span class="mw-headline" id="OEE_Trend_Chart_Report"><span class="mw-headline" id="OEE_Trend_Chart_Report"><span class="mw-headline" id="OEE_Trend_Chart_Report"><span class="mw-headline" id="OEE_Trend_Chart_Report"><span class="mw-headline" id="OEE_Trend_Chart_Report"><span class="mw-headline" id="OEE_Trend_Chart_Report"><span class="mw-headline" id="OEE_Trend_Chart_Report"><span class="mw-headline" id="OEE_Trend_Chart_Report"><span class="mw-headline" id="OEE_Trend_Chart_Report"><span class="mw-headline" id="OEE_Trend_Chart_Report"><span class="mw-headline" id="OEE_Trend_Chart_Report"><span class="mw-headline" id="OEE_Trend_Chart_Report"><span class="mw-headline" id="OEE_Trend_Chart_Report"><span class="mw-headline" id="OEE_Trend_Chart_Report"><span class="mw-headline" id="OEE_Trend_Chart_Report"><span class="mw-headline" id="OEE_Trend_Chart_Report"><span class="mw-headline" id="OEE_Trend_Chart_Report"><span class="mw-headline" id="OEE_Trend_Chart_Report"><span class="mw-headline" id="OEE_Trend_Chart_Report"><span class="mw-headline" id="OEE_Trend_Chart_Report"><span class="mw-headline" id="OEE_Trend_Chart_Report"><span class="mw-headline" id="OEE_Trend_Chart_Report"><span class="mw-headline" id="OEE_Trend_Chart_Report"><span class="mw-headline" id="OEE_Trend_Chart_Report"><span class="mw-headline" id="OEE_Trend_Chart_Report"><span class="mw-headline" id="OEE_Trend_Chart_Report"><span class="mw-headline" id="OEE_Trend_Chart_Report"><span class="mw-headline" id="OEE_Trend_Chart_Report"><span class="mw-headline" id="OEE_Trend_Chart_Report"><span class="mw-headline" id="OEE_Trend_Chart_Report"><span class="mw-headline" id="OEE_Trend_Chart_Report"><span class="mw-headline" id="OEE_Trend_Chart_Report"><span class="mw-headline" id="OEE_Trend_Chart_Report"><span class="mw-headline" id="OEE_Trend_Chart_Report"><span class="mw-headline" id="OEE_Trend_Chart_Report"><span class="mw-headline" id="OEE_Trend_Chart_Report"><span class="mw-headline" id="OEE_Trend_Chart_Report"><span class="mw-headline" id="OEE_Trend_Chart_Report"><span class="mw-headline" id="OEE_Trend_Chart_Report"><span class="mw-headline" id="OEE_Trend_Chart_Report"><span class="mw-headline" id="OEE_Trend_Chart_Report"><span class="mw-headline" id="OEE_Trend_Chart_Report"><span class="mw-headline" id="OEE_Trend_Chart_Report"><span class="mw-headline" id="OEE_Trend_Chart_Report"><span class="mw-headline" id="OEE_Trend_Chart_Report">OEE Trend Chart Report</span></span></span></span></span></span></span></span></span></span></span></span></span></span></span></span></span></span></span></span></span></span></span></span></span></span></span></span></span></span></span></span></span></span></span></span></span></span></span></span></span></span></span></span></span></span></span></span></span></span></span></span></span></span></span></span></span> == |
| + | |||
| + | The OEE Configuration Trend Chart shows historical data to coincide with live time OEE Configuration reports defined in Operations Dashboard. | ||
| + | |||
| + | '''Drill Down:''' Users can access the corresponding '''Downtime Problem and Downtime Root Cause Charts''', as well as corresponding individual reports through this report. | ||
| + | |||
| + | '''Chart Type: '''Data displays in Pareto Charts. | ||
| + | |||
| + | #'''Select Data Source''' | ||
| + | #'''Select Site''' | ||
| + | #'''Select Next''' | ||
| + | #'''Select Parameter in Step 3''' | ||
| + | |||
| + | *'''Line: '''(Optional) Select the manufacturing line | ||
| + | *'''Asset: '''(Optional) Select the machine to analyze its performance | ||
| + | *'''Date Range: '''Select the time period for the report using the drop-down calendar | ||
| + | *'''Display By:''' Select Day, Week, or Month (Month is Default) | ||
| + | *'''Parameters:''' (Checked by default) Uncheck to see parameters displayed next to the report | ||
| + | *'''Refresh Rate:''' (Do not Refresh is the default) Users can change the refresh rate by minutes up to one hour | ||
| + | |||
| + | <br/> <br/> '''Figure 132: OEE Trend Chart''' | ||
| + | |||
| + | '''[[File:MESWeb OEETrendChart.png|900px|MESWeb OEETrendChart.png]]''' | ||
| | ||
| − | + | | |
| − | + | | |
| + | |||
| + | === <span class="mw-headline" id="Drill_Downs:_OEE_Configuration_Trend_Chart"><span class="mw-headline" id="Drill_Downs:_OEE_Configuration_Trend_Chart"><span class="mw-headline" id="Drill_Downs:_OEE_Configuration_Trend_Chart"><span class="mw-headline" id="Drill_Downs:_OEE_Configuration_Trend_Chart"><span class="mw-headline" id="Drill_Downs:_OEE_Configuration_Trend_Chart"><span class="mw-headline" id="Drill_Downs:_OEE_Configuration_Trend_Chart"><span class="mw-headline" id="Drill_Downs:_OEE_Configuration_Trend_Chart"><span class="mw-headline" id="Drill_Downs:_OEE_Configuration_Trend_Chart"><span class="mw-headline" id="Drill_Downs:_OEE_Configuration_Trend_Chart"><span class="mw-headline" id="Drill_Downs:_OEE_Configuration_Trend_Chart"><span class="mw-headline" id="Drill_Downs:_OEE_Configuration_Trend_Chart"><span class="mw-headline" id="Drill_Downs:_OEE_Configuration_Trend_Chart"><span class="mw-headline" id="Drill_Downs:_OEE_Configuration_Trend_Chart"><span class="mw-headline" id="Drill_Downs:_OEE_Configuration_Trend_Chart"><span class="mw-headline" id="Drill_Downs:_OEE_Configuration_Trend_Chart"><span class="mw-headline" id="Drill_Downs:_OEE_Configuration_Trend_Chart"><span class="mw-headline" id="Drill_Downs:_OEE_Configuration_Trend_Chart"><span class="mw-headline" id="Drill_Downs:_OEE_Configuration_Trend_Chart"><span class="mw-headline" id="Drill_Downs:_OEE_Configuration_Trend_Chart"><span class="mw-headline" id="Drill_Downs:_OEE_Configuration_Trend_Chart"><span class="mw-headline" id="Drill_Downs:_OEE_Configuration_Trend_Chart"><span class="mw-headline" id="Drill_Downs:_OEE_Configuration_Trend_Chart"><span class="mw-headline" id="Drill_Downs:_OEE_Configuration_Trend_Chart"><span class="mw-headline" id="Drill_Downs:_OEE_Configuration_Trend_Chart"><span class="mw-headline" id="Drill_Downs:_OEE_Configuration_Trend_Chart"><span class="mw-headline" id="Drill_Downs:_OEE_Configuration_Trend_Chart"><span class="mw-headline" id="Drill_Downs:_OEE_Configuration_Trend_Chart"><span class="mw-headline" id="Drill_Downs:_OEE_Configuration_Trend_Chart"><span class="mw-headline" id="Drill_Downs:_OEE_Configuration_Trend_Chart"><span class="mw-headline" id="Drill_Downs:_OEE_Configuration_Trend_Chart"><span class="mw-headline" id="Drill_Downs:_OEE_Configuration_Trend_Chart"><span class="mw-headline" id="Drill_Downs:_OEE_Configuration_Trend_Chart"><span class="mw-headline" id="Drill_Downs:_OEE_Configuration_Trend_Chart"><span class="mw-headline" id="Drill_Downs:_OEE_Configuration_Trend_Chart"><span class="mw-headline" id="Drill_Downs:_OEE_Configuration_Trend_Chart"><span class="mw-headline" id="Drill_Downs:_OEE_Configuration_Trend_Chart"><span class="mw-headline" id="Drill_Downs:_OEE_Configuration_Trend_Chart"><span class="mw-headline" id="Drill_Downs:_OEE_Configuration_Trend_Chart"><span class="mw-headline" id="Drill_Downs:_OEE_Configuration_Trend_Chart"><span class="mw-headline" id="Drill_Downs:_OEE_Configuration_Trend_Chart"><span class="mw-headline" id="Drill_Downs:_OEE_Configuration_Trend_Chart"><span class="mw-headline" id="Drill_Downs:_OEE_Configuration_Trend_Chart"><span class="mw-headline" id="Drill_Downs:_OEE_Configuration_Trend_Chart"><span class="mw-headline" id="Drill_Downs:_OEE_Configuration_Trend_Chart"><span class="mw-headline" id="Drill_Downs:_OEE_Configuration_Trend_Chart"><span class="mw-headline" id="Drill_Downs:_OEE_Configuration_Trend_Chart"><span class="mw-headline" id="Drill_Downs:_OEE_Configuration_Trend_Chart"><span class="mw-headline" id="Drill_Downs:_OEE_Configuration_Trend_Chart"><span class="mw-headline" id="Drill_Downs:_OEE_Configuration_Trend_Chart"><span class="mw-headline" id="Drill_Downs:_OEE_Configuration_Trend_Chart"><span class="mw-headline" id="Drill_Downs:_OEE_Configuration_Trend_Chart"><span class="mw-headline" id="Drill_Downs:_OEE_Configuration_Trend_Chart"><span class="mw-headline" id="Drill_Downs:_OEE_Configuration_Trend_Chart"><span class="mw-headline" id="Drill_Downs:_OEE_Configuration_Trend_Chart"><span class="mw-headline" id="Drill_Downs:_OEE_Configuration_Trend_Chart"><span class="mw-headline" id="Drill_Downs:_OEE_Configuration_Trend_Chart"><span class="mw-headline" id="Drill_Downs:_OEE_Configuration_Trend_Chart"><span class="mw-headline" id="Drill_Downs:_OEE_Configuration_Trend_Chart">Drill Downs: OEE Configuration Trend Chart </span></span></span></span></span></span></span></span></span></span></span></span></span></span></span></span></span></span></span></span></span></span></span></span></span></span></span></span></span></span></span></span></span></span></span></span></span></span></span></span></span></span></span></span></span></span></span></span></span></span></span></span></span></span></span></span></span></span> === | ||
| + | |||
| + | To see the corresponding Downtime Problem Analysis and Root Cause Analysis Charts: | ||
| + | |||
| + | #Select the data point on the OEE Configuration Trend Chart. The charts will display. | ||
| + | #Double click on the section of the pie to select reports specific to that problem and corresponding Work Orders. | ||
| + | |||
| + | | ||
| + | |||
| + | '''Figure 133: First Drill Down for OEE Configuration Trend Chart''' | ||
| + | |||
| + | '''[[File:MESWeb FirstDrillDownforOEEConfigurationTrendChart.png|900px|MESWeb FirstDrillDownforOEEConfigurationTrendChart.png]]''' | ||
| + | |||
| + | | ||
| + | |||
| + | *'''Downtime Trend and Frequency Report''' | ||
| + | *'''Work Order Report by Problem''' | ||
| + | |||
| + | <br/> '''Figure 134: Second Drilldown: OEE Configuration Trend Chart''' | ||
| + | |||
| + | '''[[File:MW-Second Drilldown OEEConfigurationTrendChart.png|900px|MW-Second Drilldown OEEConfigurationTrendChart.png]]''' | ||
| | ||
| − | ''' | + | '''Select the desired report.''' |
| + | |||
| + | | ||
| + | |||
| + | | ||
| + | |||
| + | == <span class="mw-headline" id="OEE_Asset_Status"><span class="mw-headline" id="OEE_Asset_Status"><span class="mw-headline" id="OEE_Asset_Status"><span class="mw-headline" id="OEE_Asset_Status"><span class="mw-headline" id="OEE_Asset_Status"><span class="mw-headline" id="OEE_Asset_Status"><span class="mw-headline" id="OEE_Asset_Status"><span class="mw-headline" id="OEE_Asset_Status"><span class="mw-headline" id="OEE_Asset_Status"><span class="mw-headline" id="OEE_Asset_Status"><span class="mw-headline" id="OEE_Asset_Status"><span class="mw-headline" id="OEE_Asset_Status"><span class="mw-headline" id="OEE_Asset_Status"><span class="mw-headline" id="OEE_Asset_Status"><span class="mw-headline" id="OEE_Asset_Status"><span class="mw-headline" id="OEE_Asset_Status"><span class="mw-headline" id="OEE_Asset_Status"><span class="mw-headline" id="OEE_Asset_Status"><span class="mw-headline" id="OEE_Asset_Status"><span class="mw-headline" id="OEE_Asset_Status"><span class="mw-headline" id="OEE_Asset_Status"><span class="mw-headline" id="OEE_Asset_Status"><span class="mw-headline" id="OEE_Asset_Status"><span class="mw-headline" id="OEE_Asset_Status"><span class="mw-headline" id="OEE_Asset_Status"><span class="mw-headline" id="OEE_Asset_Status"><span class="mw-headline" id="OEE_Asset_Status"><span class="mw-headline" id="OEE_Asset_Status"><span class="mw-headline" id="OEE_Asset_Status"><span class="mw-headline" id="OEE_Asset_Status"><span class="mw-headline" id="OEE_Asset_Status"><span class="mw-headline" id="OEE_Asset_Status"><span class="mw-headline" id="OEE_Asset_Status"><span class="mw-headline" id="OEE_Asset_Status"><span class="mw-headline" id="OEE_Asset_Status"><span class="mw-headline" id="OEE_Asset_Status"><span class="mw-headline" id="OEE_Asset_Status"><span class="mw-headline" id="OEE_Asset_Status"><span class="mw-headline" id="OEE_Asset_Status"><span class="mw-headline" id="OEE_Asset_Status"><span class="mw-headline" id="OEE_Asset_Status"><span class="mw-headline" id="OEE_Asset_Status"><span class="mw-headline" id="OEE_Asset_Status"><span class="mw-headline" id="OEE_Asset_Status"><span class="mw-headline" id="OEE_Asset_Status"><span class="mw-headline" id="OEE_Asset_Status"><span class="mw-headline" id="OEE_Asset_Status"><span class="mw-headline" id="OEE_Asset_Status"><span class="mw-headline" id="OEE_Asset_Status"><span class="mw-headline" id="OEE_Asset_Status"><span class="mw-headline" id="OEE_Asset_Status"><span class="mw-headline" id="OEE_Asset_Status"><span class="mw-headline" id="OEE_Asset_Status"><span class="mw-headline" id="OEE_Asset_Status"><span class="mw-headline" id="OEE_Asset_Status">OEE Asset Status</span></span></span></span></span></span></span></span></span></span></span></span></span></span></span></span></span></span></span></span></span></span></span></span></span></span></span></span></span></span></span></span></span></span></span></span></span></span></span></span></span></span></span></span></span></span></span></span></span></span></span></span></span></span></span> == | ||
| + | |||
| + | The OEE Asset Status report can show the different asset statuses Running, Spare, In Maintenance, Unscheduled Down, Scheduled Down, Setup, Idle, and Calibration. | ||
| + | |||
| + | '''Drill Down:''' Users can access the corresponding '''Downtime Problem and Downtime Root Cause Charts''', as well as corresponding individual reports through this report. | ||
| − | ''' | + | '''Chart Type:''' Data displays in Pareto Charts. |
| + | |||
| + | #'''Select Data Source''' | ||
| + | #'''Select Site''' | ||
| + | #'''Select Next''' | ||
| + | #'''Select Parameters in Step 3''' | ||
| | ||
| + | |||
| + | *'''Location: '''(Optional) Select the location | ||
| + | *'''Or Line: '''(Optional) Select the manufacturing line | ||
| + | *'''Or Asset: (Optional) Select the machine to analyze its performance.''' | ||
| + | *'''Date Range: Select the time period for the report using the drop-down calendar.''' | ||
| + | *'''Parameters: (Checked by default) Uncheck to see parameters displayed next to the report.''' | ||
| + | *'''Refresh Rate: (Do not Refresh is the default) Users can change the refresh rate by minutes up to one hour.''' | ||
| + | |||
| + | <br/> '''Figure 135: OEE Asset Status''' | ||
| + | |||
| + | [[File:MW-OEE Asset Status.png|900px|MW-OEE Asset Status.png]] | ||
| | ||
| − | = <span class="mw-headline" id=" | + | === <span class="mw-headline" id="Drill_Downs:_OEE_Asset_Status_Problem_and_Trend_Chart"><span class="mw-headline" id="Drill_Downs:_OEE_Asset_Status_Problem_and_Trend_Chart"><span class="mw-headline" id="Drill_Downs:_OEE_Asset_Status_Problem_and_Trend_Chart"><span class="mw-headline" id="Drill_Downs:_OEE_Asset_Status_Problem_and_Trend_Chart"><span class="mw-headline" id="Drill_Downs:_OEE_Asset_Status_Problem_and_Trend_Chart"><span class="mw-headline" id="Drill_Downs:_OEE_Asset_Status_Problem_and_Trend_Chart"><span class="mw-headline" id="Drill_Downs:_OEE_Asset_Status_Problem_and_Trend_Chart"><span class="mw-headline" id="Drill_Downs:_OEE_Asset_Status_Problem_and_Trend_Chart"><span class="mw-headline" id="Drill_Downs:_OEE_Asset_Status_Problem_and_Trend_Chart"><span class="mw-headline" id="Drill_Downs:_OEE_Asset_Status_Problem_and_Trend_Chart"><span class="mw-headline" id="Drill_Downs:_OEE_Asset_Status_Problem_and_Trend_Chart"><span class="mw-headline" id="Drill_Downs:_OEE_Asset_Status_Problem_and_Trend_Chart"><span class="mw-headline" id="Drill_Downs:_OEE_Asset_Status_Problem_and_Trend_Chart"><span class="mw-headline" id="Drill_Downs:_OEE_Asset_Status_Problem_and_Trend_Chart"><span class="mw-headline" id="Drill_Downs:_OEE_Asset_Status_Problem_and_Trend_Chart"><span class="mw-headline" id="Drill_Downs:_OEE_Asset_Status_Problem_and_Trend_Chart"><span class="mw-headline" id="Drill_Downs:_OEE_Asset_Status_Problem_and_Trend_Chart"><span class="mw-headline" id="Drill_Downs:_OEE_Asset_Status_Problem_and_Trend_Chart"><span class="mw-headline" id="Drill_Downs:_OEE_Asset_Status_Problem_and_Trend_Chart"><span class="mw-headline" id="Drill_Downs:_OEE_Asset_Status_Problem_and_Trend_Chart"><span class="mw-headline" id="Drill_Downs:_OEE_Asset_Status_Problem_and_Trend_Chart"><span class="mw-headline" id="Drill_Downs:_OEE_Asset_Status_Problem_and_Trend_Chart"><span class="mw-headline" id="Drill_Downs:_OEE_Asset_Status_Problem_and_Trend_Chart"><span class="mw-headline" id="Drill_Downs:_OEE_Asset_Status_Problem_and_Trend_Chart"><span class="mw-headline" id="Drill_Downs:_OEE_Asset_Status_Problem_and_Trend_Chart"><span class="mw-headline" id="Drill_Downs:_OEE_Asset_Status_Problem_and_Trend_Chart"><span class="mw-headline" id="Drill_Downs:_OEE_Asset_Status_Problem_and_Trend_Chart"><span class="mw-headline" id="Drill_Downs:_OEE_Asset_Status_Problem_and_Trend_Chart"><span class="mw-headline" id="Drill_Downs:_OEE_Asset_Status_Problem_and_Trend_Chart"><span class="mw-headline" id="Drill_Downs:_OEE_Asset_Status_Problem_and_Trend_Chart"><span class="mw-headline" id="Drill_Downs:_OEE_Asset_Status_Problem_and_Trend_Chart"><span class="mw-headline" id="Drill_Downs:_OEE_Asset_Status_Problem_and_Trend_Chart"><span class="mw-headline" id="Drill_Downs:_OEE_Asset_Status_Problem_and_Trend_Chart"><span class="mw-headline" id="Drill_Downs:_OEE_Asset_Status_Problem_and_Trend_Chart"><span class="mw-headline" id="Drill_Downs:_OEE_Asset_Status_Problem_and_Trend_Chart"><span class="mw-headline" id="Drill_Downs:_OEE_Asset_Status_Problem_and_Trend_Chart"><span class="mw-headline" id="Drill_Downs:_OEE_Asset_Status_Problem_and_Trend_Chart"><span class="mw-headline" id="Drill_Downs:_OEE_Asset_Status_Problem_and_Trend_Chart"><span class="mw-headline" id="Drill_Downs:_OEE_Asset_Status_Problem_and_Trend_Chart"><span class="mw-headline" id="Drill_Downs:_OEE_Asset_Status_Problem_and_Trend_Chart"><span class="mw-headline" id="Drill_Downs:_OEE_Asset_Status_Problem_and_Trend_Chart"><span class="mw-headline" id="Drill_Downs:_OEE_Asset_Status_Problem_and_Trend_Chart"><span class="mw-headline" id="Drill_Downs:_OEE_Asset_Status_Problem_and_Trend_Chart"><span class="mw-headline" id="Drill_Downs:_OEE_Asset_Status_Problem_and_Trend_Chart"><span class="mw-headline" id="Drill_Downs:_OEE_Asset_Status_Problem_and_Trend_Chart"><span class="mw-headline" id="Drill_Downs:_OEE_Asset_Status_Problem_and_Trend_Chart"><span class="mw-headline" id="Drill_Downs:_OEE_Asset_Status_Problem_and_Trend_Chart"><span class="mw-headline" id="Drill_Downs:_OEE_Asset_Status_Problem_and_Trend_Chart"><span class="mw-headline" id="Drill_Downs:_OEE_Asset_Status_Problem_and_Trend_Chart"><span class="mw-headline" id="Drill_Downs:_OEE_Asset_Status_Problem_and_Trend_Chart"><span class="mw-headline" id="Drill_Downs:_OEE_Asset_Status_Problem_and_Trend_Chart"><span class="mw-headline" id="Drill_Downs:_OEE_Asset_Status_Problem_and_Trend_Chart"><span class="mw-headline" id="Drill_Downs:_OEE_Asset_Status_Problem_and_Trend_Chart"><span class="mw-headline" id="Drill_Downs:_OEE_Asset_Status_Problem_and_Trend_Chart"><span class="mw-headline" id="Drill_Downs:_OEE_Asset_Status_Problem_and_Trend_Chart"><span class="mw-headline" id="_Drill_Downs:_OEE_Asset_Status_Problem_and_Trend_Chart">Drill Downs: OEE Asset Status Problem and Trend Chart </span></span></span></span></span></span></span></span></span></span></span></span></span></span></span></span></span></span></span></span></span></span></span></span></span></span></span></span></span></span></span></span></span></span></span></span></span></span></span></span></span></span></span></span></span></span></span></span></span></span></span></span></span></span></span></span> === |
| − | + | To see the corresponding Asset Status Problem Analysis: | |
| − | + | #Select the data point on the OEE Asset Status Problem Chart. The charts will display. | |
| − | + | '''Figure 136: OEE Asset Status trill down''' | |
| − | + | [[File:MW-OEE Asset Status Trill Down.png|900px|MW-OEE Asset Status Trill Down.png]] | |
| | ||
| − | + | '''Figure 137: First Drill Down for OEE Asset Status Problem Chart''' | |
| − | + | ||
| + | [[File:MW-First DrillDownforOEEAssetStatusProblemChart.png|900px|MW-First DrillDownforOEEAssetStatusProblemChart.png]] | ||
| | ||
| + | <ol start="2"> | ||
| + | <li>Select the data point on the OEE Asset Status Trend Chart. The charts will display.</li> | ||
| + | </ol> | ||
| − | + | | |
| − | '''[[File: | + | '''Figure 138: Second Drilldown: OEE Asset Status Trend Chart''' |
| + | |||
| + | '''[[File:MW-Second DrilldownOEEAssetStatusTrendChart.png|900px|MW-Second DrilldownOEEAssetStatusTrendChart.png]]''' | ||
| | ||
| Line 1,233: | Line 3,093: | ||
| | ||
| − | + | == <span class="mw-headline" id="System_Connectivity_Chart"><span class="mw-headline" id="System_Connectivity_Chart"><span class="mw-headline" id="System_Connectivity_Chart"><span class="mw-headline" id="System_Connectivity_Chart"><span class="mw-headline" id="System_Connectivity_Chart"><span class="mw-headline" id="System_Connectivity_Chart"><span class="mw-headline" id="System_Connectivity_Chart"><span class="mw-headline" id="System_Connectivity_Chart"><span class="mw-headline" id="System_Connectivity_Chart"><span class="mw-headline" id="System_Connectivity_Chart"><span class="mw-headline" id="System_Connectivity_Chart"><span class="mw-headline" id="System_Connectivity_Chart"><span class="mw-headline" id="System_Connectivity_Chart"><span class="mw-headline" id="System_Connectivity_Chart"><span class="mw-headline" id="System_Connectivity_Chart"><span class="mw-headline" id="System_Connectivity_Chart"><span class="mw-headline" id="System_Connectivity_Chart"><span class="mw-headline" id="System_Connectivity_Chart"><span class="mw-headline" id="System_Connectivity_Chart"><span class="mw-headline" id="System_Connectivity_Chart"><span class="mw-headline" id="System_Connectivity_Chart"><span class="mw-headline" id="System_Connectivity_Chart"><span class="mw-headline" id="System_Connectivity_Chart"><span class="mw-headline" id="System_Connectivity_Chart"><span class="mw-headline" id="System_Connectivity_Chart"><span class="mw-headline" id="System_Connectivity_Chart"><span class="mw-headline" id="System_Connectivity_Chart"><span class="mw-headline" id="System_Connectivity_Chart"><span class="mw-headline" id="System_Connectivity_Chart"><span class="mw-headline" id="System_Connectivity_Chart"><span class="mw-headline" id="System_Connectivity_Chart"><span class="mw-headline" id="System_Connectivity_Chart"><span class="mw-headline" id="System_Connectivity_Chart"><span class="mw-headline" id="System_Connectivity_Chart"><span class="mw-headline" id="System_Connectivity_Chart"><span class="mw-headline" id="System_Connectivity_Chart"><span class="mw-headline" id="System_Connectivity_Chart"><span class="mw-headline" id="System_Connectivity_Chart"><span class="mw-headline" id="System_Connectivity_Chart"><span class="mw-headline" id="System_Connectivity_Chart"><span class="mw-headline" id="System_Connectivity_Chart"><span class="mw-headline" id="System_Connectivity_Chart"><span class="mw-headline" id="System_Connectivity_Chart"><span class="mw-headline" id="System_Connectivity_Chart"><span class="mw-headline" id="System_Connectivity_Chart"><span class="mw-headline" id="System_Connectivity_Chart"><span class="mw-headline" id="System_Connectivity_Chart"><span class="mw-headline" id="System_Connectivity_Chart"><span class="mw-headline" id="System_Connectivity_Chart"><span class="mw-headline" id="System_Connectivity_Chart"><span class="mw-headline" id="System_Connectivity_Chart"><span class="mw-headline" id="System_Connectivity_Chart"><span class="mw-headline" id="System_Connectivity_Chart">System Connectivity Chart</span></span></span></span></span></span></span></span></span></span></span></span></span></span></span></span></span></span></span></span></span></span></span></span></span></span></span></span></span></span></span></span></span></span></span></span></span></span></span></span></span></span></span></span></span></span></span></span></span></span></span></span></span> == | |
| − | + | ||
| − | #''' | + | |
| + | |||
| + | '''Figure 139: Connectivity Chart''' | ||
| + | |||
| + | '''[[File:MESWeb ConnectivityChart.png|900px|MESWeb ConnectivityChart.png]]''' | ||
| + | |||
| + | | ||
| + | |||
| + | === <span class="mw-headline" id="Drill_Downs_OEE_Configuration_Dashboard"><span class="mw-headline" id="Drill_Downs_OEE_Configuration_Dashboard"><span class="mw-headline" id="Drill_Downs_OEE_Configuration_Dashboard"><span class="mw-headline" id="Drill_Downs_OEE_Configuration_Dashboard"><span class="mw-headline" id="Drill_Downs_OEE_Configuration_Dashboard"><span class="mw-headline" id="Drill_Downs_OEE_Configuration_Dashboard"><span class="mw-headline" id="Drill_Downs_OEE_Configuration_Dashboard"><span class="mw-headline" id="Drill_Downs_OEE_Configuration_Dashboard"><span class="mw-headline" id="Drill_Downs_OEE_Configuration_Dashboard"><span class="mw-headline" id="Drill_Downs_OEE_Configuration_Dashboard"><span class="mw-headline" id="Drill_Downs_OEE_Configuration_Dashboard"><span class="mw-headline" id="Drill_Downs_OEE_Configuration_Dashboard"><span class="mw-headline" id="Drill_Downs_OEE_Configuration_Dashboard"><span class="mw-headline" id="Drill_Downs_OEE_Configuration_Dashboard"><span class="mw-headline" id="Drill_Downs_OEE_Configuration_Dashboard"><span class="mw-headline" id="Drill_Downs_OEE_Configuration_Dashboard"><span class="mw-headline" id="Drill_Downs_OEE_Configuration_Dashboard"><span class="mw-headline" id="Drill_Downs_OEE_Configuration_Dashboard"><span class="mw-headline" id="Drill_Downs_OEE_Configuration_Dashboard"><span class="mw-headline" id="Drill_Downs_OEE_Configuration_Dashboard"><span class="mw-headline" id="Drill_Downs_OEE_Configuration_Dashboard"><span class="mw-headline" id="Drill_Downs_OEE_Configuration_Dashboard"><span class="mw-headline" id="Drill_Downs_OEE_Configuration_Dashboard"><span class="mw-headline" id="Drill_Downs_OEE_Configuration_Dashboard"><span class="mw-headline" id="Drill_Downs_OEE_Configuration_Dashboard"><span class="mw-headline" id="Drill_Downs_OEE_Configuration_Dashboard"><span class="mw-headline" id="Drill_Downs_OEE_Configuration_Dashboard"><span class="mw-headline" id="Drill_Downs_OEE_Configuration_Dashboard"><span class="mw-headline" id="Drill_Downs_OEE_Configuration_Dashboard"><span class="mw-headline" id="Drill_Downs_OEE_Configuration_Dashboard"><span class="mw-headline" id="Drill_Downs_OEE_Configuration_Dashboard"><span class="mw-headline" id="Drill_Downs_OEE_Configuration_Dashboard"><span class="mw-headline" id="Drill_Downs_OEE_Configuration_Dashboard"><span class="mw-headline" id="Drill_Downs_OEE_Configuration_Dashboard"><span class="mw-headline" id="Drill_Downs_OEE_Configuration_Dashboard"><span class="mw-headline" id="Drill_Downs_OEE_Configuration_Dashboard"><span class="mw-headline" id="Drill_Downs_OEE_Configuration_Dashboard"><span class="mw-headline" id="Drill_Downs_OEE_Configuration_Dashboard"><span class="mw-headline" id="Drill_Downs_OEE_Configuration_Dashboard"><span class="mw-headline" id="Drill_Downs_OEE_Configuration_Dashboard"><span class="mw-headline" id="Drill_Downs_OEE_Configuration_Dashboard"><span class="mw-headline" id="Drill_Downs_OEE_Configuration_Dashboard"><span class="mw-headline" id="Drill_Downs_OEE_Configuration_Dashboard"><span class="mw-headline" id="Drill_Downs_OEE_Configuration_Dashboard"><span class="mw-headline" id="Drill_Downs_OEE_Configuration_Dashboard"><span class="mw-headline" id="Drill_Downs_OEE_Configuration_Dashboard"><span class="mw-headline" id="Drill_Downs_OEE_Configuration_Dashboard"><span class="mw-headline" id="Drill_Downs_OEE_Configuration_Dashboard"><span class="mw-headline" id="Drill_Downs_OEE_Configuration_Dashboard"><span class="mw-headline" id="Drill_Downs_OEE_Configuration_Dashboard"><span class="mw-headline" id="Drill_Downs_OEE_Configuration_Dashboard"><span class="mw-headline" id="Drill_Downs_OEE_Configuration_Dashboard"><span class="mw-headline" id="Drill_Downs_OEE_Configuration_Dashboard"><span class="mw-headline" id="Drill_Downs_OEE_Configuration_Dashboard"><span class="mw-headline" id="Drill_Downs_OEE_Configuration_Dashboard"><span class="mw-headline" id="Drill_Downs_OEE_Configuration_Dashboard">Drill Downs OEE Configuration Dashboard </span></span></span></span></span></span></span></span></span></span></span></span></span></span></span></span></span></span></span></span></span></span></span></span></span></span></span></span></span></span></span></span></span></span></span></span></span></span></span></span></span></span></span></span></span></span></span></span></span></span></span></span></span></span></span></span> === | ||
| + | |||
| + | To see the corresponding Downtime Problem Analysis and Root Cause Analysis Charts: | ||
| + | |||
| + | #Select the OEE Configuration value in the center of the gauge. | ||
| + | #The Charts will display: | ||
| + | |||
| + | '''Figure 140: Drill down for OEE Configuration Reports''' | ||
| + | |||
| + | [[File:MESWeb DrilldownforOEEConfigurationReports.png|900px|MESWeb DrilldownforOEEConfigurationReports.png]] | ||
| | ||
| + | <ol start="3"> | ||
| + | <li>'''Double-click '''on the section of the pie to select reports specific to that problem and to view corresponding Work Orders.</li> | ||
| + | </ol> | ||
| − | ''' | + | *'''Downtime Trend and Frequency Report''' |
| + | *'''Work Order Report by Problem''' | ||
| + | <ol start="4"> | ||
| + | <li>'''Select''' the desired report. '''See Drill Downs: Root Cause Analysis Reports''' to see how the reports and prompts appear in the system.</li> | ||
| + | </ol> | ||
| − | ''' | + | <u>'''Note:'''</u> Please make sure to first configure the location, department, and production line, before viewing the reports. |
| | ||
| − | + | == <span class="mw-headline" id="Products_Without_Throughput_Per_Hour_Targets"><span class="mw-headline" id="Products_Without_Throughput_Per_Hour_Targets"><span class="mw-headline" id="Products_Without_Throughput_Per_Hour_Targets">Products Without Throughput Per Hour Targets</span></span></span> == | |
| + | |||
| + | The Products Without Throughput Per Hour Targets Report can show the products list with the Asset Name, Part Number, Family ID, WorkStation, Process Name and Mfg Line. | ||
| + | |||
| + | Step 1 | ||
| + | |||
| + | *Select a data source. | ||
| + | |||
| + | Step 2 | ||
| + | |||
| + | *(Optional) Select one or more customers. | ||
| + | |||
| + | Step 3 | ||
| + | |||
| + | *(Optional) Select one or more products. | ||
| + | *(Optional) Select one or more families. | ||
| + | |||
| + | Step 4 | ||
| + | |||
| + | *(Optional) Select one or more locations. | ||
| + | *(Optional) Select one or more processes. | ||
| + | *(Optional) Select one or more Mfg Lines | ||
| + | *Show only mapped locations | ||
| + | *Select date range | ||
| + | *Indicate if you would like to export just the file. | ||
| + | *Select whether or not parameters should be hidden when the report is executed. | ||
| + | *(Optional) Select the interval to refresh the report as needed. | ||
| + | |||
| + | Select '''Go''' | ||
| + | |||
| + | '''Figure 141: Products Without Throughput Per Hour Targets Report ''' | ||
| + | |||
| + | [[File:Products Without Throughput Per Hour Targets Report.png|border|800px|Products Without Throughput Per Hour Targets Report.png]] | ||
| | ||
| − | + | == <span class="mw-headline" id="Report_OEE_by_Product_or_Product_Family"><span class="mw-headline" id="Report_OEE_by_Product_or_Product_Family"><span class="mw-headline" id="Report_OEE_by_Product_or_Product_Family">Report OEE by Product or Product Family </span></span></span> == | |
| − | * | + | |
| − | * | + | The Report OEE by Product or Product Family provides information concerning the view of Asset IDs, Asset names, Line Names, Product and Product Family, OEE, and more. |
| − | * | + | |
| + | #Select Data Source in section Step 1. | ||
| + | #Select Site. | ||
| + | #Select Parameters, for the given outcome: | ||
| + | |||
| + | *Line Name | ||
| + | *Asset ID | ||
| + | *Product | ||
| + | *Product Family | ||
| + | *Date Range | ||
| + | *Click “Go”. | ||
| + | |||
| + | <br/> '''Figure 142: Report OEE by Product or Product Family''' | ||
| + | |||
| + | [[File:MW-Report OEE by Product Family.png|border|800px|MW-Report OEE by Product Family.png]] | ||
| | ||
| − | + | == <span class="mw-headline" id="Report_OEE_by_Shop_Order"><span class="mw-headline" id="Report_OEE_by_Shop_Order"><span class="mw-headline" id="Report_OEE_by_Shop_Order">Report OEE by Shop Order</span></span></span> == | |
| + | |||
| + | Users have the ability to view the details of the report of OEE by Shop Order and the surrounding information for specific Asset ID’s. | ||
| + | |||
| + | #Select Data Source in section Step 1. | ||
| + | #Select Site. | ||
| + | #Select Parameters, for the given outcome : | ||
| + | |||
| + | *Line Name | ||
| + | *Asset ID | ||
| + | *Shop Order | ||
| + | *Date Range | ||
| + | <ol start="4"> | ||
| + | <li>Click “Go”.</li> | ||
| + | </ol> | ||
| − | '''[[File: | + | '''Figure 143: Report OEE by Shop Order''' |
| + | |||
| + | [[File:Report OEE by SO.png|border|800px|Report OEE by SO.png]] | ||
| | ||
| − | + | ||
| + | |||
| + | = <span class="mw-headline" id="PTSR_Reports"><span class="mw-headline" id="PTSR_Reports"><span class="mw-headline" id="PTSR_Reports"><span class="mw-headline" id="PTSR_Reports"><span class="mw-headline" id="PTSR_Reports"><span class="mw-headline" id="PTSR_Reports"><span class="mw-headline" id="PTSR_Reports"><span class="mw-headline" id="PTSR_Reports"><span class="mw-headline" id="PTSR_Reports"><span class="mw-headline" id="PTSR_Reports"><span class="mw-headline" id="PTSR_Reports"><span class="mw-headline" id="PTSR_Reports"><span class="mw-headline" id="PTSR_Reports"><span class="mw-headline" id="PTSR_Reports"><span class="mw-headline" id="PTSR_Reports"><span class="mw-headline" id="PTSR_Reports"><span class="mw-headline" id="PTSR_Reports"><span class="mw-headline" id="PTSR_Reports"><span class="mw-headline" id="PTSR_Reports"><span class="mw-headline" id="PTSR_Reports"><span class="mw-headline" id="PTSR_Reports"><span class="mw-headline" id="PTSR_Reports">PTSR Reports</span></span></span></span></span></span></span></span></span></span></span></span></span></span></span></span></span></span></span></span></span></span> = | ||
| + | |||
| + | The PTSR Reports provide users with a list of reports for the part traceability system. | ||
| + | |||
| + | To access this report navigate to '''Reporting''' > '''MESWeb''' > '''PTSR''' '''Reports'''. | ||
| | ||
| − | + | == Board in Production == | |
| − | ''' | + | '''The Board in Production report can be used to display information about materials from scanned boards that are in production in a select line.To view the report: ''' |
| + | | ||
| + | # | ||
| + | Navigate to '''Reporting > MESWeb > PTSR Report > Board in Production ''' | ||
| + | |||
| + | # | ||
| + | Select a'''Data Source '''from the drop down list | ||
| + | |||
| + | # | ||
| + | Select a''''''Production line''' from the Production Line drop-down box. Alternatively, users may search by entering the barcode into the '''Search Barcode''' field. | ||
| + | |||
| + | # | ||
| + | Enter a date range by which to filter the search results, and select'''Go''' to generate the report.The report results are displayed. | ||
| + | |||
| + | |||
| + | <br/> '''<u>Note</u>: ''' If required, define the Start Date and the Stop Date for limited protection history boards. | ||
| | ||
| − | + | '''Figure 144: Board in Production ''' | |
| + | |||
| + | '''[[File:MESWWEBR BoardinProduction.png|900px]]''' | ||
| | ||
| − | + | == Board History Report == | |
| + | |||
| + | |||
| + | <span class="mw-headline" id=""> </span>The Board History report can be used to view information regarding all the workstations that are associated with a given board barcode. To view the report: | ||
| − | '''[[File: | + | #To view the report, navigate to the Board History Report main page: '''Reporting > MESWeb > PTSR Report > Board History Report''' |
| + | #Select a '''Data Source '''from the dropdown list | ||
| + | #Enter a'''board barcode '''into the Input Board Barcode field. | ||
| + | #Select'''Go '''to generate the report.The required information is displayed. | ||
| + | |||
| + | '''Figure 145: Board History Report''' | ||
| + | |||
| + | '''[[File:MESWWEBR BoardHistoryReport.png|900px|MESWWEBR BoardHistoryReport.png]]''' | ||
| | ||
| − | + | == Break Panel Query == | |
| + | |||
| + | The Break Panel Query report can be used to view when a material or a component is consumed. | ||
| + | |||
| + | To view the report, | ||
| + | |||
| + | #Navigate to'''Reporting > MESWeb > PTSR Report > Break Panel Query''' | ||
| + | #Select the''' Data Source. '''The Panel Barcode, Work Order, Break Date Start, and Break Date End are optional in order to generate the results | ||
| + | #Select the'''Go '''button. The results are displayed. | ||
| + | |||
| + | '''Figure 146: Break Panel Query''' | ||
| + | |||
| + | [[File:MESWWEBR BreakPanelQuery.png|900px|MESWWEBR BreakPanelQuery.png]] | ||
| | ||
| − | + | == Replace Barcode Report == | |
| − | '''[[File: | + | The''' '''Replace Barcode report can be used to view the replacement history of barcodes, including replacing time, original barcode, new barcode, workstation, production line, and the position of the person who replaced the barcode. |
| + | |||
| + | # | ||
| + | To view the report, navigate to the Replace Barcode Report in the MES Portal:'''Reporting > MESWeb > PTSR Report > Replace Barcode Report''' | ||
| + | |||
| + | #Select an option for searching results using the Search by the drop-down box. Options include Original Barcode and New Barcode. | ||
| + | #Enter the corresponding barcode information into the field adjacent to the Search by the drop-down box. Enter the Start Date and the Stop Date to further filter the search results. | ||
| + | #Select the Search icon. The search results are displayed. | ||
| + | #View the Barcode History report for a given result, select on the name of the new barcode (in blue) for the respective result. | ||
| + | |||
| + | '''Figure 147: Replace Barcode Report''' | ||
| + | |||
| + | [[File:MESWWEBR ReplaceBarcodeReport.png|900px|MESWWEBR ReplaceBarcodeReport.png]] | ||
| | ||
| − | + | == <span class="mw-headline" id="Barcode_Information"><span class="mw-headline" id="Barcode_Information"><span class="mw-headline" id="Barcode_Information"><span class="mw-headline" id="Barcode_Information"><span class="mw-headline" id="Barcode_Information"><span class="mw-headline" id="Barcode_Information"><span class="mw-headline" id="Barcode_Information"><span class="mw-headline" id="Barcode_Information"><span class="mw-headline" id="Barcode_Information"><span class="mw-headline" id="Barcode_Information"><span class="mw-headline" id="Barcode_Information"><span class="mw-headline" id="Barcode_Information"><span class="mw-headline" id="Barcode_Information"><span class="mw-headline" id="Barcode_Information"><span class="mw-headline" id="Barcode_Information"><span class="mw-headline" id="Barcode_Information"><span class="mw-headline" id="Barcode_Information"><span class="mw-headline" id="Barcode_Information"><span class="mw-headline" id="Barcode_Information"><span class="mw-headline" id="Barcode_Information"><span class="mw-headline" id="Barcode_Information"><span class="mw-headline" id="Barcode_Information"><span class="mw-headline" id="Barcode_Information">Barcode Information</span></span></span></span></span></span></span></span></span></span></span></span></span></span></span></span></span></span></span></span></span></span></span> == | |
| − | + | The Barcode Information Report can show the barcode in detail with the Barcode, Part number, date code, create date, total qty, current qty, incoming number, manufacturer name, MSD lever, Orientation, thickness, and other associated information. Chart Type: Data displays in Pareto Charts. | |
| + | |||
| + | #Select '''Data Source''' in Step 1. | ||
| + | #Select '''Next'''. | ||
| + | #Enter '''Date Code''' in Step 2. | ||
| + | #Select '''Next'''. | ||
| + | #Select Parameters in Step 3. | ||
| | ||
| − | ''' | + | *'''Component Barcode''' (Optional) |
| + | *'''Incoming Number''' (Optional) | ||
| + | *'''Part Number''' (Optional) | ||
| + | *Indicate if users would like to export just the file. | ||
| + | *Select whether or not parameters should be hidden when the report is executed. | ||
| + | *Select the interval to refresh the report as needed (Optional) . | ||
| − | '''[[File: | + | '''Figure 148: Barcode Information Report''' |
| + | |||
| + | '''[[File:Barcode Information.png|border|900px|MW-LocActivityReport.png]]''' | ||
| | ||
| − | + | == <span class="mw-headline" id="Boards_In_Model"><span class="mw-headline" id="Boards_In_Model"><span class="mw-headline" id="Boards_In_Model"><span class="mw-headline" id="Boards_In_Model"><span class="mw-headline" id="Boards_In_Model"><span class="mw-headline" id="Boards_In_Model"><span class="mw-headline" id="Boards_In_Model"><span class="mw-headline" id="Boards_In_Model"><span class="mw-headline" id="Boards_In_Model"><span class="mw-headline" id="Boards_In_Model"><span class="mw-headline" id="Boards_In_Model">Boards In Model</span></span></span></span></span></span></span></span></span></span></span> == | |
| − | |||
| − | + | The Board in Model report can be used to display information about serials that have been scanned with a selected '''BOM P/N''', Boards S/N barcode, first scan time, and last scan time. The date range to display scan time should be maximum of 90 days. If the date range selected exceeds 90 days, the user receives an error prompt. | |
| − | + | ||
| − | + | '''Chart Type: '''Data displays in Pareto Charts. | |
| − | |||
| − | |||
| − | |||
| − | + | #Select '''Data Source''' in Step 1. | |
| + | #Select '''Next'''. | ||
| + | #Select Parameters in Step 2. | ||
| − | + | *'''BOM P/N''' | |
| + | *'''Scan Time '''(Maximum 90 days) | ||
| + | *Indicate if users would like to export just the file. | ||
| + | *Select whether or not parameters should be hidden when the report is executed. | ||
| + | *Select the interval to refresh the report as needed (Optional). | ||
| − | + | | |
| − | + | '''Figure 149: Boards In Model'''<br/> [[File:Boards in Model.png|900px|Boards in Model.png]] | |
| − | + | | |
| + | |||
| + | == <span class="mw-headline" id="Boards_In_Work_Order"><span class="mw-headline" id="Boards_In_Work_Order"><span class="mw-headline" id="Boards_In_Work_Order"><span class="mw-headline" id="Boards_In_Work_Order"><span class="mw-headline" id="Boards_In_Work_Order"><span class="mw-headline" id="Boards_In_Work_Order"><span class="mw-headline" id="Boards_In_Work_Order"><span class="mw-headline" id="Boards_In_Work_Order"><span class="mw-headline" id="Boards_In_Work_Order"><span class="mw-headline" id="Boards_In_Work_Order"><span class="mw-headline" id="Boards_In_Work_Order"><span class="mw-headline" id="Boards_In_Work_Order"><span class="mw-headline" id="Boards_In_Work_Order"><span class="mw-headline" id="Boards_In_Work_Order"><span class="mw-headline" id="Boards_In_Work_Order"><span class="mw-headline" id="Boards_In_Work_Order"><span class="mw-headline" id="Boards_In_Work_Order"><span class="mw-headline" id="Boards_In_Work_Order"><span class="mw-headline" id="Boards_In_Work_Order"><span class="mw-headline" id="Boards_In_Work_Order"><span class="mw-headline" id="Boards_In_Work_Order"><span class="mw-headline" id="Boards_In_Work_Order"><span class="mw-headline" id="Boards_In_Work_Order">Boards In Work Order</span></span></span></span></span></span></span></span></span></span></span></span></span></span></span></span></span></span></span></span></span></span></span> == | ||
| + | |||
| + | The Boards In Work Order Report can show the boards information for one Work Order with the WO Number, Board barcode, First scan time, Last scan time. Chart Type: Data displays in Pareto Charts. | ||
| − | ''' | + | #Select '''Data Source '''in Step 1. |
| + | #Select '''Next'''. | ||
| + | #Select Parameters in Step 2. | ||
| − | ''' | + | *'''Work Order''' |
| + | *'''Scan Time''' (Optional) | ||
| + | *Indicate if users would like to export just the file. | ||
| + | *Select whether or not parameters should be hidden when the report is executed. | ||
| + | *Select the interval to refresh the report as needed (Optional) . | ||
| | ||
| − | + | '''Figure 150: Board In Work Order''' | |
| − | + | '''[[File:Board In WO.png|border|900px|MW-LocActivityReport.png]]''' | |
| | ||
| − | ''' | + | == <span class="mw-headline" id="Fujitrax_-_Operator_Trace_Log"><span class="mw-headline" id="Fujitrax_-_Operator_Trace_Log"><span class="mw-headline" id="Fujitrax_-_Operator_Trace_Log"><span class="mw-headline" id="Fujitrax_-_Operator_Trace_Log"><span class="mw-headline" id="Fujitrax_-_Operator_Trace_Log"><span class="mw-headline" id="Fujitrax_-_Operator_Trace_Log"><span class="mw-headline" id="Fujitrax_-_Operator_Trace_Log"><span class="mw-headline" id="Fujitrax_-_Operator_Trace_Log"><span class="mw-headline" id="Fujitrax_-_Operator_Trace_Log"><span class="mw-headline" id="Fujitrax_-_Operator_Trace_Log"><span class="mw-headline" id="Fujitrax_-_Operator_Trace_Log"><span class="mw-headline" id="Fujitrax_-_Operator_Trace_Log"><span class="mw-headline" id="Fujitrax_-_Operator_Trace_Log"><span class="mw-headline" id="Fujitrax_-_Operator_Trace_Log"><span class="mw-headline" id="Fujitrax_-_Operator_Trace_Log"><span class="mw-headline" id="Fujitrax_-_Operator_Trace_Log"><span class="mw-headline" id="Fujitrax_-_Operator_Trace_Log"><span class="mw-headline" id="Fujitrax_-_Operator_Trace_Log"><span class="mw-headline" id="Fujitrax_-_Operator_Trace_Log"><span class="mw-headline" id="Fujitrax_-_Operator_Trace_Log"><span class="mw-headline" id="Fujitrax_-_Operator_Trace_Log"><span class="mw-headline" id="Fujitrax_-_Operator_Trace_Log"><span class="mw-headline" id="Fujitrax_-_Operator_Trace_Log">Fujitrax - Operator Trace Log</span></span></span></span></span></span></span></span></span></span></span></span></span></span></span></span></span></span></span></span></span></span></span> == |
| + | |||
| + | The Fujitrax Operator Trace Log can show the logs of the Fujitrax operation with the Time, System, Operator, Operator action, Result, and other associated information. Chart Type: Data displays in Pareto Charts. | ||
| + | |||
| + | #Select '''Data Source''' in Step 1. | ||
| + | #Select '''Next'''. | ||
| + | #Select Parameters in Step 2. | ||
| + | |||
| + | *'''Log Time period''' (Optional) | ||
| + | *'''Component Barcode''' (Optional) | ||
| + | *'''Previous Component Barcode''' (Optional) | ||
| + | *'''Date Code''' (Optional) | ||
| + | *'''Machine''' (Optional) | ||
| + | *'''Part Number''' (Optional) | ||
| + | *Indicate if users would like to export just the file. | ||
| + | *Select whether or not parameters should be hidden when the report is executed. | ||
| + | *Select the interval to refresh the report as needed (Optional). | ||
| − | '''[[File: | + | '''Figure 151: Fujitrax - Operator Trace Log''' |
| + | |||
| + | '''[[File:Fujitrax operator log.png|border|900px|MW-LocActivityReport.png]]''' | ||
| | ||
| − | + | == <span class="mw-headline" id="Load_Material_Initial_Quantity_Report"><span class="mw-headline" id="Load_Material_Initial_Quantity_Report"><span class="mw-headline" id="Load_Material_Initial_Quantity_Report"><span class="mw-headline" id="Load_Material_Initial_Quantity_Report"><span class="mw-headline" id="Load_Material_Initial_Quantity_Report"><span class="mw-headline" id="Load_Material_Initial_Quantity_Report"><span class="mw-headline" id="Load_Material_Initial_Quantity_Report"><span class="mw-headline" id="Load_Material_Initial_Quantity_Report"><span class="mw-headline" id="Load_Material_Initial_Quantity_Report"><span class="mw-headline" id="Load_Material_Initial_Quantity_Report"><span class="mw-headline" id="Load_Material_Initial_Quantity_Report"><span class="mw-headline" id="Load_Material_Initial_Quantity_Report"><span class="mw-headline" id="Load_Material_Initial_Quantity_Report"><span class="mw-headline" id="Load_Material_Initial_Quantity_Report"><span class="mw-headline" id="Load_Material_Initial_Quantity_Report"><span class="mw-headline" id="Load_Material_Initial_Quantity_Report"><span class="mw-headline" id="Load_Material_Initial_Quantity_Report"><span class="mw-headline" id="Load_Material_Initial_Quantity_Report"><span class="mw-headline" id="Load_Material_Initial_Quantity_Report"><span class="mw-headline" id="Load_Material_Initial_Quantity_Report"><span class="mw-headline" id="Load_Material_Initial_Quantity_Report"><span class="mw-headline" id="Load_Material_Initial_Quantity_Report"><span class="mw-headline" id="Load_Material_Initial_Quantity_Report">Load Material Initial Quantity Report</span></span></span></span></span></span></span></span></span></span></span></span></span></span></span></span></span></span></span></span></span></span></span> == | |
| − | + | The Load Material Initial Quantity Report can show the initial quantity of the material when it was loaded to the workstation. | |
| + | |||
| + | Chart Type: Data displays in Pareto Charts. | ||
| + | |||
| + | #Select '''Data Source''' in Step 1. | ||
| + | #Select '''Next'''. | ||
| + | #Select Parameters in Step 2. | ||
| + | |||
| + | *'''Barcode''' | ||
| + | *Indicate if users would like to export just the file. | ||
| + | *Select whether or not parameters should be hidden when the report is executed. | ||
| + | *Select the interval to refresh the report as needed (Optional). | ||
| | ||
| − | + | '''Figure 152: Load Material Initial Quantity Report''' | |
| − | '''[[File: | + | '''[[File:Load Material initial qty.png|border|900px|MW-LocActivityReport.png]]''' |
| | ||
| − | + | == <span class="mw-headline" id="Material_on_Board"><span class="mw-headline" id="Material_on_Board"><span class="mw-headline" id="Material_on_Board"><span class="mw-headline" id="Material_on_Board"><span class="mw-headline" id="Material_on_Board"><span class="mw-headline" id="Material_on_Board"><span class="mw-headline" id="Material_on_Board"><span class="mw-headline" id="Material_on_Board"><span class="mw-headline" id="Material_on_Board"><span class="mw-headline" id="Material_on_Board"><span class="mw-headline" id="Material_on_Board"><span class="mw-headline" id="Material_on_Board"><span class="mw-headline" id="Material_on_Board"><span class="mw-headline" id="Material_on_Board"><span class="mw-headline" id="Material_on_Board"><span class="mw-headline" id="Material_on_Board"><span class="mw-headline" id="Material_on_Board"><span class="mw-headline" id="Material_on_Board"><span class="mw-headline" id="Material_on_Board"><span class="mw-headline" id="Material_on_Board"><span class="mw-headline" id="Material_on_Board"><span class="mw-headline" id="Material_on_Board"><span class="mw-headline" id="Material_on_Board">Material on Board</span></span></span></span></span></span></span></span></span></span></span></span></span></span></span></span></span></span></span></span></span></span></span> == | |
| − | * | + | The Material on Board can show all the materials information that was loaded to the board. |
| + | |||
| + | Chart Type: Data displays in Pareto Charts. | ||
| + | |||
| + | #Select '''Data Source''' in Step 1. | ||
| + | #Select '''Next'''. | ||
| + | #Select Parameters in Step 2. | ||
| + | |||
| + | *'''Source''' (Optional). | ||
| + | *'''Board barcode'''. | ||
| + | *Indicate if users would like to export just the file. | ||
| + | *Select whether or not the parameters should be hidden when the report is executed. | ||
| + | *Select the interval to refresh the report as needed (Optional). | ||
| | ||
| − | + | '''Figure 153: Material on Board''' | |
| − | '''[[File: | + | '''[[File:Material on board.png|border|900px|MW-LocActivityReport.png]]''' |
| | ||
| − | = <span class="mw-headline" id=" | + | == <span class="mw-headline" id="Material_on_Board_by_Batch"><span class="mw-headline" id="Material_on_Board_by_Batch"><span class="mw-headline" id="Material_on_Board_by_Batch"><span class="mw-headline" id="Material_on_Board_by_Batch"><span class="mw-headline" id="Material_on_Board_by_Batch"><span class="mw-headline" id="Material_on_Board_by_Batch"><span class="mw-headline" id="Material_on_Board_by_Batch"><span class="mw-headline" id="Material_on_Board_by_Batch"><span class="mw-headline" id="Material_on_Board_by_Batch"><span class="mw-headline" id="Material_on_Board_by_Batch"><span class="mw-headline" id="Material_on_Board_by_Batch"><span class="mw-headline" id="Material_on_Board_by_Batch"><span class="mw-headline" id="Material_on_Board_by_Batch"><span class="mw-headline" id="Material_on_Board_by_Batch"><span class="mw-headline" id="Material_on_Board_by_Batch"><span class="mw-headline" id="Material_on_Board_by_Batch"><span class="mw-headline" id="Material_on_Board_by_Batch"><span class="mw-headline" id="Material_on_Board_by_Batch"><span class="mw-headline" id="Material_on_Board_by_Batch"><span class="mw-headline" id="Material_on_Board_by_Batch"><span class="mw-headline" id="Material_on_Board_by_Batch"><span class="mw-headline" id="Material_on_Board_by_Batch"><span class="mw-headline" id="Material_on_Board_by_Batch">Material on Board by Batch</span></span></span></span></span></span></span></span></span></span></span></span></span></span></span></span></span></span></span></span></span></span></span> == |
| + | |||
| + | The Material on Board by Batch can show all the materials information that was loaded to the boards, users can input more than one board barcode. | ||
| + | |||
| + | Chart Type: Data displays in Pareto Charts. | ||
| + | |||
| + | #Select'''Data Source''' in Step 1. | ||
| + | #Select '''Next'''. | ||
| + | #Select Parameters in Step 2. | ||
| + | |||
| + | *'''Source''' (Optional). | ||
| + | *'''Board Serial No.''' | ||
| + | *Indicate if users would like to export just the file. | ||
| + | *Select whether or not the parameters should be hidden when the report is executed. | ||
| + | *Select the interval to refresh the report as needed (Optional) . | ||
| + | |||
| + | | ||
| − | + | '''Figure 154: Material on Board by Batch''' | |
| − | + | '''[[File:Material on board by batch.png|border|900px|MW-LocActivityReport.png]]''' | |
| | ||
| − | '''Figure | + | == <span class="mw-headline" id="Material_Report"><span class="mw-headline" id="Material_Report"><span class="mw-headline" id="Material_Report"><span class="mw-headline" id="Material_Report"><span class="mw-headline" id="Material_Report"><span class="mw-headline" id="Material_Report"><span class="mw-headline" id="Material_Report"><span class="mw-headline" id="Material_Report"><span class="mw-headline" id="Material_Report"><span class="mw-headline" id="Material_Report"><span class="mw-headline" id="Material_Report"><span class="mw-headline" id="Material_Report"><span class="mw-headline" id="Material_Report"><span class="mw-headline" id="Material_Report"><span class="mw-headline" id="Material_Report"><span class="mw-headline" id="Material_Report"><span class="mw-headline" id="Material_Report"><span class="mw-headline" id="Material_Report"><span class="mw-headline" id="Material_Report"><span class="mw-headline" id="Material_Report"><span class="mw-headline" id="Material_Report"><span class="mw-headline" id="Material_Report"><span class="mw-headline" id="Material_Report">Material Report</span></span></span></span></span></span></span></span></span></span></span></span></span></span></span></span></span></span></span></span></span></span></span> == |
| + | |||
| + | The Material Report can show the material information in detail with Create date, barcode, RT No., MSD level, Manufacturer, current quantity, Date code, expiration date, when used. | ||
| + | |||
| + | Chart Type: Data displays in Pareto Charts. | ||
| + | |||
| + | #Select '''Data Source''' in Step 1. | ||
| + | #Select '''Next'''. | ||
| + | #Select Parameters in Step 2. | ||
| + | |||
| + | *'''Material barcode'''(Optional) . | ||
| + | *'''Material Part Number'''(Optional) . | ||
| + | *'''Lot Code'''(Optional) . | ||
| + | *'''Date Code'''(Optional) . | ||
| + | *'''Incoming Number'''(Optional) . | ||
| + | *'''Manufacturer Part Number'''(Optional) . | ||
| + | *'''Manufacturer Name'''(Optional) . | ||
| + | *C'''reated Date'''(Optional) | ||
| + | *'''Expire Date'''(Optional) . | ||
| + | *Indicate if users would like to export just the file. | ||
| + | *Select whether or not the parameters should be hidden when the report is executed. | ||
| + | *Select the interval to refresh the report as needed (Optional). | ||
| + | |||
| + | '''Figure 155: Material Report''' | ||
| + | |||
| + | '''[[File:Material report.png|border|900px|MW-LocActivityReport.png]]''' | ||
| − | + | | |
| | ||
| − | + | == <span class="mw-headline" id="Material_Where_Used"><span class="mw-headline" id="Material_Where_Used"><span class="mw-headline" id="Material_Where_Used"><span class="mw-headline" id="Material_Where_Used"><span class="mw-headline" id="Material_Where_Used"><span class="mw-headline" id="Material_Where_Used"><span class="mw-headline" id="Material_Where_Used"><span class="mw-headline" id="Material_Where_Used"><span class="mw-headline" id="Material_Where_Used"><span class="mw-headline" id="Material_Where_Used"><span class="mw-headline" id="Material_Where_Used"><span class="mw-headline" id="Material_Where_Used"><span class="mw-headline" id="Material_Where_Used"><span class="mw-headline" id="Material_Where_Used"><span class="mw-headline" id="Material_Where_Used"><span class="mw-headline" id="Material_Where_Used"><span class="mw-headline" id="Material_Where_Used"><span class="mw-headline" id="Material_Where_Used"><span class="mw-headline" id="Material_Where_Used"><span class="mw-headline" id="Material_Where_Used"><span class="mw-headline" id="Material_Where_Used"><span class="mw-headline" id="Material_Where_Used"><span class="mw-headline" id="Material_Where_Used">Material Where Used</span></span></span></span></span></span></span></span></span></span></span></span></span></span></span></span></span></span></span></span></span></span></span> == | |
| − | |||
| − | |||
| − | |||
| − | ''' | + | The Material Where Used Report can show the scanned board number, production line, and other information where the material used. |
| + | |||
| + | Chart Type: Data displays in Pareto Charts. | ||
| + | |||
| + | #Select '''Data Source '''in Step 1. | ||
| + | #Select '''Next'''. | ||
| + | #Select Parameters in Step 2. | ||
| + | |||
| + | *'''Component barcode'''. | ||
| + | *'''Date Range''' | ||
| + | *Indicate if users would like to export just the file. | ||
| + | *Select whether or not the parameters should be hidden when the report is executed. | ||
| + | *Select the interval to refresh the report as needed (Optional). | ||
| | ||
| − | '''Figure | + | '''Figure 156: Material Where Used''' |
| − | [[File: | + | '''[[File:Material where used.png|border|900px|MW-LocActivityReport.png]]''' |
| | ||
| − | + | | |
| − | + | | |
| − | + | == <span class="mw-headline" id="Receipt_Traveler_Report"><span class="mw-headline" id="Receipt_Traveler_Report"><span class="mw-headline" id="Receipt_Traveler_Report"><span class="mw-headline" id="Receipt_Traveler_Report"><span class="mw-headline" id="Receipt_Traveler_Report"><span class="mw-headline" id="Receipt_Traveler_Report"><span class="mw-headline" id="Receipt_Traveler_Report"><span class="mw-headline" id="Receipt_Traveler_Report"><span class="mw-headline" id="Receipt_Traveler_Report"><span class="mw-headline" id="Receipt_Traveler_Report"><span class="mw-headline" id="Receipt_Traveler_Report"><span class="mw-headline" id="Receipt_Traveler_Report"><span class="mw-headline" id="Receipt_Traveler_Report"><span class="mw-headline" id="Receipt_Traveler_Report"><span class="mw-headline" id="Receipt_Traveler_Report"><span class="mw-headline" id="Receipt_Traveler_Report"><span class="mw-headline" id="Receipt_Traveler_Report"><span class="mw-headline" id="Receipt_Traveler_Report"><span class="mw-headline" id="Receipt_Traveler_Report"><span class="mw-headline" id="Receipt_Traveler_Report"><span class="mw-headline" id="Receipt_Traveler_Report"><span class="mw-headline" id="Receipt_Traveler_Report"><span class="mw-headline" id="Receipt_Traveler_Report"><span class="mw-headline" id="Receipt_Traveler_Report">Receipt Traveler Report</span></span></span></span></span></span></span></span></span></span></span></span></span></span></span></span></span></span></span></span></span></span></span></span> == | |
| + | |||
| + | The Receipt Traveler Report can show the receipt traveler information in detail with the receiving date, receiving number, Lot code, Date code, Part number, Quantity, company name, and Manufacturer. | ||
| + | |||
| + | Chart Type: Data displays in Pareto Charts. | ||
| + | |||
| + | #Select '''Data Source''' in Step 1. | ||
| + | #Select '''Next'''. | ||
| + | #Select Parameters in Step 2. | ||
| + | |||
| + | *'''Incoming Number'''(Optional). | ||
| + | *'''Created Date''' | ||
| + | *Indicate if users would like to export just the file. | ||
| + | *Select whether or not the parameters should be hidden when the report is executed. | ||
| + | *Select the interval to refresh the report as needed (Optional). | ||
| | ||
| − | '''Figure | + | '''Figure 157: Receipt Traveler Report''' |
| − | '''[[File: | + | '''[[File:RT Report.png|border|900px|MW-LocActivityReport.png]]''' |
| | ||
| − | + | | |
| − | |||
| − | |||
| − | |||
| − | |||
| − | |||
| − | |||
| | ||
| − | |||
| − | + | = <span class="mw-headline" id="SOMS_Reports"><span class="mw-headline" id="SOMS_Reports"><span class="mw-headline" id="SOMS_Reports"><span class="mw-headline" id="SOMS_Reports"><span class="mw-headline" id="SOMS_Reports"><span class="mw-headline" id="SOMS_Reports">SOMS Reports</span></span></span></span></span></span> = | |
| + | |||
| + | The SOMS Global Status Report is designed to start with a high-level overview of a plant's current operating status. The user can see the current number of units that are in the WIP, the yield for the current and previous days, and the throughput for the current and previous days for each of the plant's levels. Users also have the ability to drill down into a single level to see the same information broken out by line and process. The report is designed to give a quick snapshot of the health of a plant operation. | ||
| + | |||
| + | Follow the steps below to generate a SOMS Report: | ||
| + | |||
| + | 1. Select a Data Source | ||
| + | |||
| + | 2. (Optional) Enter the Mfg Line Name | ||
| + | |||
| + | 3. (Optional) Enter the Scanner ID | ||
| + | |||
| + | 4. (Optional) Enter the Multi-Pass Location Name | ||
| + | |||
| + | 5. Select whether or not parameters should be hidden when the report is executed | ||
| + | |||
| + | 6. (Optional) Select the interval to refresh the report as needed | ||
| | ||
| + | '''Figure 158: SOMS Setup''' | ||
| + | ''''''[[File:MW-Report OEE by Product Family.png|900px|RTENOTITLE]]'''''' | ||
| + | | ||
| + | | ||
| + | |||
| + | | ||
| − | = <span class="mw-headline" id=" | + | = <span class="mw-headline" id="Glossary"><span class="mw-headline" id="Glossary"><span class="mw-headline" id="Glossary"><span class="mw-headline" id="Glossary">Glossary</span></span></span></span> = |
| − | + | *'''Availability: '''An OEE Configuration variable that depicts an asset’s uptime/downtime. Any stoppage (breaks, lunches, waiting for parts, malfunction, setup, emergencies) is part of this calculation; plants must account for all stoppages, even if they are planned. | |
| − | + | *'''Level: '''The building, floor, or plant on which the dashboard is displayed. | |
| − | + | *'''Layers: '''The data that is displayed on the 42Q Live Monocle Dashboard. 42Q offers 3 layers: | |
| − | + | ||
| − | + | #The Machine layer displays cycle time status (green - asset is performing at expected levels; yellow - asset is performing below optimal levels and requires attention; red - asset is performing severely below level, and may be stopped.) Machine status is determined by comparing scanning activity (throughput and cycle time) during a set period of time to target yield values predefined in target maintenance. | |
| − | + | #'''T'''P/Yield layer (also referred to throughout this document as the MES 101 layer) shows throughput and yield values for the selected level, and the current status of each production line (ok, acknowledged, on hold, critical, and idle). | |
| − | + | ||
| − | + | '''<u>Note:</u> '''The MES 101 and Machine target values are defined in the Target Maintenance portal, using the soms_target table. | |
| − | + | <ol start="3"> | |
| − | + | <li>The OEE Configuration layer shows OEE Configuration statistics for the specific asset; OEE Configuration layers are color-coded according to predefined target ranges (red = levels are below defined OEE Configuration target values; yellow = approaching cautionary values; green = within acceptable OEE Configuration values). </li> | |
| − | + | </ol> | |
| − | + | ||
| − | + | '''<u>Note:</u> '''OEE Configuration target values are defined in the Target Maintenance portal, using the OEE Configuration_target_ table. | |
| − | + | ||
| − | + | *'''MTBF:''' Mean time between failures (MTBF) is the predicted elapsed time between inherent failures of a system during operation. | |
| − | + | *'''MTTR:''' Mean time to failure (MTTF), measures the average time between failures. | |
| − | + | *OEE Configuration: Overall Equipment Effectiveness. OEE Configuration factors together three variables (A, P, and Q (see below), to calculate a value that depicts an asset’s speed (how fast the asset produces), quality (good vs. bad products), and consistency (downtimes). | |
| − | + | *'''Performance: '''An OEE Configuration variable that depicts how fast an asset is produced. | |
| − | + | *'''Quality:''' An OEE Configuration variable that depicts the number of good products divided by the number of bad products. Good Units produced as a percentage of the Total Units Started. It is commonly referred to as the first pass yield (FPY). | |
| − | + | *'''Snapshots: '''Dashboard “pictures” that capture a common scenario on an individual factory floor. Users create snapshots to show asset status for information pertinent to their plants. For example, a user might want to compare Availability values for three different customers that use Fuji machinery. This user would create a snapshot showing downtimes for each line with Fuji equipment running per customer. This user could create another set of snapshots to show the target yield for their Fuji production lines and can configure each snapshot to run daily, weekly, etc. When customers visit, plant admins can quickly share Fuji line status, by accessing the configured snapshots. | |
| − | + | *'''Target Maintenance: '''42Q Portal where users configure target parameters for their unique plant requirements, upon which 42Q Live reports display. | |
| − | + | *'''Target Yield:''' The ideal yield for a given asset, against which the actual yields are measured; critical status is displayed based on the comparison of target yield and actual yield. | |
| − | + | *'''TEEP: '''A calculation that measures OEE Configuration against total available production time. | |
| − | + | *'''Widgets: '''Individual Graphic User Interfaces for 42Q Live. Widgets allow users to quickly set up dashboards and bypass complicated coding, to view live-time productivity on their shop floors. | |
| − | + | ||
| − | + | | |
| − | |||
| − | |||
| − | |||
| − | |||
| − | |||
| − | |||
| − | |||
| − | |||
| − | |||
| − | |||
| − | |||
| − | |||
| − | |||
| − | |||
| − | |||
| − | |||
| − | |||
| − | |||
| − | |||
| − | |||
| − | |||
| − | |||
| − | |||
| − | |||
| − | |||
| − | |||
| − | |||
| − | |||
| − | |||
| − | |||
| − | |||
| − | |||
| − | |||
| − | |||
| − | |||
| − | |||
| − | |||
| − | |||
| − | |||
Latest revision as of 14:37, 15 October 2024
42Q Home > Reporting > MESWeb Reports
Contents
- 1 Introduction
- 2 Access Level
- 3 MESWeb Parameters
- 4 MESWeb Reports
- 5 Reports
- 5.1 Snap Shots
- 5.2 Favorites and Most Viewed
- 5.3 CMMS Reports
- 5.4 Asset Downtime
- 5.5 AVL Detail List
- 5.6 Subinventory Detail List
- 5.7 Custom Reports
- 5.8 Default Reports
- 5.8.1 Crew Activity Reports
- 5.8.2 Cycle Time Details Report
- 5.8.3 Cycle Time Report
- 5.8.4 Labor Tracking Reports
- 5.8.5 Shop Order Direct
- 5.8.6 Indirect Details
- 5.8.7 QCP Details
- 5.8.8 QCP History
- 5.8.9 QCP Serials
- 5.8.10 Shop Order
- 5.8.11 Shop Order Summary
- 5.8.12 Solder Paste Process Tracking
- 5.8.13 Solder Paste Status Report
- 5.8.14 Unit History Report
- 5.8.15 WIP Distribution Report
- 5.8.16 WIP Serials Report
- 5.8.17 Workstation Monitor Report
- 5.8.18 Yield & Defect Report
- 5.8.19 Yield Evolution Report
- 5.8.20 Yield Serials Report
- 5.8.21 Top Defect Evolution Report
- 6 OEE Drill Down
- 6.1 Downtime Problem Trend And Frequency
- 6.2 Downtime Root Cause Trend And Frequency
- 6.3 History Status
- 6.4 OEE Asset Status Problem
- 6.5 OEE Asset Status Trend
- 6.6 OEE Availability
- 6.7 OEE By Asset
- 6.8 OEE Performance
- 6.9 OEE Performance Details
- 6.10 OEE Production Time
- 6.11 OEE Quality
- 6.12 OEE Quality Details
- 6.13 OEE Scheduled Downtime
- 6.14 OEE Unscheduled Downtime
- 6.15 Work Order Report By Problem
- 6.16 Work Order Report By Root Cause
- 7 OEE Reports
- 7.1 Downtime Root Cause Analysis Report
- 7.2 Downtime Trend Analysis Report
- 7.3 Energy Consumption by Product
- 7.4 Energy Consumption by Shop Order
- 7.5 Historical Energy Consumption
- 7.6 MTBF And MTTR Report
- 7.7 MTBF And MTTR Trend Report
- 7.8 OEE Dashboard
- 7.9 OEE Report
- 7.10 OEE Trend Chart Report
- 7.11 OEE Asset Status
- 7.12 System Connectivity Chart
- 7.13 Products Without Throughput Per Hour Targets
- 7.14 Report OEE by Product or Product Family
- 7.15 Report OEE by Shop Order
- 8 PTSR Reports
- 8.1 Board in Production
- 8.2 Board History Report
- 8.3 Break Panel Query
- 8.4 Replace Barcode Report
- 8.5 Barcode Information
- 8.6 Boards In Model
- 8.7 Boards In Work Order
- 8.8 Fujitrax - Operator Trace Log
- 8.9 Load Material Initial Quantity Report
- 8.10 Material on Board
- 8.11 Material on Board by Batch
- 8.12 Material Report
- 8.13 Material Where Used
- 8.14 Receipt Traveler Report
- 9 SOMS Reports
- 10 Glossary
Introduction
MESWeb is a powerful business intelligence application designed from the ground up to enable and simplify reporting from 42Q’s manufacturing execution systems and empower end-users with a streamlined and full-featured web interface. The application includes an ad hoc report design tool that allows users to create customized reports from heterogeneous data sources.
MESWeb provides access to information through a real-time replication reporting database to avoid negatively impacting the production system performance. In its standard configuration, here are some of the reports based on data tracked via MES101:
- Work in Progress (WIP Distribution)
- Yield, Defect, and Repair Analysis
- Serial Number historical details (Unit History)
- Evolution Reports (including moving averages) – Top Defect Evolution and Yield Evolution
- Throughput information
These reports can filter and search the data per common attribute, such as Customer, Part Number, Process, Date and Time range, Shifts, Evolution Intervals, etc. These default reports provide a significant level of visibility to manufacturing processes.
MESWeb can be used along with several RDBMS (relational database management systems) and drivers:
- ERP
- PostgreSQL
- MySQL
- MSSQL Server
- ODBC
Access Level
MESWeb has five distinct access levels:
Administrator (System Administrator)
The System Administrator has full access to MESWeb Central and Execution – all plants, all reports, and all customers. Basically, Administrator access includes the capabilities of all of the levels (Security Manager, Report Manager, and Data Source Manager). This access will be given to BSAs and global support personnel.
An administrator can perform the following functions:
- Access the "Access Control" module
- Create, Edit, and Delete Locations
- Create, Edit, and Delete Data Sources
- Create, Edit, and Delete Data Source types
- Create new custom reports globally
- Copy, Edit, and Delete existing custom reports globally
- Publish custom reports globally
- Manage permissions for all MESWeb locations
Security Manager (Local Administrator)
The Security Manager has full access to the plant(s) where he/she has been designated as the local Administrator for the MESWeb tool. The main responsibilities of this role are to organize permissions and manage customers. A Security Manager is able to:
- Visualize the Central MESWeb module in the MES Portal
- Access the "Access Control" module
- Grant permissions to his/herself and others from the Security Manager level to all lower levels
- Manage customers (add customers and map part numbers to them)
Report Manager
The Report Manager has access to "Reports" and "Report Groups" modules in the specific location(s) where he/she was designared as Report Manager. Inside those modules, a Report Manager is able to:
- Create custom reports and publish them only in his/her location
- Edit or Delete existing customer reports in his/her location
Note: Deleting is not possible if the report is published elsewhere
- Create Report Groups
- Add Reports to Report Groups
Data Source Manager
The Data Source Manager is responsible for creating and updating Data Sources and Data Source types.
A Data Source Manager is able to:
- Create, Edit, and Delete Data Sources
- Create, Edit, and Delete Data Source types
User (Execution Module only) Section Name
The User role is able to execute only those reports specifically granted access to him/her, and may not create new reports or modify existing reports. Administrators may restrict user access only to data belonging to specific customers and data sources.
MESWeb Parameters
As already has been said before, steps mainly work as filters to be used to execute the report. A step can contain a quantity of parameters, also, a step may or may not be the parent of another subsequent step. Take Customer and Part numbers as examples. In a previous step, the user selects the customer and the part numbers related to the selected customers will be shown.
MESWeb has a collection of parameters highly configurable by the user to help to filter the information, such as;
- Dropdown List - This manages a list where only one single option is selected.
- Checkbox - A checkbox is used for true/false parameters.
- Radio Buttons - Radio buttons allow the user to select one option from the list. Every option selectable is mutually exclusive. This also can be used to show different parameters.
- Date - A date parameter is used to select a specific date. This is a variant that also allows the user to select the time.
- Date Range - The date range is a parameter that allows selecting a range between two dates. (A variant that also allows the to user selects the time).
- Listbox - In a list box, multiple options can be selected. All checkbox allows to user to select every option available on the list. Users can filter options using the checkboxes Starts With, Contains, and Ends With after the user has selected the option and written some text in the text box has to click on the
icon to refresh the list.
The (highlighted down-arrow) icon moves all of the options in the "Available" list to the "Selected" list.
The (down-arrow) icon moves only the selected option in the "Available" list to the "Selected" list.
The (up-arrow) icon moves only the selected option in the "Selected" list back into the "Available" list, thus removing it from the "Selected" list.
The (highlighted up-arrow) icon moves all of the options in the "Selected" list back to the "Available" list, thus removing all options from the "Selected" list.
- Multi-Line Text Box - It allows adding lines as necessary.
Results
- Grids: Once a report is executed, a grid with the results will appear on the right side.
- Selected Parameters: The selected parameters will appear on the downside. This contains all the parameters that the user has selected and other useful information such as how many times the report took the application and the execution day.
Actions
There are three principal actions that can be done with the report's results: Print, Export, and Share.
- Print: This option allows the user to print the report. After selecting the Print, a dialog box appears. Select Print to display the report’s results.
- Export: The Export button downloads a file to the user's PC. The report can be saved in several formats, according to the user's needs Google Sheets, Excel, XML, CSV, and Text.
Follow the steps below to export to Google sheet:
Step 1: Select the Google Sheet option in the drop-down menu:
Step 2: Configure the Google permissions by selecting the correct option:
Step 3: A message will be displayed when the configuration is done:
Step 4: See the report exported in the selected format:
- Share: This option is used to share the report's results. The user can share the report via Email or as a Link.
Drilldowns
Drilldowns occur when a link is selected by the user in order to drill down or further expand the data. To access Drilldown reports, select the parent link. This report will generate another report using a parameter passed by the selected link from the first report. This second report will use the default configuration (i.e., WEB format and pagination) to generate the data. WIP serials, a default report that shows the serial numbers and other information, have a Drilldown to Unit History. Drilldowns can be identified by their format; they are all underscored.
MESWeb Reports
MESWeb is designed for user-friendliness, and executing reports is no exception. This guide will walk users through the simple process in just a few steps.
To access the MESWeb Reports page users must have access to the 42Q Portal. Once logged in, users must navigate to: Reporting>MESWeb.
Figure 1: Accessing to MESWeb Reports
Users can access MESWeb Reports from this page by navigating and selecting from the two options available:
- Administration
- Reports
Reports
Snap Shots
This tool allows users to schedule a report with selected parameters saved at a certain time and sent to certain users.
Follow the steps below to create a Schedule':'
1. Select the configuration icon in the top right corner of the page
2. Select Snap Shots within the list menu to open the Snap Shots window
Figure 2: SnapShot Schedule
3. Select the plus-sign icon to the left of the SnapShot to expand.
4. Select the plus-sign icon to the far right on the schedule bar to open the Schedule Configuration form.
Figure 3: SnapShot Additional Information
The Schedule Configuration form appears where the user can enter specific information, such as Name, Time Zone, and Frequency, about the schedule.
The Frequency section allows the user to establish the timing settings for running a report.
Figure 4: Schedule Configuration
In Schedule Information, Name, enabled and Time zone can be modified. In Repeat Every, the user can set all settings on when the report is going to run.
The Period section allows the user to set a date range for execution or repetition. Users can also select how would they like the report to be delivered by choosing from the available options in the Delivery Options section.
Figure 5: Duration and Delivery Options
In the example above, the report will be delivered via email in Excel format.
Figure 6: Sending
While sending an email, users have the option to input the date/time stamp as needed within the email and file subject lines.
By clicking on the blue calendar icon, wildcard options will be displayed including:
<%datetime%> → will add “11/25/2020 18:05:50”
<%date%> → will add “11/25/2020”
<%time%> → will add “18:05:50”
<%YYYY%> → will add “2020”
<%MM%> → will add “11”
<%DD%> → will add “25”
<%hh%> → will add “18”
<%mm%> → will add “05”
<%ss%> → will add “50”
Users can also select or combine the wildcards as they choose, for example, if the subject contains: “Test Example <%DD%>_<%MM%>”, then the user will receive mail with the title showing as: “Test Example 25_11”.
This form is shown when users select Email on Delivery Options.
Figure 7: Sending via FTP Server
Once the FTP information has been entered and set up, the user can Save, Cancel, or Delete the scheduled report
Favorites and Most Viewed
MESWeb will automatically save the most viewed reports. This will be shown within the Most Viewedgroup as well as every report has a star on the header that allows the user to save reports on the Favorites group.
CMMS Reports
The CMMS Reports provide users with a list of reports for CMMS activity recorded.
To access this report navigate: to Reporting > MESWeb > CMMS Reports.
Asset Downtime
The Asset Downtime Report can show the downtime lists with the Asset ID, Asset Name, Asset Type, Work Order ID, Department, Location, Line Name, Reporter, and Fixed by.
Chart Type: Data displays in Pareto Charts.
- Select Data Source in Step 1.
- Select Next.
- Select Parameters in Step 2.
- Asset Type (Optional).
- Work Order Status (Optional).
- Department (Optional).
- Location (Optional).
- Line Name (Optional).
- Downtime Date Range.
- Up Time (Optional).
- Indicate if users would like to export just the file.
- Select whether or not the parameters should be hidden when the report is executed.
- Select the interval to refresh the report as needed (Optional).
Figure 8: Asset Downtime - Data Source
Figure 9: Asset Downtime Report
Asset Event History
The Asset Event History Report can show the Asset Problem/Event lists with the Asset ID, Tag ID, Problem/Event Code, Creation Time and Process Time.
Chart Type: Data displays in Pareto Charts.
- Select Data Source in Step 1.
- Select Next.
- Select Creation Time in Step 2.
- Select Parameters in Step 3.
- Asset ID (Optional).
- Tag ID (Optional).
- Indicate if users would like to export just the file.
- Select whether or not the parameters should be hidden when the report is executed.
- Select the interval to refresh the report as needed (Optional).
Figure 10: Asset Event History - Data Source
Figure 11: Asset Event History Report
Asset List
The Asset List Report can show the PM Planned and PM Scheduled Assets records with the Asset ID, Asset Name, Asset Type, and other associated information.
Chart Type: Data displays in Pareto Charts.
- Select Data Source in Step 1.
- Select Next.
- Select Parameters in Step 2.
- PM Plan Date (Optional)
- PM Scheduled (Optional).
- Select Parameters in Step 3.
- Asset Type (Optional).
- Asset ID (Asset Name) (Optional).
- Asset Status (Optional).
- Location (Optional).
- Line Name (Optional).
- Indicate if users would like to export just the file.
- Select whether or not the parameters should be hidden when the report is executed.
- Select the interval to refresh the report as needed (Optional).
Figure 12: Asset List - Data Source
Figure 13: Asset List Report
AVL Detail List
The AVL Detail List Report can show the AVL(Approved Vendor List) details for the spare parts.
Chart Type: Data displays in Pareto Charts.
- Select Data Source in Step 1.
- Select Next.
- Select Parameters in Step 2.
- Spare Parts Part Number (Optional)
- Vendor (Optional)
- Indicate if users would like to export just the file.
- Select whether or not parameters should be hidden when the report is executed.
- Select the interval to refresh the report as needed (Optional) .
Figure 14: AVL Detail List - Data Source
Figure 15: AVL Detail List Report
Calibration Master and Recall List
The Calibration Master and Recall List Report can show the Asset’s calibration records with the Asset ID, Asset Name, Asset Type, and other associated information. Chart Type: Data displays in Pareto Charts.
- Select Data Source in Step 1.
- Select Next.
- Select Site in Step 2.
- Select Parameters in Step 3.
- Calibration Date is due.
- Planned Date.
- Input Status.
- Asset Status.
- Owning Dept (Optional)
- Location (Optional)
- Owner (Optional)
- Indicate if users would like to export just the file.
- Select whether or not parameters should be hidden when the report is executed.
- Select the interval to refresh the report as needed (Optional) .
Figure 16: Calibration Master and Recall List - Data Source
Figure 17: Calibration Master and Recall List Report
Labor History
The Labor History Report can show the Labor history records with the Asset ID, Asset Name, Work Order ID, Location, Line name, Start time, End Time, and Assigned User.
Chart Type: Data displays in Pareto Charts.
- Select Data Source in Step 1.
- Select Next.
- Select Parameters in Step 2.
- Start Time.
- Location (Optional).
- Line Name (Optional).
- Asset ID (Asset Name) (Optional).
- Indicate if users would like to export just the file.
- Select whether or not the parameters should be hidden when the report is executed.
- Select the interval to refresh the report as needed (Optional).
Figure 18: Labor History - Data Source
Figure 19: Labor History Report
PM Plan List with Work Order
The PM Plan List with Work Order Report can show the Asset’s PM plan work orders with the Asset ID, Asset Name, Asset Type, Work Order ID, Work Order Status, PM ID, PM Type, Plan Date, and other associated information.
Chart Type: Data displays in Pareto Charts.
- Select Data Source in Step 1.
- Select Next.
- Select Parameters in Step 2.
- PM Plan Date.
- PM Calendar Status (Optional).
- Department (Optional).
- Assigned Group (Optional).
- Work Order Status (Optional).
- Asset ID(Asset Name) (Optional).
- Indicate if you users would like to export just the file.
- Select whether or not the parameters should be hidden when the report is executed.
- Select the interval to refresh the report as needed (Optional).
Figure 20: PM Plan List with Work Order - Data Source
Figure 21: PM Plan List with Work Order Report
Spare Parts Details
The Spare Parts Details Report can show the details of the spare parts with the Asset ID, Asset Name, Asset Type, Line Name, Location, Spare Parts’ Part number, Serial Number , WO ID, Load Time, Unload Time and other associated information.
Chart Type: Data displays in Pareto Charts.
- Select Data Source in Step 1.
- Select Next.
- Select Parameters in Step 2.
- Spare Part’s Part Category (Optional).
- Spare Part’s Part Number (Optional).
- Vendor (Optional).
- Indicate if users would like to export just the file.
- Select whether or not the parameters should be hidden when the report is executed.
- Select the interval to refresh the report as needed (Optional).
Figure 22: Spare Parts Details - Data Source
Figure 23: Spare Parts Details Report
Spare Parts Usage by Asset
The Spare Parts Usage by Asset Report can show the spare parts usage by asset with the Asset ID, Asset Name, Asset Type, Line Name, Location, Spare Parts’ Part number, Serial Number, WO ID, Load Time, Unload Time and other associated information.
Chart Type: Data displays in Pareto Charts.
- Select Data Source in Step 1.
- Select Next.
- Select Parameters in Step 2.
- Load Time From Date.
- Load Time To (Optional).
- Spare Part’s Part Number (Optional).
- Location Name (Optional).
- Line Name (Optional).
- Asset Type (Optional).
- Asset ID (Optional).
- Work Order ID (Optional).
- Load User (Optional).
- Indicate if users would like to export just the file.
- Select whether or not the parameters should be hidden when the report is executed.
- Select the interval to refresh the report as needed (Optional) .
Figure 24: Spare Parts Usage by Asset - Data Source
Figure 25: Spare Parts Usage by Asset Report
Subinventory Detail List
The Subinventory Detail List Report can show the sub-inventory detail for the spare parts with the Spare parts’ part number, sub-inventory, locator, and QOH.
Chart Type: Data displays in Pareto Charts.
- Select Data Source in Step 1.
- Select Next.
- Select Parameters in Step 2.
- Spare Parts’ Part Number (Optional).
- Indicate if users would like to export just the file.
- Select whether or not the parameters should be hidden when the report is executed.
- Select the interval to refresh the report as needed (Optional).
Figure 26: Subinventory Detail List Report - Data Source
Figure 27: Subinventory Detail List Report
Tooling Usage Report
The Tooling Usage Report can show the tooling usage records with the Asset ID, Asset Name, Asset Type, Location, Current Usage and Max Usage.
Chart Type: Data displays in Pareto Charts.
- Select Data Source in Step 1.
- Select Next.
- Select Parameters in Step 2.
- Asset Type (Optional).
- Asset ID (Optional).
- Start Date (Optional).
- To Date (Optional).
- Indicate if users would like to export just the file.
- Select whether or not the parameters should be hidden when the report is executed.
- Select the interval to refresh the report as needed (Optional).
Figure 28: Tooling Usage Report - Data Source
Figure 29: Tooling Usage Report
Tooling Where Used by Serial Number
The Tooling Where Used by Serial Number Report can show the tooling where used with the Serial Number, Part Number, Shop Order, Process, Location, and Date.
Chart Type: Data displays in Pareto Charts.
- Select Data Source in Step 1.
- Select Next.
- Select Parameters in Step 2.
- Location.
- From Date.
- To Date.
- Indicate if users would like to export just the file.
- Select whether or not the parameters should be hidden when the report is executed.
- Select the interval to refresh the report as needed (Optional) .
Figure 30: Tooling Where Used by Serial Number - Data Source
Figure 31: Tooling Where Used by Serial Number Report
Work Order List
The Work Order List Report can show the work orders with the Work Order ID, Work Order Type, PM ID, Location, Line Name, Asset ID, Asset Name and other associated information.
Chart Type: Data displays in Pareto Charts.
- Select Data Source in Step 1.
- Select Next.
- Select Parameters in Step 2.
- Date Range.
- Assigned Group (Optional).
- Requestor Group (Optional).
- WO Status (Optional).
- Asset ID (Asset Name) (Optional).
- Indicate if users would like to export just the file.
- Select whether or not the parameters should be hidden when the report is executed.
- Select the interval to refresh the report as needed (Optional).
Figure 32: Work Order List Report - Data Source
Figure 33: Work Order List Report
Work Order Status
The Work Order Status Report can show the Work Order status with the Serial Number, Part Number, Shop Order, Process, Location, and Date.
Chart Type: Data displays in Pareto Charts.
- Select Data Source in Step 1.
- Select Next.
- Select Parameters in Step 2.
- Date Range.
- Assigned Group (Optional).
- Indicate if users would like to export just the file.
- Select whether or not the parameters should be hidden when the report is executed.
- Select the interval to refresh the report as needed (Optional).
Figure 34: Work Order Status Report - Data Source
Figure 35: Work Order Status Report
Custom Reports
Custom Reports is a categorization of report types that users can create. Custom reports perform the function of default reports and allow users to be more specific and narrow in their searches within the application.
See the steps below the steps to generate a Custom Report by Serial Number:
- Select a data source.
- Insert a serial number.
- (Optional) Select a plant.
- (Optional) Select a year.
- (Optional) Select a month.
- Select whether or not parameters should be hidden when the report is executed.
- (Optional) Select the interval to refresh the report as needed.
Figure 36: Defautl Report 1
Figure 37: Default Report 1
Note: This report will be able to use the serial number for finding its use in all of the materials from PTSR and Fujitrax databases, and show its scan board data and material information.
These same steps can also help users generate a Custom Report by Date Period.
Note: This report can use a scanning date period to retrieve its serial number.
Customer Active User Report
The Customer Active User Report allows the extraction of active billable users who logged into the 42Q system. The report also provides users with the total billable user count. A billable user is one who is assigned to a billable profile or is assigned to a non-billable profile but has access to reports other than Unit History Reports.
To access this report navigate to Reporting > MESWeb > Activity Reports > Customer Active User Report,
- Select a data source.
- Select a Client-Server.
- Select an IPortal Site.
- Select a MESWeb Application.
- Profile (Optional) allows users to filter reports by different profiles.
- Set the date range to search for which the report should be generated. The date range limit is 31 days.
- Click on the Go button. A list of all the active users in the selected date range will be displayed. The last row of the report shows the count of total billable users.
Figure 38: Customer Active User Report Generated
Location Activity Report
The Location Activity Report provides users a list of locations that had any activity recorded (e.g. when a unit is scanned and passed to another location).
To access this report navigate to Reporting > MESWeb > Activity Reports > Location Activity Report
- Select a data source.
- Select the Mfg Line.
- Set the date range to search for location activities within that date range The date range limit is 90 days.
- Click on the 'Go' button. A list of locations containing assigned processes, counters of the pass to, and counters of activity.
Note: Pass to count is how many units passed from that location and the Activity counts how many activities were recorded at that location (quantity of attributes or commands that are entered). The report only provides the list of locations that have Passed to count or Activity count values greater than 0.
Figure 39: Location Activity Report Generated
Default Reports
Crew Activity Reports
To enter the Crew Activity Report the user must go to MESWeb> Reports> Default Reports> Crew Activity.
Note: The user can access Crew Activity Reports by selecting them and inserting information for each step provided.
Figure 40: Crew Activity - Data Source
- Choose the Data Source provided with the drop-down menu of Data Source.
- In order to choose a Data Source, users must select the customer. Users can search for a specific member report that may be available by “Crew” or by “Employee Number”.
Users can conduct searches by inserting information in the optional boxes. Users can search by using three options to find searches:
- Starts With option: Allows users to search using the first few letter(s) of the name.
- Contains option: This allows users to search with letters that are contained within the name.
- Ends With option: Allows users to search using the last few letter(s) of the name.
Figure 41: Crew Activity - Crew
Once the user types in the first few or last few letters to search, click the Refresh button. Add the desired choice from the Available list to the Selected list by clicking the downward arrow.
Note: A specific Crew name should be selected in order to display the Report Type.
The available options for crews are filtered for the crew name options.
Note: The down arrow will add the selected into the ‘Selected’ box below. The upward arrow will remove the selected from the selected box.
Figure 42: Crew Activity - Report Type
- Next, select the Report Type desired. The options are as follows:
- Crew Activity
- Crew Status
- Insert the desired time period using the From and To options and select the time for each.
- Setting a time period will allow users to see all the activities for a specific crew name selected.
Note: Checking the box for the Hide on executing parameters option will hide the parameters once the report is executed.
- Click Go. The reports will be displayed as follows based on the Report Type chosen:
Crew Activity
When the Crew Activity Report is selected, the final form will allow users to view a specific crew name and description concerning information about when the user logged in and logged out.
Figure 43: Report Type - Crew Activity
Crew Status
When the Crew Status Report is selected, the final form will allow users to view information concerning crew members' names, descriptions, employee ID, and names.
Figure 44: Report Type - Crew Status
Cycle Time Details Report
Cycle Time Details Report provides essential metrics including cycle time, hands-on time, unattended time, and wait time, segmented by each serial and operator activity.
Figure 45: Cycle Time Details Report
Cycle Time Details report allows user to filter the report by:
- Part Number: Users can optionally select one or multiple parts, for searching a part number use the product list box.
- Process: Users can select one or multiple processes, but are not required, to search for a process users need to use the process list box.
If a part is selected for the report generation, the selection of the process in the parameter can be optional.
If a part is not selected then the selection of the process should be mandatory in the parameter.
Cycle Time by Details report shows records of individual activity for all the serials and operators. It shows the record of:
- Serial Number
- Employee Number
- Hands-on Time
- Cycle Time
- Unattended time
- Wait Time
At the end of the report provide the total, minimum, maximum, average, and quantity of serials for all the times (hands-on time, unattended time, cycle time, and wait time) add all the Cycle Time reports and Labor by SO/Serial reports as default reports.
Provide the Unit of Measure(UOM) for each time-based data reported (like cycle time, and unattended time).
Cycle Time Report
Cycle Time report displays hands-on time, unattended time, cycle time, and wait time averaged by each process for each part number selected.
Prerequisites
Before Moving to the cycle time report:
- Set the Generic attribute “ps_cylce_time_enable” as True. By default this attribute is empty.
Navigate through:'Administration >Generic Attribute Maintenance
By setting this attribute to true, the Cycle time calculator starts automatically and records the cycle time.
Figure 46: Cycle Time Report
- Choose the parameters - Data source, Partno, Process.
If the part number is chosen, then choosing the Process name becomes optional
For each process cycle time is the average of all the locations for that process.
Cycle Time report allows users to filter the report by:
- Part Numbers: Users can optionally select one or multiple parts, this should include product families as well, if a product family is selected provide the cycle time, hands-on time, unattended time, and wait time product family.
- Process: Users can optionally select one or multiple processes, for searching by process number use the process list box.
If a part(s) is selected for the report generation, the selection of process in the parameter can be optional. If a part(s) is not selected then the selection of process should be mandatory in the parameter. It has to be either selected by part(s) or by process(s).
Note: Date Range (99 days maximum) required field.
Cycle Time report shows the comparison with the baseline setup in SQC Configuration:
- Baseline column: The baseline for a process is the standard time stored in the baseline table for that process by part number. If no baseline is defined in the SQC table display the value as ‘n.a’
- Efficiency column: Efficiency is ((Cycle time/Baseline Column Value)*100). If the baseline value is ‘n.a.’ display the efficiency value as ‘n.a’
Note: The cycle time report provides a drill down from cycle time values to the Cycle Time Details report.
Labor Tracking Reports
MESWeb Labor Tracking Report allows administrators to track employee labor records over a 90-day span. Administrators can then Print, Export, Share via Email/Link, or create a Snapshot.
To access the Labor Tracking Report, the user must go to MESWeb > Reports > Default Reports > Labor Tracking.
Figure 47: Labor Tracking - Data Source
- Choose the data source from the ‘Data Source’ drop-down menu.
- Click Next.
Figure 48: Labor Tracking - Customers
- A list of customers will be displayed once the data source is selected.
- Select the customer desired. Once the customer is chosen, it will appear within the selected box.
- Click “Next”.
Figure 49: Labor Tracking - Products
- Within Step 3, users will have four optional parameters to conduct a search. Those options are as follows:
- By selecting one or more optional Products.
- By selecting one or more optional Shop Orders.
- By selecting one or more optional Processes.
- By selecting the optional Employee.
Figure 50: Labor Tracking - Shop Orders
Users can search by Shop Order by inserting the Shop Order number into the box provided and clicking the refresh button.
Figure 51: Labor Tracking - Processes
Users can search by Processes by inserting the processes title into the box provided and clicking the refresh button.
Figure 52: Labor Tracking - Employee
Users can search by Employee by inserting the Employee number into the box provided and clicking the refresh button.
Figure 53: Labor Tracking - Report Type
Report Types
For Labor Tracking, there are different Report Types such as Employee Efficiency, Labor Tracking, Shop Order Direct, and Indirect Details.
Each one of those reports supports different filters to consume the information of the activity tables.
- Upon choosing the desired Report Type, click ‘Next’.
Figure 54: Labor Tracking - Report Time
- Depending on the previous Report Type chosen, users will then be able to continue with Step 4 by selecting the options desired in each drop-down menu.
- Select the Report Time. Options are as follows:
- Hours
- Minutes
- Select the field to Group By, which has a given option based on the Report Type chosen.
- Insert the desired time period using the From and To options and select the time for each.
Note: Checking the box for the Hide on execute parameters option will hide the parameters once the report is executed.
Click Go. The reports will be displayed as follows based on the Report Type chosen:
Employee Efficiency
When the Employee Efficiency report is 'Grouped By' Employee and/or Shift, the final form will allow users to view:'
- The specific time that a member was working on a certain activity.
- Good: quantity of units passed in the period of time selected by each employee.
- Scrap: quantity of units scrapped in the period of time selected by each employee.
- Standard Hours: the average time or number of hours that takes to manufacture a unit or assembly.
- Actual Indirect Hours: total time of indirect activities recorded against specific department/work center throughout Labor Tracking.
- Actual Direct Hours: elapsed time between the clock in and clock out of Labor activities.
- Actual Total Hours: this comes from the calculation of total hours of indirect/direct activities recorded by employees against a department.
- Run Earned Hours: comes from the calculation of actual good parts produced (passed units) * quoted parts per hour (standard run hours).
- Run Efficiency Percentage: results from the calculation of Actual Total Hours/(Standard Hours * Throughput) *100.
- Utilization Percentage: comes from the calculation of (Direct Hours/Actual Total Hours) * 100.
Figure 55: Report Type - Employee Efficiency Example (left side)
Figure 56: Report Type - Employee Efficiency Example (right side)
When the Labor Tracking report is Group By Shop Order, Product, Employee, Shift, Process, and/or Location, the final form will allow users to view the Shop Order, Product, Employee, Shift, Process, or Location, and the direct hours associated with each.
Figure 57: Report Type - Labor Tracking Example
Shop Order Direct
When the Shop Order Direct report information is Group By Shop Order, Employee, Shift, and / or Process the final form will allow users to view the employees and the direct hours spent on specific activities.
Figure 58: Report Type - Shop Order Direct Example
Indirect Details
When the Indirect Detailed reports are 'Group By' Employee and/or Shift, the final form will allow users to view information regarding employees and direct hours spent on specific activities.
Figure 59: Report Type - Indirect Details Example
QCP Details
The QCP Checklist is a functionality that allows the MESWeb users to access a set of questions and answers done previously in Production Workbench.
To enter the QCP Checklist the user must go to MESWeb>Reports>Default Reports, there, three different reports are available: QCP History, QCP Details, and QCP Serials.
Note: The user can access QCP History, QCP Details, and QCP Serials by selecting them.
QCP Details allows the user to see and customize the information placed into the QCP checklist; Employee name, Execution date, Validation date, Action, Approver, and Justification. It also allows the user to see the list of the current and previous questions and answers, approved or reopened related to the selected QCP displayed with a visual indicator of whether the answers failed or passed.
To access, navigate to MESWeb > Reports > Default Reports > QCP Details.
- Select a data source.
- (Optional) Select QCP
- (Optional) Select Part Number
- (Optional) Select Process
- (Optional) Select Locations
- (Optional) Select employee
- Check QCP obsoletes.
- Filter data by a date range.
- Indicate if you would like to export just the file.
- Select whether or not parameters should be hidden when the report is executed.
- (Optional) Select the interval to refresh the report as needed.
Figure 69: QCP Details parameter
Figure 70: QCP Details Report
Figure 71: QCP Details Report Justification
Note: The color on the sidebar, changes according to the status; Red= Expired, Green= Active
QCP History
To access QCP History, navigate to MESWeb > Reports > Default Reports >QCP History. Users can get the report by following the parameters given below:
- Select a data source.
- (Optional) Select QCP
- (Optional) Select Part Number
- (Optional) Select Process
- (Optional) Select Locations
- (Optional) Select employee
- Check QCP obsoletes
- Select a date range
- Indicate if you would like to export just the file.
- Select whether or not parameters should be hidden when report is executed.
- (Optional) Select the interval to refresh the report as needed.
The Date Range allows the user to search the previously filled/answered QCP checklists in the selected date ranges; once the user fills in the date and time, they can click the Go button.
Note: These configurations are showing on the left side of the screen, as displayed in the following image:
Figure 70: QCP History parameters
The QCP information will be displayed on the screen, with their respective configuration; Name, Version, Action, Approver Name and Number, Process, Part number, Location etc. It also shows the Effective Date and the Expiration Date, and also displays the Status of the QCP; this can be either Active or Expired, and the Employee Number and Name of the user who filled out the QCP checklist.
Figure 72: QCP History Report1
Figure 73: QCP History Report2
The user can drill down from QCP History to QCP Details, by selecting the QCP Name in the list.
Note: The Effective Date and the Expiration Date information is associated with every Serial Number, scanned between the active period of the checklist and before it expires.
QCP Serials
To access the QCP Serials, the user can select the option from the QCP Details page, as displayed in the following image:
Figure 64: QCP Serials
Once this option is selected, the screen will display the QCP Serials, allowing the users to see the list of serials and their respective information, Serial Number, Part Number, Process, Location QCP name, and the QCP version.
Figure 65: QCP Serials Detail Chart
By selecting the Serial Number, shown in the image above; the user is able to see the Unit History.
This allows the user to see detailed information about the Serial Numbers and all their activity throughout their lifecycle.
Figure 66: Unit History
Shop Order
The Shop Order Report presents details for one or more shop orders along with all serials associated with them. It is important for users to track shop orders, and in order to do so, a user needs to be able to see the details of the units that comprise the shop order.
Follow the steps below to generate a Shop Order Report:
1. Select a Data Source
2. Enter up to 1000 Shop Order Numbers
3. Select whether or not parameters should be hidden when the report is executed
4. (Optional) Select the interval to refresh the report as needed
Shop Order Summary
The Shop Order Summary Report displays information about the part numbers, the order status, and the number of units in each status of a shop order.
Follow the steps below to execute the Shop Order Summary Report:
1. Select a Data Source
2. Enter up to 100 Shop Orders (only one per line)
3. Select whether or not parameters should be hidden when the report is executed
4. (Optional) Select the interval to refresh the report as needed
The report result is:
Figure 67: Shop Order Summary Report
By entering one or several Shop orders this report will display information about, their part numbers, order status, and the quantity of units in each status.
Solder Paste Process Tracking
The Solder Paste Process Tracking Report details the Process of any items with the Solder Paste inventory, specified by part and serial numbers. It shows the process, with timestamp data. See the steps below the steps to generate the Solder Paste Process Tracking Report
- Select a data source
- (Optional) Select a Solder Paste P/N, users can select Starts with/Contains/Ends with the characters
- (Optional) Select a Solder Paste S/N
- (Optional) Select a Process
- (Optional) Select a Step by
- Select a date range
- Select Display Data as users can select by Web View/Excel File/Google Sheet/XML File/CSV File/Text File
- Select whether or not parameters should be hidden when the report is executed.
- (Optional) Select the interval to refresh the report as needed.
The report result is:
Figure 68: Solder Paste Process Tracking Report Result
Solder Paste Status Report
The Solder Paste Status Report details the status of any items with the Solder Paste inventory, specified by part and serial numbers. It shows the current status, with timestamp data.
See the steps below the steps to generate a Solder Paste Status Report
- Select a data source
- (Optional) Select a Solder Paste P/N
- (Optional) Select a Solder Paste S/N
- (Optional) Select a Solder Paste Status
- Select a date range
- Select whether or not parameters should be hidden when the report is executed.
- (Optional) Select the interval to refresh the report as needed.
The report result is:
Figure 69: Solder Paste Status Report Result
Unit History Report
The Unit History Report gives detailed information about a specific unit and all its activities throughout its lifecycle. This allows users to see information about a specific unit and its activity.
Follow the steps below to generate a Unit History Report:
1. Enter up to 150 Serials
2. Select whether or not parameters should be hidden when the report is executed
3. (Optional) Select the interval to refresh the report as needed
Figure 80: Unit History
Unit History Report now has the capability to query data from the MES Archive integrated into the report.
The Archive parameter was added to the report to query archive data or only be notified when searched serials have already been archived.
Figure 81: Unit History
When the report is executed with the Include Archive parameter selected, it will query Archive data for all searched serials that have been archived. Archived serials will be labeled as such, and data will be presented in the same format as regular serials. Both archived and regular serials can be searched at the same time.
When the report is executed with the Include Archive parameter unselected, serials that have been archived will be labeled as such, and the user will be given the option to click the link in order to get the data from Archive. This is to prevent a longer execution time in case the user is unaware serials have been already archived.
A Report executed with Include Archive selected
Figure 82: Unit History
Figure 83: Unit History
A report executed with Include Archive selected
A report executed with Include Archive unselected
Export UH
Allows the user to export the report with the selected format without the render on the screen and to improve the performance.
Figure 84: Export UH
Export UH contains two options to export the file; Exclude Measurement Information and Split by Serial and Export as a ZIP file.
Figure 85: Options for Export UH
Note: If the users choose to split by serial and export as a Zip if there are multiple serial numbers, the Zip file will create a folder with all the numbers in a file.
Display Data as would allow users to choose from several different kinds of files to download/ view; Web view, Excel File, Google Sheet, XML File CSV File, and Text File.
Unit History report has a link where users are able to open the QCP Details report tied to the specific serial number. Once the user, selects this icon displayed at the location column, it redirects to the QCP Details report.
If the serial number has more than one QCP but belongs to a different location/process, then the system will display separate links for each location/process that has a related QCP.
Figure 86: Link to QCP Details Report
If the serial has more than one QCP associated to it, it will display the latest QCP checklist information at the top of the QCP details report list. If the serial displayed in Unit History does not have any QCP associated with it, the Unit History report won't display any QCP link.
Figure 87: QCP Details Report
Unit History With Multimedia File
Production Workbench supports Multimedia Data Collection (PDF, Imagen, and Video) and users can take photos using their computer or tablet camera and upload any multimedia file.
This will be reflected in the Unit History report, where the user is able to see the image upload for the SN.
For more information about Multimedia files, refer to Production Workbench SOP.
Figure 88: Unit History with Multimedia File Attached
Clicking on the image icon, the attached file will be displayed:
Figure 89: Expanded Image
Select the expand icon to see just the image.
Figure 90: Uploaded Image Details
Part Order Summary Report
This report displays the following information about works orders: Part Number, Status, Quantity, and Serial Quantity. It also shows the due date, last activity, and how many days have passed before the due date.
Follow the steps below to generate a Part Order Report:
1. Select a Data Source
2. Enter up to 500 Part Numbers (one per line)
3. Select whether or not parameters should be hidden when the report is executed
4. (Optional) Select the interval to refresh the report as needed
Figure 79: Part Order Summary
RTY Report
RTY shows how many activities were created by a Global Process. The report can display the results by month, week, or day.
Follow the steps below to generate an RTY Report:
1. Select a Data Source
2. Select one or more Customers
3. Select the Data Range (Start and End Dates)
4. Select whether or not parameters should be hidden when the report is executed
5. (Optional) Select the interval to refresh the report as needed
Figure 80: RTY Report
WIP Distribution Report
The WIP Distribution Report is designed to take the parameters specified by the user and return the number of units that are currently in WIP based on those parameters. The WIP Distribution Report can group results in several ways, depending on the user's preferences. The top level of the results offers the ability to drill down to the unit details. The WIP Distribution Report aims to give users the ability to get a snapshot of where their plant s workload is distributed.
Follow the steps below to generate a WIP Distribution Report:
1. Select a Data Source
2. Select one or more Customers
3. Select one or more Products
4. (Optional) null
5. Select one or more Departments
6. Select one or more Unit Statuses
7. (Optional) Select one or more Processes
8. Select one or more Workstations
9. Select whether or not parameters should be hidden when the report is executed
10. (Optional) Select the interval to refresh the report as needed
Figure 81: WIP Distribution Report
WIP Serials Report
The WIP (Work in Process) Serials Report displays all the serial numbers that are in production.
Follow the steps below to generate a WIP Serial Report:
1. Select a Data Source
2. Select one or more Customers
3. Select one or more Products
4. Select the order that should be used to filter the results
5. Select one or more Departments
6. Select one or more Unit Status
7. Select one or more ways to group the information
8. (Optional) Select a field to group by
9. Indicate if you would like to display charts or not
10. Select whether or not parameters should be hidden when the report is executed
11. (Optional) Select the interval to refresh the report as needed
The report result is:
Figure 82: WIP Serials
Workstation Monitor Report
The Workstation Monitor Report shows how many units have been processed on a particular station.
| Follow the steps below to generate a Workstation MonitorReport: |
1. Select a Data Source
2. Select a Customer
3. Select a Product
4. Select a Workstation
5. Select the Date and Time Range for the Shift
6. Enter the start time for the first break (format: HH:mm)
7. Enter the end time for the first break (HH:mm)
8. (Optional) Enter the start time for the second break (HH:mm)
9. (Optional) Enter the end time for the second break (HH:mm)
10. (Optional) Enter the start time for the third break (HH:mm)
11. (Optional) Enter the end time for the third break (HH:mm)
12. Enter UPH target.
13. Select whether or not parameters should be hidden when the report is executed
14. (Optional) Select the interval to refresh the report as needed
Figure 83: Workstation Monitor
Yield & Defect Report
The purpose of the Yield & Defect Report is to give users a high-level overview of progress. It lists the total number of units with activity, pass/fail quantity, and the yield for each process that is selected (filtered by other parameters as well). From there users can see details about the most common defects for a given process as well as details about each unit.
Managers can use this information to pinpoint the areas on the floor that require their attention and discover why. To execute this report, the user must be in Execution Module, where he/she should select the Reports menu and navigate to Default Reports Yield & Defect Report.
Follow the steps below to generate a Yield & Defect Report:
1. Select a Data Source
2. Select one or more Customers
3. Select one or more Products
4. Select one or more Processes
5. Select one or more Lines
6. Select a Pass to view
7. Select one or more Shifts
8. Select one or more Workstations
9. Enter a Date Range or select one or more Orders
10. Select a field to group by
11. (Optional) Select a second field to group by
12. Choose whether to include moving units
13. Indicate if you would like to consider "No Fault Found" as passes
14. Indicate if you would like to view graphs
15. Select whether or not parameters should be hidden when the report is executed
16. (Optional) Select the interval to refresh the report as needed
The report result is:
Figure 84: Yield & Defect Report
Yield Evolution Report
This report displays the percentage of success of the product for a determined period (Hour/Day/Week/Month). Users can view charts of this data and have tabular data presenting the hour/date/unit/passed/yield of a product. This data is presented via "All Products".
A drilldown report, which offers more details about the product, is available for unit/passed/failed. To execute this report, the user must be in Execution Module, where he/she should select the Reports menu and navigate to Default Reports Yield Evolution Report.
Follow the steps below to generate a Yield Evolution Report:
1. Select a Data Source
2. Select one or more Customers
3. Select one or more Products
4. Select one or more Processes
5. Select one or more Lines
6. Select a pass to view
7. Select one or more Shifts
8. Set the values for the Evolution Parameter
9. Select Start Date
10. Select which field to group by first
11. (Optional) Select which field to group by the second
12. Choose whether to include moving units
13. Indicate if you would like to display charts
14. Select whether or not parameters should be hidden when the report is executed
15. (Optional) Select the interval to refresh the report as needed
The report result is:
Figure 85: Yield Evolution Report
Yield Serials Report
The Yield Serials Report displays the following information: Serial Number, Product, Workstation where the action occurred, Serial Quantity, Date of Action, and the Action.
Follow the steps below to generate a Yield Serials Report:
1. Select a Data Source
2. Select one or more Customers
3. Select one or more Products
4. Select one or more Processes
5. (Optional) Select one or more Lines
6. Select a pass to view
7. (Optional) Select one or more Shifts
8. (Optional) Select one or more Global Processes
9. (Optional) Select one or more Workstations
10. (Optional) Filter Data by a Date Range
11. (Optional) Select the number of Shop Orders
12. Select one or more Actions
13. Select whether or not parameters should be hidden when the report is executed
14. (Optional) Select the interval to refresh the report as needed
The report result is:
Figure 86: Yield Serials Report
Top Defect Evolution Report
The Top Defect Evolution Report allows users to have a better view of defects registered in MESR for one or more products. Those defects are classified by defect name, which produces a sum (number of defects and percent defect from total) of defects found in a given range for the specific defect. This report also lists the defect total based on a range of time.
Follow the steps below to generate a Top Defect Evolution Report:
1. Select a Data Source
2. Select one or more Customers
3. Select one or more Products
4. Select one or more Processes
5. Select one or more Lines
6. Select a Pass to view
7. Select one or more Shifts
8. Set the values for the Evolution Parameter
9. Select Start Date
10. Select which field to group by first
11. (Optional) Select which field to group by the second
12. Select the type of report you want to run
13. Indicate if you would like to view graphs, and, if so, select the type
14. Select whether or not parameters should be hidden when the report is executed
15. (Optional) Select the interval to refresh the report as needed
The report result is:
Figure 87: Top Defect Evolution Report
OEE Drill Down
To view each report in detail and its corresponding work orders
Downtime Problem Trend And Frequency
The Downtime Problem Trend and Frequency Report shows production line patterns over time.
- Select Data Source.
- Select Next.
- Select Site and Date Range: Select the time period (To/From) for the report using the drop-down calendar.
- Select Parameters in Step 3
- By: Select time frame: Month, Week, or Day. (Week is the default).
- Display by:: Select if users would like the chart to display the number of times the problem occurred (Occurrences) or the time period during which the problem persisted (Duration).
- KPI By: Select the Key Performance Indicator the chart will show: Problem, Problem Type, Problem Category, Location, Line, Project, Asset Type, Asset ID, or Overall.
- Production PN: (Optional) Select the PN to analyze.
Note: PN reports will show data about the product being built.
- Production WO: (Optional) Select the Production WO analysis.
Note: Work Order refers to the work order assigned in Oracle, and will show data connected to the product build.
- Non Stop: (Optional. Default is checked): Check the box to view data that pertains to machinery problems on lines that are still running (nonstop). Uncheck to view only lines which have been shut down due to machinery problems.
- Location: (Optional) Select the building, floor, level, etc., etc. Department, Location, or Line.
- Production Line: (Optional) Select the manufacturing line.
- Asset: (Optional): Select the individual Asset to analyze downtime trends.
- Asset Type: (Optional) Select the machine (Asset) type to analyze.
- WO Project: (Optional) Select the Work Order Project from Oracle’s database to analyze.
- Problem Category: (Optional): Select data to display according to a specific Asset Problem (e.g. Misalignment, Jammed). Asset Problems are configured in CMMS Asset.
- Problem Type: (Optional): Select data to display according to a specific Asset Problem Type (e.g. Damaged Sensor). Asset Problems are configured in CMMS Asset.
- Set Parameters in Step 4:
- Problem: (Optional): Select the Problem for display in the Downtime Trend Report.
- Display Data as: (Checked by default) Uncheck to see parameters displayed next to the report.
- Refresh Rate: (Do not Refresh is default) Users can change the refresh rate by minutes up to one hour.
- Select Go.
Figure 90: Downtime Trend and Frequency Report
Downtime Root Cause Trend And Frequency
The Downtime Root Cause Trend And Frequency Report can show the Downtime Root Cause Trend chart.
Step 1
- Select a data source
Step 2
- Select a plant site
- Select the start date
- (Optional) Select a the end date(default Today)
- Select how the graphic is going to show the date format.
Step 3
- (Optional) Enter a production PN.
- (Optional) Enter a production WO.
- Select if including non stop.
- (Optional) Select a location
- (Optional) Select a production line
- (Optional) Select an asset
- (Optional) Select a asset type
- (Optional) Select a WO project
- (Optional) Select the Root Cause Category
Step 4
- (Optional) Select the Root Cause Name
- Indicate if you would like to export just the file.
- Select whether or not parameters should be hidden when the report is executed.
- (Optional) Select the interval to refresh the report as needed.
Select Go.
Figure 91: Downtime Root Cause Trend And Frequency
History Status
Users can view the history status by the history status report with Asset name, time to repair, time between Failures, Problem Type.
Step 1
- Select a data source.
Step 2
- Select a site
Step 3
- Select an asset
- Date Range
- Indicate if you would like to export just the file.
- Select whether or not parameters should be hidden when the report is executed.
- (Optional) Select the interval to refresh the report as needed.
Select Go.
Figure 92: History Status Report
OEE Asset Status Problem
The OEE Asset Status Problem Report can show the Asset’s status and Problem lists with the Asset ID, Status, Problem Type, Problem Name, Start Date, and End Date.
Step 1
- Select a data source
Step 2
- Select a site
Step 3
- Select one of the parameters Location, Line, or Asset.
- Select the status you want to see.
- Filter data by a date range.
- Indicate if you would like to export just the file.
- Select whether or not parameters should be hidden when the report is executed.
- (Optional) Select the interval to refresh the report as needed.
Select Go
Figure 93: OEE Asset Status Problem Report
OEE Asset Status Trend
The OEE Asset Status Trend Report can show the Asset Status Occurrences and Asset Status Duration charts.
Step 1
- Select a data source
Step 2
- Select a site
Step 3
- Select one of the parameters Location, Line or Asset.
- Filter data by a date range.
- Select the chart you want to see.
- Indicate if you would like to export just the file.
- Select whether or not parameters should be hidden when the report is executed.
- (Optional) Select the interval to refresh the report as needed.
Select Go.
Figure 94: OEE Asset Status Trend - Data Source
Figure 95: OEE Asset Status Trend Report
OEE Availability
The OEE Availability Report can show the OEE availability with the WO, Asset, Shop Order, Downtime, Uptime, Problem and Root Cause.
Step 1
- Select a data source.
Step 2
- select a Site
Step 3
- Asset ID (Asset Name)
- From Date
- To date
- Indicate if you would like to export just the file.
- Select whether or not parameters should be hidden when the report is executed.
- (Optional) Select the interval to refresh the report as needed.
Select Go.
Figure 96: OEE Availability Report
OEE By Asset
The OEE By Asset Report can show the OEE charts by Asset.
Step 1
- Select a data source
Step 2
- Select a site
Step 3
- Select one of the parameters, Department, Location, Line or Asset.
- (Optional) Select a time range type
- (Optional) Filter data by a date range.
- Select the chart you want to see.
- Indicate if you would like to export just the file.
- Select whether or not parameters should be hidden when the report is executed.
- (Optional) Select the interval to refresh the report as needed.
Select Go.
Figure 97: OEE By Asset Report
OEE Performance
The OEE Performance Report can show the OEE Performance lists with the Asset/Line, Time Range, Target QTY and Finished QTY.
Step 1
- Select a data source.
Step 2
- select a Site
Step 3
- Asset ID (Asset Name)
- From Date
- To Date
- Indicate if you would like to export just the file.
- Select whether or not parameters should be hidden when the report is executed.
- (Optional) Select the interval to refresh the report as needed.
Select Go.
Figure 98: OEE Performance Report
OEE Performance Details
The OEE Performance Details Report can show the OEE Performance Details lists with the Asset, Finished QTY, Serial Record Date, Part Number, Process, WorkStation and Serial.
Users can also go to the Unit History Report from this Details report by clicking on the Serial column.
Step 1
- Select a data source.
Step 2
- Asset Id
- From Date
- To Date
- Indicate if you would like to export just the file.
- Select whether or not parameters should be hidden when the report is executed.
- (Optional) Select the interval to refresh the report as needed.
Select Go.
Figure 99: OEE Performance Details Report
Users can access the corresponding Unit History Report within this report by clicking the column Serial.
Figure 100: OEE Performance Details - Unit History
OEE Production Time
The OEE Production Time Report can show the OEE production Time lists with the WO, Asset, Shop Order, Downtime, Uptime, Running Time, Idle time, Problem and Root Cause.
Step 1
- Select a data source.
Step 2
- Select the Site
Step 3
- Asset ID (Asset Name)
- From Date
- To Date
- Indicate if you would like to export just the file.
- Select whether or not parameters should be hidden when the report is executed.
- (Optional) Select the interval to refresh the report as needed.
Select Go.
Figure 100: OEE Production Time Report
OEE Quality
The OEE Quality Report can show the OEE Quality lists with the Asset, Shop Order, Time Range, Target UPH, Finished QTY and Good QTY.
Step 1
- Select a data source.
Step 2
- Site
Step 3
- Asset ID (Asset Name)
- From Date
- To Date
- Indicate if you would like to export just the file.
- Select whether or not parameters should be hidden when the report is executed.
- (Optional) Select the interval to refresh the report as needed.
Select Go.
Figure 102: OEE Quality Report
OEE Quality Details
The OEE Quality Details Report can show the OEE Quality Details lists with the Asset, Finished QTY, Process, WorkStation, Serial Record Date, Part Number, Serial, Action, and Defect Code.
Users can also go to the Unit History Report from this Details report by clicking on the Serial column.
Step 1
- Select a data source.
Step 2
- Asset Id
- From Date
- To Date
- Indicate if you would like to export just the file.
- Select whether or not parameters should be hidden when the report is executed.
- (Optional) Select the interval to refresh the report as needed.
Select Go.
Figure 103: OEE Quality Details Report
Users can access the corresponding Unit History Report within this report by clicking the column Serial.
Figure 104: OEE Quality Details- Unit History
OEE Scheduled Downtime
The OEE Scheduled Downtime Report can show the Scheduled downtime lists with the WO, Asset, Shop Order, Downtime, Uptime, Scheduled Downtime, Problem/Reason, and Root Cause.
Step 1
- Select a data source.
Step 2
- select a site
Step 3
- Asset ID (Asset Name)
- From Date
- To Date
- Indicate if you would like to export just the file.
- Select whether or not parameters should be hidden when the report is executed.
- (Optional) Select the interval to refresh the report as needed.
Select Go.
Figure 105: OEE Scheduled Downtime Report
OEE Unscheduled Downtime
The OEE Unscheduled Downtime Report can show the unscheduled downtime lists with the WO, Asset, Shop Order, Downtime, Uptime, Unscheduled Downtime, Problem/Reason, and Root Cause.
Step 1
- Select a data source.
Step 2
- select a site
Step 3
- Asset ID (Asset Name)
- From Date
- To Date
- Indicate if you would like to export just the file.
- Select whether or not parameters should be hidden when the report is executed.
- (Optional) Select the interval to refresh the report as needed.
Select Go.
Figure 106: OEE Unscheduled Downtime Report
Work Order Report By Problem
The Work Order Report By Problem can show the Work Order lists with the Work Order, Location, Line Name, Asset, Problem, Problem Category, and Asset Downtime.
Step 1
- Select a data source.
Step 2
- site
- Problem By
Step 3
- Please select a value from list
- (Optional) Time Range Type
- (Optional) Date Range
- Indicate if you would like to export just the file.
- Select whether or not parameters should be hidden when the report is executed.
- (Optional) Select the interval to refresh the report as needed.
Select Go.
Figure 107: Work Order Report By Problem Report
Work Order Report By Root Cause
The Work Order Report By Root Cause can show the Work Order lists with the Work Order, Location, Line Name, Asset, Problem, Problem Category, Root Cause, Root Cause Category and Asset Downtime.
Step 1
- Select a data source.
Step 2
- site
- Cause By
Step 3
- Please select a value from list
- (Optional) Time Range Type
- (Optional) Date Range
- Indicate if you would like to export just the file.
- Select whether or not parameters should be hidden when the report is executed.
- (Optional) Select the interval to refresh the report as needed.
Figure 108: Work Order Report By Root Cause Report
OEE Reports
The OEE Reports are available in MESWeb to include all historical OEE and underlying metrics data available in 42Q.
The following section will go over each available OEE Report, their parameter options, and drill-down features that will help users to go from broader, higher-level information into the details that will help teams troubleshoot and find efficiency-related problems on assets and manufacturing lines.
Downtime Root Cause Analysis Report
The DowntimeRoot Cause Analysis report is the primary OEE Configuration MESWeb Report.
- Drill Down: Users can access the corresponding Downtime Problem and Downtime Root Cause Charts through this report.
- Chart Type: Downtime Root Cause Analysis displays as a Pie Chart (by default) or Pareto Chart.
- Select Data Source
- Select Site: Select the Plant’s Location.
- Select Date Range in Step 3
Figure 109: Downtime Root Cause Analysis
Parameters for Downtime Root Cause Analysis
- Time Range(Optional): Selecting the Current Shift, Last Hour, Current Day, Last 24 hours.
- Date Range: Select the time span (From/To) for the report using the drop-down calendar.
- Location: (Optional) Select the building, floor, level, etc., etc. Department, Location, or Line
- Production Line: (Optional) Select the manufacturing line
- Asset ID: (Optional) Select the machine to analyze its performance
- Asset Type: (Optional) Select the machine type to analyze
- Project: (Optional) Select the project for analysis
- Asset: (Optional) Select the machine to analyze its performance
- Production PN: (Optional) Select the PN to analyze
Note: PN reports show data about the product being built according to the specified Part Number (PN).
- Production WO: (Optional) Select the Production WO to analyze
Note: Work Order refers to the work order assigned in Oracle, and will show data connected to all activity for the specified Work Order.
- Non Stop: (Optional. Default is checked): Check the box to view data that pertains to machinery problems on lines that are still running (non stop). Uncheck to view only lines which have been shut down due to machinery problems
- Problem Category: (Optional): Select data to display according to a specific Asset Problem Category (e.g. Misalignment, Jammed). Asset Problem Categories are configured in CMMS Asset
- Problem Type: (Optional): Select data to display according to a specific Asset Problem Type (e.g. Damaged Sensor). Asset Problems are configured in CMMS Asset
- Display by: Select the type of Problems to display in the charts. Options include Problem, Problem Type, or Problem Category. Asset Problems are configured in CMMS Asset.
- Root Cause By: Select if you would like the chart to display all Root Causes (Root Cause) or a broader set of data (Root Cause Category).
- Calculate by: Select if you would like the chart to display the number of times the problem occurred (Occurrences) or the time period during which the problem persisted (Duration)
- Chart Type: Select Pareto or Pie Chart
- Top: (Optional) (Default is 5) Select the number of results to display in the chart. (5 - 20)
- Charts to Display: Tell the system to create the type and number of charts to create: Both Problem/Root Cause (will display together), Downtime Problem, or Downtime Root Cause.
- Display Data as: Select the kind of document you want, Web view, Excel, Google sheet, XML, CSV, or Text.
- Parameters: (Checked by default) Uncheck to see parameters displayed next to the report.
- Refresh Rate: (Do not Refresh is the default) Users can change the refresh rate by minutes up to one hour.
Figure 110: Downtime Root Cause and Downtime Problem Pie Chart
Figure 111: Downtime Root Cause and Downtime Problem Pareto Chart
Drill down
Drill Down: Users can access the corresponding Downtime Trend and Frequency Report and the Work Order Report by Problem within this report.
To view each report in detail and its corresponding work orders:
Double-click on the desired section of the pie chart or data point on the Pareto chart. The system will prompt the user to select one of the following:
- Downtime Trend and Frequency Report
- Work Order Report by Problem
Figure 112: System Prompt: Select Report for Drilldown
Double click on the desired report. The next two figures show each report in a close-up view.
Figure 113: Drill down Downtime Problem Trend and Frequency Report
Figure 114: Work Order By Problem Report Drilldown
To view the Work Order, copy the W/O # and search in Production > CMMS Work Order.
Downtime Trend Analysis Report
The Downtime Trend Analysis report is the primary OEE Configuration MESWeb Report.
- Drill Down: Users can access the corresponding Downtime Problem and Downtime Root Cause Charts through this report.
- Drill Down: Users can access the corresponding Downtime Trend and Frequency Report and the Work Order Report by Problem within this report.
- Chart Type: Downtime Root Cause Analysis displays as a Pie Chart (by default) or Pareto Chart.
Step 1
- Select a data source
Step 2
- Select a plant site
Step 3
- (Optional) Filter data by a date range.
- Select how the graphic is going to show the date format.
- Select display by.
- Select KPI.
Step 4
- (Optional) Enter a production PN.
- (Optional) Enter a production WO.
- Select if including non stop.
- (Optional) Select a location
- (Optional) Select a production line
- (Optional) Select an asset
- (Optional) Select a asset type
- (Optional) Select a WO project
- (Optional) Select a problem category
- (Optional) Select a problem type
Step 5
- (Optional) Select a problem
- Indicate if you would like to export just the file.
- Select whether or not parameters should be hidden when the report is executed.
- (Optional) Select the interval to refresh the report as needed.
Select Go.
Figure 115: Downtime Trend Analysis Report
Drill Down
Drill Down: Users can access the corresponding Downtime Trend and Frequency Report and the Work Order Report by Problem within this report.
To view each report in detail and its corresponding work orders: Double-click on the desired section of the pie chart or data point on the Pareto chart. The system will prompt the user to select one of the following:
- Downtime Trend and Frequency Report
- Work Order Report by Problem
Energy Consumption by Product
The Energy Consumption By Product Report allows users to display the data by product.
Chart Type: Data displays in Pareto Charts.
- Select Data Source.
- Select Site.
- Select Next.
- Select Parameters in Step 3
- (Optional) Asset ID (Asset Name)
- (Optional) Line Name
- (Optional)Part Number
- Sensor Type: Power, Gas, Water.
- Start Time
- End Time
- Indicate if you would like to export just the file.
- Select whether or not parameters should be hidden when the report is executed.
- (Optional) Select the interval to refresh the report as needed.
Figure 116: Energy Consumption by Product- Data source

Figure 117: Energy Consumption by Product Report
Energy Consumption by Shop Order
The Energy Consumption By Shop Order Report allows users to display the data by shop order.
Chart Type: Data displays in Pareto Charts.
- Select Data Source.
- Select Site.
- Select Next.
- Select Parameters in Step 3
- (Optional) Asset ID (Asset Name)
- (Optional) Line Name
- (Optional) Shop Order
- Sensor Type: Power, Gas, Water.
- Start Time
- End Time
- Indicate if you would like to export just the file.
- Select whether or not parameters should be hidden when the report is executed.
- (Optional) Select the interval to refresh the report as needed.
Figure 118: Energy Consumption by Shop Order - Data source

Figure 119: Energy Consumption by Shop Order Report
Historical Energy Consumption
The Historical Energy Consumption Report allows users to display historical data by product.
Chart Type: Data displays in Pareto Charts.
- Select Data Source.
- Select Site.
- Select Next.
- Select Parameters in Step 3
- (Optional)Asset ID (Asset Name)
- (Optional) Line Name
- (Optional) Location Name
- (Optional) Shop Order
- (Optional) Part Number
- Sensor Type: Power, Gas, Water.
- Start Time
- End Time
- Indicate if you would like to export just the file.
- Select whether or not parameters should be hidden when the report is executed.
- (Optional) Select the interval to refresh the report as needed.
Figure 120: Historical Energy Consumption - Data source

Figure 121: Historical Energy Consumption Report
MTBF And MTTR Report
The MTBF & MTTR are the KPIs for the asset (both CMMS & OEE Configuration system.
Use Case
- The product manager views the MTBF & MTTR reports in the monthly machine downtime review meeting.
- The product manager determines that all or some of the machine MTBF is out of the expected range.
- The repair team needs to look at those lower MTFB hour machine OEE Configuration downtime records and drill down into the root cause of why those machines break quite often. This aims at increasing the production uptime. It might be caused by expired regular maintenance/service etc.
- The product manager finds out the overall or MTTR value is longer than the expected recovery time.
- The repair team needs to go through the longest MTTR value machine to figure out why the repair time is too long. The repair team needs to identify the root cause, then they will be able to repair the same issue in the shortest time to increase production uptime.
MTBF and MTTR Fields
The Mean Time Between Failures (MTBF) and Mean Time To Repair (MTTR) Reports provide a more detailed view of asset activity, specifically regarding asset failure and repair.
- Drill Down: Users can access the corresponding Downtime Problem Chart, as well as corresponding individual problem, reports through this report.
- Chart Type: MTBF and MTTR Report display in Report format.
- Select Data Source in Step 1.
- Select Parameters in Step 2.
- Site: Select the Plant’s Location.
- Location: (Optional) Select the building, floor, level, etc., etc. Department, Location, or Line.
- Asset Type: (Optional) Select the machine (Asset) type to analyze.
- Asset: (Optional) Select the machine to analyze its performance.
- Date Range: Select the time period for the report using the drop-down calendar.
- Parameters: (Checked by default) Uncheck to see parameters displayed next to the report.
- Refresh Rate: (Do not Refresh is default) Users can change the refresh rate by minutes up to one hour.
Figure 122: MTBF and MTTR Report
Drill Downs: MTBF and MTTR Reports
To see the detailed report for each MTBF And MTTR Report, double click on the Asset ID name.
- The Downtime Problem Analysis Chart displays.
Figure 123: MTBF and MTTR Report Drill Down Downtime Problem Analysis Chart
- Double click on the section of the pie to select reports specific to that problem.
- Downtime Trend and Frequency Report
- Work Order Report by Problem
- Select the desired report. See Drill Downs: Root Cause Analysis Reports to see how the reports and prompts appear in the system.
MTBF And MTTR Trend Report
The MTBF and MTTR Trend Report shows machine failure and repair averages over time.
Drill Down
Users can access the corresponding Downtime Problem and Downtime Root Cause Charts, as well as a corresponding individual problem, reports through this report. Chart Type: MTBF and MTTR Trend Report displays as a Pareto Chart format.
- Select Data Source. and Next.
- Select Site: Select the Plant’s Location.
Parameters for MTBF And MTTR Trend Report
- Select Parameters in Step 3.
- Location: (Optional) Select the building, floor, level, etc., etc. Department, Location, or Line.
- Asset Type: (Optional) Select the machine (Asset) type to analyze.
- Asset: (Optional) Select the machine to analyze its performance.
- Date Range: Select the time period for the report using the drop-down calendar.
- Date Type: View by Day, Week, or Month (Week is Default).
- Parameters: (Checked by default) Uncheck to see parameters displayed next to the report.
- Refresh Rate: (Do not Refresh is default) Users can change the refresh rate by minutes up to one hour.
Figure 124: MTBF and MTTR Trend Report
Drill Downs: MTBF and MTTR Trend Reports
To view each MTBF And MTTR Trend Report and their corresponding Work Orders, double-click on the desired data point on the Pareto Chart. The Downtime Problem Analysis and Downtime Root Cause Analysis Charts are displayed.
Figure 125: Drill down for MTBF and MTTR Trend Reports
- Double-click on the section of the pie to select reports specific to that problem and its corresponding Work Order:
- Downtime Trend and Frequency Report
- Work Order Report by Problem
- Select the desired report. See Drill Downs: Root Cause Analysis Reports to see how the reports and prompts appear in the system.
OEE Dashboard
The OEE Dashboard Report allows users to display historical data in a similar fashion that the 42Q Operations Dashboard OEE Widget would.
- Drill Down Reports: Users can access the corresponding Downtime Problem and Downtime Root Cause Charts, as well as corresponding individual reports through this report.
- Chart Type: Data displays in Gauge meters with a target range of colors noted as critical (red), cautionary (yellow), or performing as expected (green). Gauge meters follow the same configuration rules set for 42Q Live in Target Maintenance. See Setting Target UPHs for configuration steps.
- Select Data Source
- Select Next
- Select Date Range
- Select Parameters in Step 2
Site: Select the Plant’s location
Group by: Select Department, Location, or Line
Time Range Type (Optional): Select Last hour, Last 24 hours, Current day, or Current shift
Date Range: Select the time period for the report using the drop-down calendar
Display By: (Optional) Select OEE, TEEP, or OEE & TEEP
Order By: (Optional) Select ASC, DESC
Parameters: (Checked by default) Uncheck to see parameters displayed next to the report
Refresh Rate: (Do not Refresh is the default) Users can change the refresh rate by minutes up to one hour:
- Do not refresh(by default)
- 1 -5 minutes
- 10 minutes
- 15 minutes
- 30 minutes
- 60 minutes
Note: Users can view all production lines simultaneously on a single screen, or select a single production line or machine.
Figure 126: OEE Dashboard Report
Drill Downs: OEE By Asset
To see the corresponding OEE by asset Charts:
- Select the OEE value in the center of the gauge.
- The OEE by Asset chart will show.
Figure 127: OEE by Asset
Calculation: Parallel/Serie.
- Parallel: The Line OEE value will show the OEE average value of all the assets.
- Serial: The Line OEE value will show the OEE asset with the less OEE belonging to the line selected.
Select the desired report. See Drill Downs: Root Cause Analysis Reports to see how the reports and prompts appear in the system.
Note: Please make sure to first configure the location, department, and production line, before viewing the reports.
Drill Downs: OEE Performance By Asset
To see the corresponding OEE Performance by asset Charts:
- Select the OEE value in the center of the gauge.
Figure 128: First Drill Down
- The OEE Performance by Asset chart will show
Figure 129: OEE Performance by Asset
Calculation: Parallel/Serie.
- Parallel: The Line OEE value will show the OEE average value of all the assets.
- Serial: The Line OEE value will show the OEE asset with the less OEE belonging to the line selected.
Select the desired report. See Drill Downs: Root Cause Analysis Reports to see how the reports and prompts appear in the system.
Note: Please make sure to first configure: Location, department, and production line, before viewing the reports.
OEE Report
The OEE Report is a linear report that includes the OEE metric (A, P, Q) for each asset by production line over time, according to Asset.
- Drill Down: Users can access the correspondingDowntime Problem and Downtime Root Cause Charts, as well as a corresponding individual problem, reports through this report.
Other Drill Down Reports available include:
- OEE Availability Drill Down
- OEE Performance Detail Drill Down
- OEE Quality Detail Drill Down
- Production Time
- Scheduled Downtime
- Unscheduled Downtime
- Chart Type: The OEE Report is displayed in a linear Report style format.
- Select Data Source
- Select Site: Select the Plant’s Location
Parameters for OEE Report
- Select Parameters in Step 3
- Line Name: (Optional) Select the manufacturing line
- Asset ID (Asset Name): (Optional) Select the name of the Asset to analyze
- Date Range:
-
- From: Selects the time period for the report using the drop-down calendar
-
- To: Select the time period for the report using the drop-down calendar
- Group By: Select the option to group by Month, Week, Shift, or Day
- Display Data as: Selects the view options of the file
- Parameters: (Checked by default) Uncheck to see parameters displayed next to the report.
- Refresh Rate: (Do not Refresh is the default) Users can change the refresh rate by minutes up to one hour.
Figure 130: OEE Report
To see the OEE Availability report for each OEE Configuration Report, click on the Availability name.
Figure 131: OEE Availability
OEE Trend Chart Report
The OEE Configuration Trend Chart shows historical data to coincide with live time OEE Configuration reports defined in Operations Dashboard.
Drill Down: Users can access the corresponding Downtime Problem and Downtime Root Cause Charts, as well as corresponding individual reports through this report.
Chart Type: Data displays in Pareto Charts.
- Select Data Source
- Select Site
- Select Next
- Select Parameter in Step 3
- Line: (Optional) Select the manufacturing line
- Asset: (Optional) Select the machine to analyze its performance
- Date Range: Select the time period for the report using the drop-down calendar
- Display By: Select Day, Week, or Month (Month is Default)
- Parameters: (Checked by default) Uncheck to see parameters displayed next to the report
- Refresh Rate: (Do not Refresh is the default) Users can change the refresh rate by minutes up to one hour
Figure 132: OEE Trend Chart
Drill Downs: OEE Configuration Trend Chart
To see the corresponding Downtime Problem Analysis and Root Cause Analysis Charts:
- Select the data point on the OEE Configuration Trend Chart. The charts will display.
- Double click on the section of the pie to select reports specific to that problem and corresponding Work Orders.
Figure 133: First Drill Down for OEE Configuration Trend Chart
- Downtime Trend and Frequency Report
- Work Order Report by Problem
Figure 134: Second Drilldown: OEE Configuration Trend Chart
Select the desired report.
OEE Asset Status
The OEE Asset Status report can show the different asset statuses Running, Spare, In Maintenance, Unscheduled Down, Scheduled Down, Setup, Idle, and Calibration.
Drill Down: Users can access the corresponding Downtime Problem and Downtime Root Cause Charts, as well as corresponding individual reports through this report.
Chart Type: Data displays in Pareto Charts.
- Select Data Source
- Select Site
- Select Next
- Select Parameters in Step 3
- Location: (Optional) Select the location
- Or Line: (Optional) Select the manufacturing line
- Or Asset: (Optional) Select the machine to analyze its performance.
- Date Range: Select the time period for the report using the drop-down calendar.
- Parameters: (Checked by default) Uncheck to see parameters displayed next to the report.
- Refresh Rate: (Do not Refresh is the default) Users can change the refresh rate by minutes up to one hour.
Figure 135: OEE Asset Status
Drill Downs: OEE Asset Status Problem and Trend Chart
To see the corresponding Asset Status Problem Analysis:
- Select the data point on the OEE Asset Status Problem Chart. The charts will display.
Figure 136: OEE Asset Status trill down
Figure 137: First Drill Down for OEE Asset Status Problem Chart
- Select the data point on the OEE Asset Status Trend Chart. The charts will display.
Figure 138: Second Drilldown: OEE Asset Status Trend Chart
System Connectivity Chart
Figure 139: Connectivity Chart
Drill Downs OEE Configuration Dashboard
To see the corresponding Downtime Problem Analysis and Root Cause Analysis Charts:
- Select the OEE Configuration value in the center of the gauge.
- The Charts will display:
Figure 140: Drill down for OEE Configuration Reports
- Double-click on the section of the pie to select reports specific to that problem and to view corresponding Work Orders.
- Downtime Trend and Frequency Report
- Work Order Report by Problem
- Select the desired report. See Drill Downs: Root Cause Analysis Reports to see how the reports and prompts appear in the system.
Note: Please make sure to first configure the location, department, and production line, before viewing the reports.
Products Without Throughput Per Hour Targets
The Products Without Throughput Per Hour Targets Report can show the products list with the Asset Name, Part Number, Family ID, WorkStation, Process Name and Mfg Line.
Step 1
- Select a data source.
Step 2
- (Optional) Select one or more customers.
Step 3
- (Optional) Select one or more products.
- (Optional) Select one or more families.
Step 4
- (Optional) Select one or more locations.
- (Optional) Select one or more processes.
- (Optional) Select one or more Mfg Lines
- Show only mapped locations
- Select date range
- Indicate if you would like to export just the file.
- Select whether or not parameters should be hidden when the report is executed.
- (Optional) Select the interval to refresh the report as needed.
Select Go
Figure 141: Products Without Throughput Per Hour Targets Report
Report OEE by Product or Product Family
The Report OEE by Product or Product Family provides information concerning the view of Asset IDs, Asset names, Line Names, Product and Product Family, OEE, and more.
- Select Data Source in section Step 1.
- Select Site.
- Select Parameters, for the given outcome:
- Line Name
- Asset ID
- Product
- Product Family
- Date Range
- Click “Go”.
Figure 142: Report OEE by Product or Product Family
Report OEE by Shop Order
Users have the ability to view the details of the report of OEE by Shop Order and the surrounding information for specific Asset ID’s.
- Select Data Source in section Step 1.
- Select Site.
- Select Parameters, for the given outcome :
- Line Name
- Asset ID
- Shop Order
- Date Range
- Click “Go”.
Figure 143: Report OEE by Shop Order
PTSR Reports
The PTSR Reports provide users with a list of reports for the part traceability system.
To access this report navigate to Reporting > MESWeb > PTSR Reports.
Board in Production
The Board in Production report can be used to display information about materials from scanned boards that are in production in a select line.To view the report:
Navigate to Reporting > MESWeb > PTSR Report > Board in Production
Select aData Source from the drop down list
Select a'Production line from the Production Line drop-down box. Alternatively, users may search by entering the barcode into the Search Barcode field.
Enter a date range by which to filter the search results, and selectGo to generate the report.The report results are displayed.
Note: If required, define the Start Date and the Stop Date for limited protection history boards.
Figure 144: Board in Production
Board History Report
The Board History report can be used to view information regarding all the workstations that are associated with a given board barcode. To view the report:
- To view the report, navigate to the Board History Report main page: Reporting > MESWeb > PTSR Report > Board History Report
- Select a Data Source from the dropdown list
- Enter aboard barcode into the Input Board Barcode field.
- SelectGo to generate the report.The required information is displayed.
Figure 145: Board History Report
Break Panel Query
The Break Panel Query report can be used to view when a material or a component is consumed.
To view the report,
- Navigate toReporting > MESWeb > PTSR Report > Break Panel Query
- Select the Data Source. The Panel Barcode, Work Order, Break Date Start, and Break Date End are optional in order to generate the results
- Select theGo button. The results are displayed.
Figure 146: Break Panel Query
Replace Barcode Report
The Replace Barcode report can be used to view the replacement history of barcodes, including replacing time, original barcode, new barcode, workstation, production line, and the position of the person who replaced the barcode.
To view the report, navigate to the Replace Barcode Report in the MES Portal:Reporting > MESWeb > PTSR Report > Replace Barcode Report
- Select an option for searching results using the Search by the drop-down box. Options include Original Barcode and New Barcode.
- Enter the corresponding barcode information into the field adjacent to the Search by the drop-down box. Enter the Start Date and the Stop Date to further filter the search results.
- Select the Search icon. The search results are displayed.
- View the Barcode History report for a given result, select on the name of the new barcode (in blue) for the respective result.
Figure 147: Replace Barcode Report
Barcode Information
The Barcode Information Report can show the barcode in detail with the Barcode, Part number, date code, create date, total qty, current qty, incoming number, manufacturer name, MSD lever, Orientation, thickness, and other associated information. Chart Type: Data displays in Pareto Charts.
- Select Data Source in Step 1.
- Select Next.
- Enter Date Code in Step 2.
- Select Next.
- Select Parameters in Step 3.
- Component Barcode (Optional)
- Incoming Number (Optional)
- Part Number (Optional)
- Indicate if users would like to export just the file.
- Select whether or not parameters should be hidden when the report is executed.
- Select the interval to refresh the report as needed (Optional) .
Figure 148: Barcode Information Report
Boards In Model
The Board in Model report can be used to display information about serials that have been scanned with a selected BOM P/N, Boards S/N barcode, first scan time, and last scan time. The date range to display scan time should be maximum of 90 days. If the date range selected exceeds 90 days, the user receives an error prompt.
Chart Type: Data displays in Pareto Charts.
- Select Data Source in Step 1.
- Select Next.
- Select Parameters in Step 2.
- BOM P/N
- Scan Time (Maximum 90 days)
- Indicate if users would like to export just the file.
- Select whether or not parameters should be hidden when the report is executed.
- Select the interval to refresh the report as needed (Optional).
Boards In Work Order
The Boards In Work Order Report can show the boards information for one Work Order with the WO Number, Board barcode, First scan time, Last scan time. Chart Type: Data displays in Pareto Charts.
- Select Data Source in Step 1.
- Select Next.
- Select Parameters in Step 2.
- Work Order
- Scan Time (Optional)
- Indicate if users would like to export just the file.
- Select whether or not parameters should be hidden when the report is executed.
- Select the interval to refresh the report as needed (Optional) .
Figure 150: Board In Work Order
Fujitrax - Operator Trace Log
The Fujitrax Operator Trace Log can show the logs of the Fujitrax operation with the Time, System, Operator, Operator action, Result, and other associated information. Chart Type: Data displays in Pareto Charts.
- Select Data Source in Step 1.
- Select Next.
- Select Parameters in Step 2.
- Log Time period (Optional)
- Component Barcode (Optional)
- Previous Component Barcode (Optional)
- Date Code (Optional)
- Machine (Optional)
- Part Number (Optional)
- Indicate if users would like to export just the file.
- Select whether or not parameters should be hidden when the report is executed.
- Select the interval to refresh the report as needed (Optional).
Figure 151: Fujitrax - Operator Trace Log
Load Material Initial Quantity Report
The Load Material Initial Quantity Report can show the initial quantity of the material when it was loaded to the workstation.
Chart Type: Data displays in Pareto Charts.
- Select Data Source in Step 1.
- Select Next.
- Select Parameters in Step 2.
- Barcode
- Indicate if users would like to export just the file.
- Select whether or not parameters should be hidden when the report is executed.
- Select the interval to refresh the report as needed (Optional).
Figure 152: Load Material Initial Quantity Report
Material on Board
The Material on Board can show all the materials information that was loaded to the board.
Chart Type: Data displays in Pareto Charts.
- Select Data Source in Step 1.
- Select Next.
- Select Parameters in Step 2.
- Source (Optional).
- Board barcode.
- Indicate if users would like to export just the file.
- Select whether or not the parameters should be hidden when the report is executed.
- Select the interval to refresh the report as needed (Optional).
Figure 153: Material on Board
Material on Board by Batch
The Material on Board by Batch can show all the materials information that was loaded to the boards, users can input more than one board barcode.
Chart Type: Data displays in Pareto Charts.
- SelectData Source in Step 1.
- Select Next.
- Select Parameters in Step 2.
- Source (Optional).
- Board Serial No.
- Indicate if users would like to export just the file.
- Select whether or not the parameters should be hidden when the report is executed.
- Select the interval to refresh the report as needed (Optional) .
Figure 154: Material on Board by Batch
Material Report
The Material Report can show the material information in detail with Create date, barcode, RT No., MSD level, Manufacturer, current quantity, Date code, expiration date, when used.
Chart Type: Data displays in Pareto Charts.
- Select Data Source in Step 1.
- Select Next.
- Select Parameters in Step 2.
- Material barcode(Optional) .
- Material Part Number(Optional) .
- Lot Code(Optional) .
- Date Code(Optional) .
- Incoming Number(Optional) .
- Manufacturer Part Number(Optional) .
- Manufacturer Name(Optional) .
- Created Date(Optional)
- Expire Date(Optional) .
- Indicate if users would like to export just the file.
- Select whether or not the parameters should be hidden when the report is executed.
- Select the interval to refresh the report as needed (Optional).
Figure 155: Material Report
Material Where Used
The Material Where Used Report can show the scanned board number, production line, and other information where the material used.
Chart Type: Data displays in Pareto Charts.
- Select Data Source in Step 1.
- Select Next.
- Select Parameters in Step 2.
- Component barcode.
- Date Range
- Indicate if users would like to export just the file.
- Select whether or not the parameters should be hidden when the report is executed.
- Select the interval to refresh the report as needed (Optional).
Figure 156: Material Where Used
Receipt Traveler Report
The Receipt Traveler Report can show the receipt traveler information in detail with the receiving date, receiving number, Lot code, Date code, Part number, Quantity, company name, and Manufacturer.
Chart Type: Data displays in Pareto Charts.
- Select Data Source in Step 1.
- Select Next.
- Select Parameters in Step 2.
- Incoming Number(Optional).
- Created Date
- Indicate if users would like to export just the file.
- Select whether or not the parameters should be hidden when the report is executed.
- Select the interval to refresh the report as needed (Optional).
Figure 157: Receipt Traveler Report
SOMS Reports
The SOMS Global Status Report is designed to start with a high-level overview of a plant's current operating status. The user can see the current number of units that are in the WIP, the yield for the current and previous days, and the throughput for the current and previous days for each of the plant's levels. Users also have the ability to drill down into a single level to see the same information broken out by line and process. The report is designed to give a quick snapshot of the health of a plant operation.
Follow the steps below to generate a SOMS Report:
1. Select a Data Source
2. (Optional) Enter the Mfg Line Name
3. (Optional) Enter the Scanner ID
4. (Optional) Enter the Multi-Pass Location Name
5. Select whether or not parameters should be hidden when the report is executed
6. (Optional) Select the interval to refresh the report as needed
Figure 158: SOMS Setup
Glossary
- Availability: An OEE Configuration variable that depicts an asset’s uptime/downtime. Any stoppage (breaks, lunches, waiting for parts, malfunction, setup, emergencies) is part of this calculation; plants must account for all stoppages, even if they are planned.
- Level: The building, floor, or plant on which the dashboard is displayed.
- Layers: The data that is displayed on the 42Q Live Monocle Dashboard. 42Q offers 3 layers:
- The Machine layer displays cycle time status (green - asset is performing at expected levels; yellow - asset is performing below optimal levels and requires attention; red - asset is performing severely below level, and may be stopped.) Machine status is determined by comparing scanning activity (throughput and cycle time) during a set period of time to target yield values predefined in target maintenance.
- TP/Yield layer (also referred to throughout this document as the MES 101 layer) shows throughput and yield values for the selected level, and the current status of each production line (ok, acknowledged, on hold, critical, and idle).
Note: The MES 101 and Machine target values are defined in the Target Maintenance portal, using the soms_target table.
- The OEE Configuration layer shows OEE Configuration statistics for the specific asset; OEE Configuration layers are color-coded according to predefined target ranges (red = levels are below defined OEE Configuration target values; yellow = approaching cautionary values; green = within acceptable OEE Configuration values).
Note: OEE Configuration target values are defined in the Target Maintenance portal, using the OEE Configuration_target_ table.
- MTBF: Mean time between failures (MTBF) is the predicted elapsed time between inherent failures of a system during operation.
- MTTR: Mean time to failure (MTTF), measures the average time between failures.
- OEE Configuration: Overall Equipment Effectiveness. OEE Configuration factors together three variables (A, P, and Q (see below), to calculate a value that depicts an asset’s speed (how fast the asset produces), quality (good vs. bad products), and consistency (downtimes).
- Performance: An OEE Configuration variable that depicts how fast an asset is produced.
- Quality: An OEE Configuration variable that depicts the number of good products divided by the number of bad products. Good Units produced as a percentage of the Total Units Started. It is commonly referred to as the first pass yield (FPY).
- Snapshots: Dashboard “pictures” that capture a common scenario on an individual factory floor. Users create snapshots to show asset status for information pertinent to their plants. For example, a user might want to compare Availability values for three different customers that use Fuji machinery. This user would create a snapshot showing downtimes for each line with Fuji equipment running per customer. This user could create another set of snapshots to show the target yield for their Fuji production lines and can configure each snapshot to run daily, weekly, etc. When customers visit, plant admins can quickly share Fuji line status, by accessing the configured snapshots.
- Target Maintenance: 42Q Portal where users configure target parameters for their unique plant requirements, upon which 42Q Live reports display.
- Target Yield: The ideal yield for a given asset, against which the actual yields are measured; critical status is displayed based on the comparison of target yield and actual yield.
- TEEP: A calculation that measures OEE Configuration against total available production time.
- Widgets: Individual Graphic User Interfaces for 42Q Live. Widgets allow users to quickly set up dashboards and bypass complicated coding, to view live-time productivity on their shop floors.


