Difference between revisions of "How to create CPK/PPK charts"
| Line 1: | Line 1: | ||
| − | = <span class="mw-headline" id="Summary"><span class="mw-headline" id="Summary"><span class="mw-headline" id="Summary"><span class="mw-headline" id="Summary"><span class="mw-headline" id="Summary">Summary</span></span></span></span></span> = | + | = <span class="mw-headline" id="Summary"><span class="mw-headline" id="Summary"><span class="mw-headline" id="Summary"><span class="mw-headline" id="Summary"><span class="mw-headline" id="Summary"><span class="mw-headline" id="Summary">Summary</span></span></span></span></span></span> = |
This How-To Create CPK/PPK Charts document will teach users how to '''create''' a new monitor as well as '''set up''' a '''Data Strategy Collection''', '''Standard Control Chart''', '''Available Charts''', and '''Actions''', applied to the new monitor. | This How-To Create CPK/PPK Charts document will teach users how to '''create''' a new monitor as well as '''set up''' a '''Data Strategy Collection''', '''Standard Control Chart''', '''Available Charts''', and '''Actions''', applied to the new monitor. | ||
| Line 19: | Line 19: | ||
| | ||
| − | = <span class="mw-headline" id="How_to_create_a_new_monitor_with_a_CPK.2FPPK_chart"><span class="mw-headline" id="How_to_create_a_new_monitor_with_a_CPK.2FPPK_chart"><span class="mw-headline" id="How_to_create_a_new_monitor_with_a_CPK.2FPPK_chart"><span class="mw-headline" id="How_to_create_a_new_monitor_with_a_CPK.2FPPK_chart">How to create a new monitor with a CPK/PPK chart</span></span></span></span> = | + | = <span class="mw-headline" id="How_to_create_a_new_monitor_with_a_CPK.2FPPK_chart"><span class="mw-headline" id="How_to_create_a_new_monitor_with_a_CPK.2FPPK_chart"><span class="mw-headline" id="How_to_create_a_new_monitor_with_a_CPK.2FPPK_chart"><span class="mw-headline" id="How_to_create_a_new_monitor_with_a_CPK.2FPPK_chart"><span class="mw-headline" id="How_to_create_a_new_monitor_with_a_CPK.2FPPK_chart">How to create a new monitor with a CPK/PPK chart</span></span></span></span></span> = |
SPC monitors should be created under an existing monitor group. To create a monitor, users must follow the following steps listed below: | SPC monitors should be created under an existing monitor group. To create a monitor, users must follow the following steps listed below: | ||
| Line 42: | Line 42: | ||
'''Figure 2: SPC Function List Page''' | '''Figure 2: SPC Function List Page''' | ||
| − | [[File:SPC Function List Page.png|700px]] | + | [[File:SPC Function List Page.png|700px|SPC Function List Page.png]] |
| | ||
| Line 53: | Line 53: | ||
'''Figure 3: SPC Monitor List Page''' | '''Figure 3: SPC Monitor List Page''' | ||
| − | [[File:SPC Monitor List Page.png|700px]] | + | [[File:SPC Monitor List Page.png|700px|SPC Monitor List Page.png]] |
| | ||
| − | # | + | |
| − | ''' | + | |
| + | #'''Select Part''' or '''Family ID'''. | ||
| + | #'''Enter''' the '''Part Number''' or '''Family ID''', and then use the arrow to '''add''' or '''delete''' the value. | ||
| + | #'''Select Location''', '''Process''', or '''Location Family'''. | ||
| + | #'''Enter''' the '''Location''', '''Process''', or '''Location Family''', and then use the arrow to add or delete the value. | ||
| + | #'''Select Next''' to go to the next tab. | ||
| + | |||
| + | | ||
| + | |||
| + | '''Figure 4: Monitor Tab''' | ||
| + | |||
| + | '''[[File:Monitor Tab.png|700x700px]]''' | ||
| + | |||
| + | | ||
| + | |||
| + | '''Collect Data From: Enable SPC to collect data from ‘Now’ or from a past date.''' | ||
| − | + | '''Part Number: The part number to be monitored by SPC.''' | |
| − | ''' | ||
| − | + | '''Family ID: The Family ID is to be monitored by SPC.''' | |
| − | ''' | ||
| − | + | '''Location: The location to be monitored by SPC.''' | |
| − | ''' | ||
| − | + | '''Process: The process to be monitored by SPC.''' | |
| − | ''' | ||
| + | '''Location Family: The location family is to be monitored by SPC.''' | ||
| | ||
| − | ''' | + | '''Users can choose from three different options to collect data that will be used to generate a CPK/PPK chart: Auto Collection from Unit, Manual Collection via SPC UI, and Automatic Collection via SPC API.''' |
| + | | ||
| + | * | ||
| + | '''Auto Collection from Unit: This allows the SPC monitor to automatically collect data from the MDS service.''' | ||
| + | |||
| + | * | ||
| + | '''Manual Collection via SPC UI: Use this option if the end-user needs to customize characteristics for their monitor.''' | ||
| + | |||
| + | * | ||
| + | '''Automatic Collection via SPC API: Use this option if the end-user needs to customize characteristics for their monitor. The clients, such as PWB, IIOT can push the data to SPC via its monitor API as long as the characteristics in the parameters of the API endpoint exist and match this monitor, the continuous data control charts (such as X bar-R chart, I-MR chart, and CPK/PPK report) will plot.''' | ||
Revision as of 20:40, 28 February 2022
Summary
This How-To Create CPK/PPK Charts document will teach users how to create a new monitor as well as set up a Data Strategy Collection, Standard Control Chart, Available Charts, and Actions, applied to the new monitor.
SPC (Statistical Process Control) is an industry-standard methodology for measuring and controlling quality during the manufacturing process.
The most notable advantages of using SPC are the following:
- Companies can dramatically reduce variability and scrap.
- Statistically improve productivity.
- Reduce costs.
- Uncover hidden process characteristics.
- Instantly react to process changes.
- Make real-time decisions on the shop floor.
How to create a new monitor with a CPK/PPK chart
SPC monitors should be created under an existing monitor group. To create a monitor, users must follow the following steps listed below:
- From the Monitor Group List page, select a group monitor, and then click the GO icon.
Figure 1: Monitor Group List Page
- From the Function List page, select Monitor Maintenance.
Figure 2: SPC Function List Page
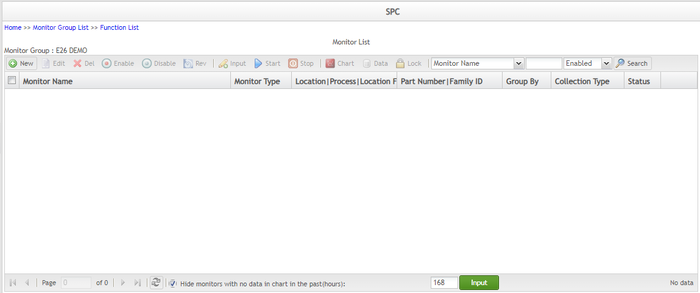
- On the Monitor List page, select New.
Figure 3: SPC Monitor List Page
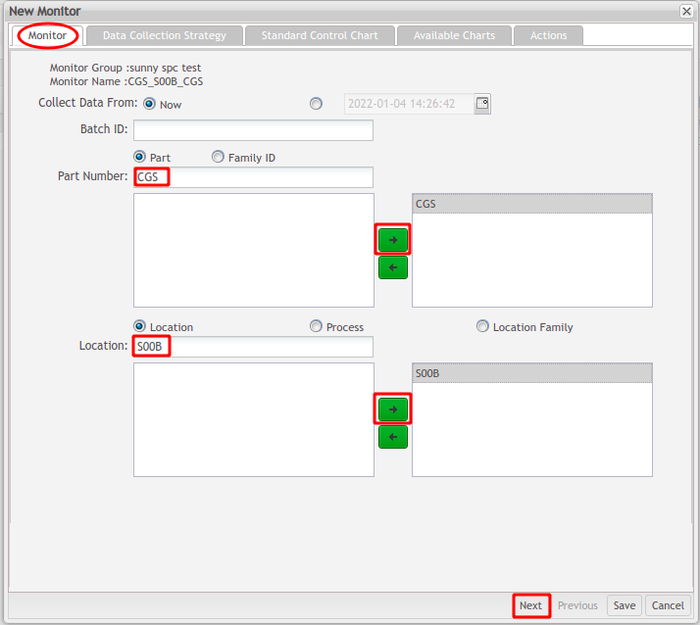
- Select Part or Family ID.
- Enter the Part Number or Family ID, and then use the arrow to add or delete the value.
- Select Location, Process, or Location Family.
- Enter the Location, Process, or Location Family, and then use the arrow to add or delete the value.
- Select Next to go to the next tab.
Figure 4: Monitor Tab
Collect Data From: Enable SPC to collect data from ‘Now’ or from a past date.
Part Number: The part number to be monitored by SPC.
Family ID: The Family ID is to be monitored by SPC.
Location: The location to be monitored by SPC.
Process: The process to be monitored by SPC.
Location Family: The location family is to be monitored by SPC. Users can choose from three different options to collect data that will be used to generate a CPK/PPK chart: Auto Collection from Unit, Manual Collection via SPC UI, and Automatic Collection via SPC API.
Auto Collection from Unit: This allows the SPC monitor to automatically collect data from the MDS service.
Manual Collection via SPC UI: Use this option if the end-user needs to customize characteristics for their monitor.
Automatic Collection via SPC API: Use this option if the end-user needs to customize characteristics for their monitor. The clients, such as PWB, IIOT can push the data to SPC via its monitor API as long as the characteristics in the parameters of the API endpoint exist and match this monitor, the continuous data control charts (such as X bar-R chart, I-MR chart, and CPK/PPK report) will plot.


