SOP-42Q-MES0069 Statistical Process Control
42Q Home > Quality > Statistical Process Control
Contents
- 1 Introduction
- 2 SPC
- 3 Monitor Maintenance
- 3.1 Preparation Work: Associate Part Number With a Route
- 3.2 Create a New Monitor
- 3.3 Monitor Maintenance
- 3.4 Search Monitor
- 3.5 Edit Monitor (Edit Monitor in Batch)
- 3.6 Delete Monitor / Delete Monitor in Batch
- 3.7 Disable, Enable, Delete Monitor
- 3.8 View Monitor History
- 3.9 Manually Input Data to Monitor
- 3.10 Automatic Collection via SPC API
- 3.11 View Control Chart, Data & Write OCAP
- 3.12 Maintain Lock
- 3.13 View Monitor Details
- 4 Email Maintenance
- 5 Lock Maintenance
- 6 Location Family Maintenance
- 7 System Log Maintenance
- 8 SPC System Parameter Maintenance
Introduction
Statistical Process Control (SPC) is an industry-standard methodology for measuring and controlling quality during the manufacturing process. It is a method used for monitoring, controlling, and, ideally, improving a process through statistical analysis.
Based on statistical theories, SPC (Statistical Process Control) is applied to manufacturing and production lines for the purpose of quality control. SPC enables users to continuously monitor, analyze, and control the production process in real-time to reduce possible waste and improve process capability. Key tools used in SPC include control charts, monitor maintenance, email notifications, system configuration, line stoppage, etc. On the client side, the SPC system includes three components: SPC Portlet, SPC TV Portlet, and SPC Dashboard Portlet.
Using the SPC, the Company can Dramatically reduce variability and scrap, statistically improve productivity, reduce costs, uncover hidden process characteristics, instantly react to process changes, and make real-time decisions on the shop floor.
See below the main features of SPC:
- Support BATCH units calculation for Yield and Pareto charts.
- Display Affected Serials for all charts displayed.
- Change chart background color for Out-of-Control conditions.
- Email Notifications are sent to specific recipients for Out-of-Control conditions.
- Ability to export DPMO reports.
- Control on production process route (MFG hold) based on Pareto chart, P chart, NP chart, C chart, U chart, FPY chart, Xbar-R Chart, and I-MR Chart.
- SPC Dashboard displays multiple monitors on TV in real time.
- Support multiple data collection strategies: Automatic Collection data from MDS or MESWeb, Manual Collection data via SPC UI, and Automatic Collection data via SPC API.
SPC also provides some charts that help to see graphically some statistics:
- Attribute Control Charts – Process CONTROL (defects and defective units):
- Monitors Grouping data by Piece: P and NP charts.
- Monitors Grouping data by Defect Points: C and U charts.
- Monitors by BATCH: Yield (pie) and Pareto charts.
- Others: FPY and DPMO (DPMO, DPMO-P, DPMO-A, DPMO-T, DPMO-C) charts.
- Variables Control Charts – Process CAPABILITY control (attribute values)
If the combination of Monitor setup (Part Number + Process/Workstation) has attribute setup on Shop Floor Configuration (Attribute Maintenance) the attribute charts will be displayed on the Monitor Maintenance screen with X-Bar/R chart; I/MR chart; Cpk/Ppk.
To get more information, see the next topics of this document.
Pre Configuration
Server Information
After SPC is deployed to the users' web server, users need to set up a server and configure the server information from the Server Information page.
To access the Server Information page in the MES Portal, navigate to: Administration > Server Information.
Create SPC Server
To create an SPC server:
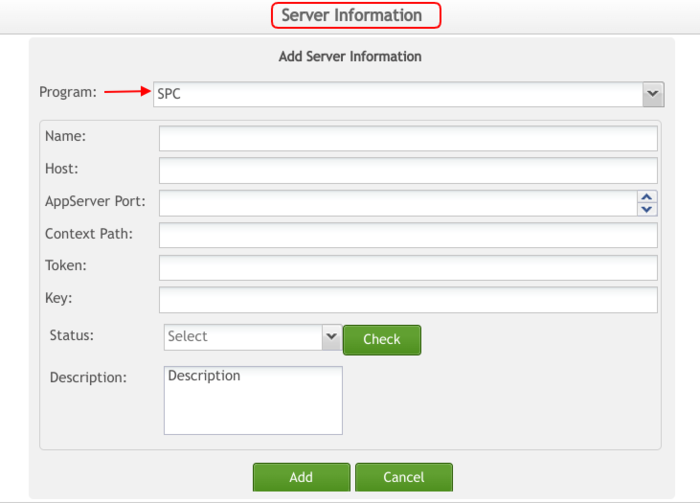
- Select Add from the Server Information page.
- Select SPC from the Program drop-down box.
- Complete all the fields and select Add to save the configuration to the database.
Figure 1: Add SPC Server
Fields, as seen in the above screenshot, are explained in the following:
Name: The name of the SPC server.
Host: The SPC server IP address.
AppServer Port: The port that the SPC server deploys within the Tomcat server.
Context Path: The patch that the SPC server deployed on the Tomcat server. After the system is refactored, the system should have only one program that supports all sites/plants so the context path of server information for each site/plant should be /SPC-server.
Token: Safe Palindrome authentication to call the API. This is used to connect to the services for collecting data via SPC API.
Key: Safe Palindrome authentication to call the API. This is used to connect to the services for collecting data via SPC API.
Status: After you have completed all the fields above, select a status from this drop-down box, and click the check button to verify that the SPC server connection is working.
Note: This configuration can be Edited and or Deleted at any time.
SPC
Monitor Group Maintenance
MES 15 Quality SPC uses the Monitor Group to maintain the SPC monitors that collect data from different sources. However, MES 15 Quality SPC does not actually collect data from SPI, it collects data from the SFDC archive as an associated database schema and support is not fully ready yet. The Dot Line Source was added in Monitor Group Maintenance to support the Dot Line chart, and the difference between the Dot Line chart and other charts is that the user transmits the data to the SPC through an API, and this data has been calculated, and the SPC directly uses the data for display.
View Monitor Group
To view existing monitor groups:
Navigate to: Quality > SPC.
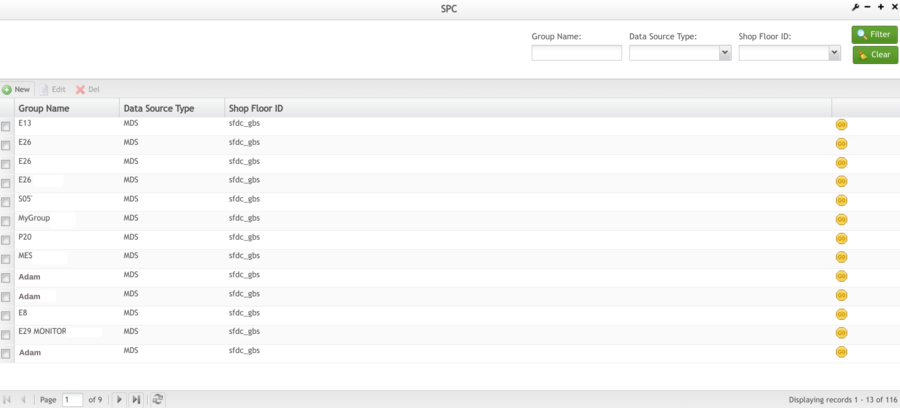
Once an SPC engine has been selected, the existing monitor groups that were created under the selected SPC engine will be displayed on the Monitor Group List page.
Figure 2: Monitor Group List
Create Monitor Group
Every monitor is created under a monitor group. So before creating a monitor, a monitor group must be created first. To create a monitor group:
From the SPC Monitor Group List page, select the ![]() button in the toolbar. SPC opens the Add Monitor Group page.
button in the toolbar. SPC opens the Add Monitor Group page.
- Enter the monitor group name in the Name field.
- Select MDS, SPI, or DotLine Source from the Data Source Type drop-down box.
- If you need to send an MFG Hold to stop the production line, you can enable the Send MFG Hold request to the checkbox.
- Enter a Shop Floor ID, and Description.
Figure 3: New Monitor Group Page-MDS
Note: The SPC program is deployed on the Amazon cloud server (in the USA). Users scan Serial Numbers on their local PC. So there will be a time zone difference between the SPC server and MDS if they are not in the same time zone.
SPC uses the value of this field to calculate the timezone of local MDS, compares it with the Amazon cloud server time zone, calculates the time offset, and determines the right time for the SPC monitor to retrieve data (create time + time offset) so that the scanned SNs data can display on monitor charts.
The time zone is defined in the Plant Maintenance module by the administrator.
Figure 4: New Monitor Group Page - SPI
Figure 5: New Monitor Group Page - DotLine Source
Note: Since some data is manually collected by users, and this kind of data could not be extracted from 42Q, this data has been calculated, and an API was provided to collect the data and present it to users in the Dot Line Chart.
See below some rules to get the DotLine Chart:
- First users need to create a new monitor with the below info specified:
Specify which process parts will be used for this monitor to collect data.
- Select Chart Type: Dot Line.
When the Dot Line Chart is selected, the Application & Data Column is enabled to let users select which Application & Data Column will be used to display this chart.
- Group By: Disabled.
- Interval: Disabled.
- Rules & Actions: Enable.
- Select GO on the new monitor from the Monitor Group List.
Figure 6: Go to New Monitor Group List
- Select NEW
- External Program will periodically pick data from Source Record by a certain frequency, and put it into SPC by publishing it;
API interface
- SPC TV will select Monitor to display.
- Draw Chart: just like the current u/p chart done in SPC.
X-axis: Time collected (Import Datetime), Format: MMDDmm
Y-axis: Data, UCL (Upper Control Limit), LCL( Lower Control Limit), Target
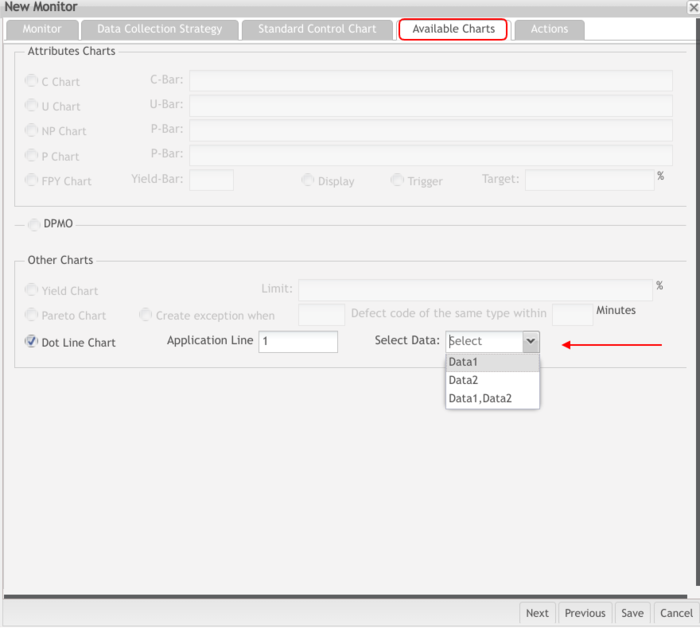
Figure 7: New Monitor DotLine Chart Available Charts Tab
Select Data in the Drop Down List, and select both: Data1 and Data2 at the same time.
Note: Data1 or Data2 can be understood as a group of data. Users can choose to display the two groups of data together in the dot line chart, or just display one group of data.
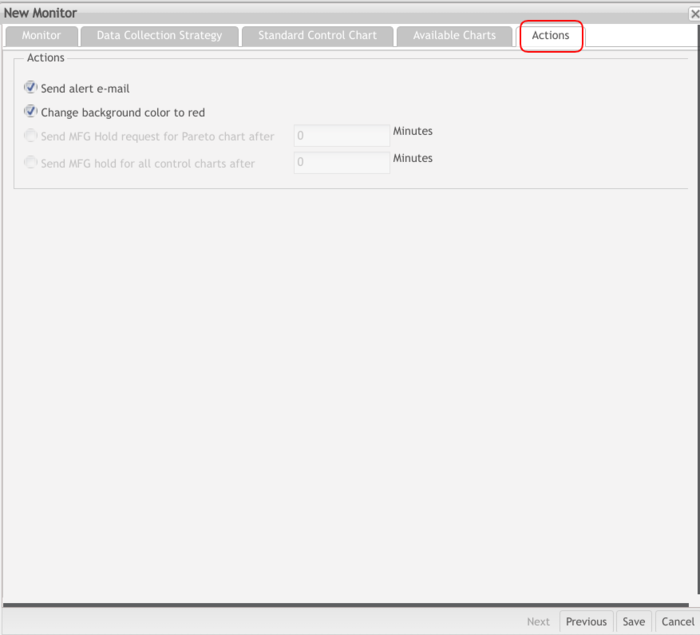
And finally, users can select the following actions:
- Send an alert email: This action sends an alert email to a specific person. Users can specify who would receive these alert emails in the Email Maintenance module.
- Change the background color to red: If the exception was triggered, the background of an associated data record in this monitor will turn red.
Figure 8: New Monitor DotLine Chart Actions Tab
Edit Monitor Group
To edit a monitor group:
- From the Monitor Group List page, check the box of a monitor group that users need to edit, and select Edit. The Edit Monitor Group page will display.
- Edit any field as needed, and select Save to keep the change, or Cancel to abort.
Figure 9: Edit Monitor Group Fields
Filter Monitor Group
Users can easily find the desired monitor group in the Monitor Group List by adding a filter to the SPC Monitor Group List page. A monitor group can be filtered under three conditions. They are,
- Group Name
- Data Source Type
- Shop Floor ID
Figure 10: Filter Monitor Group
Delete Monitor Group
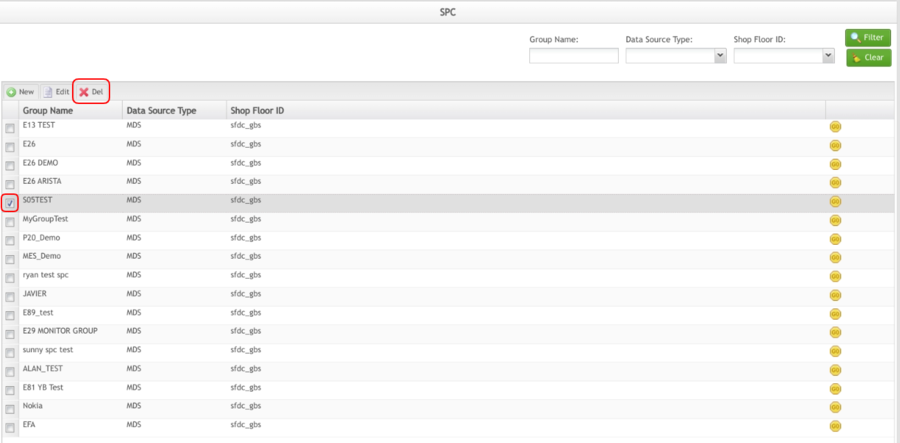
To delete a monitor group:
- From the Monitor Group List page, check the box of the monitor group to be deleted, and click Del.
Figure 11: Delete Monitor Group
Note: It is not allowed to delete the monitor group which contains one or more SPC Monitor.
Monitor Maintenance
SPC portlet provides users with plenty of parameters to maintain SPC monitors. An SPC monitor is a platform for the setup of such processes as object monitoring, data collection strategy, rules, control charts, and actions. With the monitor maintenance function, you can create a new monitor, edit the existing monitor, disable or enable the monitor, show monitor data or control charts, lock the monitor, and so on. So monitoring maintenance is a key function of SPC.
Preparation Work: Associate Part Number With a Route
MES SPC retrieves data from MDS via database view. To make the part number data configured in MDS to be displayed on the SPC monitor creation page, the part number must be manually assigned to a route.
Create Part Number
To create a part number:
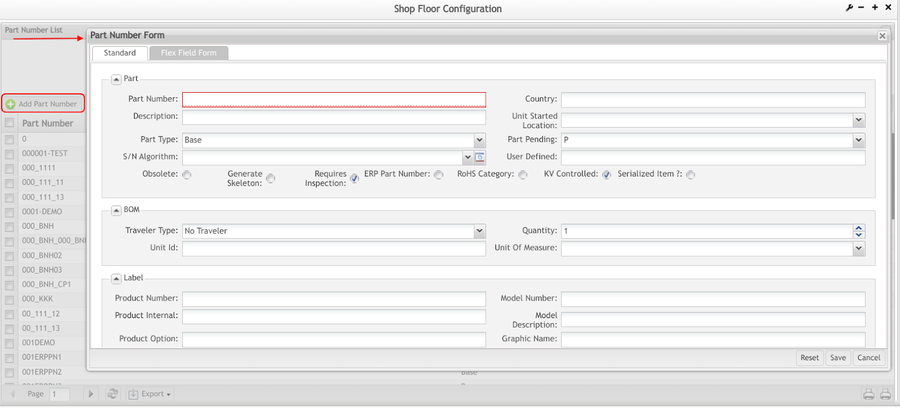
- Navigate to: Shop Floor Control > Configuration > Shop Floor Configuration, and select the Part Number module.
- From the Part Number List page, select Add Part Number to proceed.
- In the Part Number Form float window, input some parameters to create the part number, and click the Save button.
Figure 11: Part Number Form
Associate part number with a route
- From the Shop Floor Configuration portlet, select Product Route to proceed.
- In the List Route window, select the
 icon on the right of the menu bar.
 - In the Part x Route Assignment List undefined window, select Add.
- In the Part x Route Assignment Form undefined float window, select a shop floor ID, input the part number, and select a route.
- Select Save to define the Part and Route assignment.
For more information, please visit Part Number Maintenance SOP.
Create a New Monitor
SPC monitors should be created under an existing monitor group.
Users are able to set up monitors one by one part number for different production lines for one location/process, so there are too many monitors to be maintained, causing a workload for them to maintain these monitors in 42Q SPC. From one plant estimate, there are about 30,000 monitors to be created to support 42Q SPCs rolling out to the whole plant.
To solve this workload, users are able to do the following operations:
- Create Monitors in Batch
- Support creates multi-part numbers/Family ID with one location/process/location family or multi-location/process/location family with one part numbers/Family id.
- Allow users to export all the related attributes when creating a monitor.
- If selected part numbers have attributes, the attribute selection box in the new monitor>Data Collection Strategy page will only allow the common attributes.
- To create monitors in batch, users should fill in a batch ID. This batch ID will help users to do the operation of search or edit monitors.
- Edit Monitors in Batch
- Delete Monitors in Batch
Figure 13: Monitor Group List Page: Go
- From the Function List page, select the Monitor Maintenance Icon
Figure 14: Monitor Group List
Monitor Maintenance 
The user now enters the New Monitor form. This page provides all parameters to set up a customized single monitor or monitors in batch in SPC.
The user needs to fill in the necessary information in the available tabs to create monitors. See step by step in the next topic.
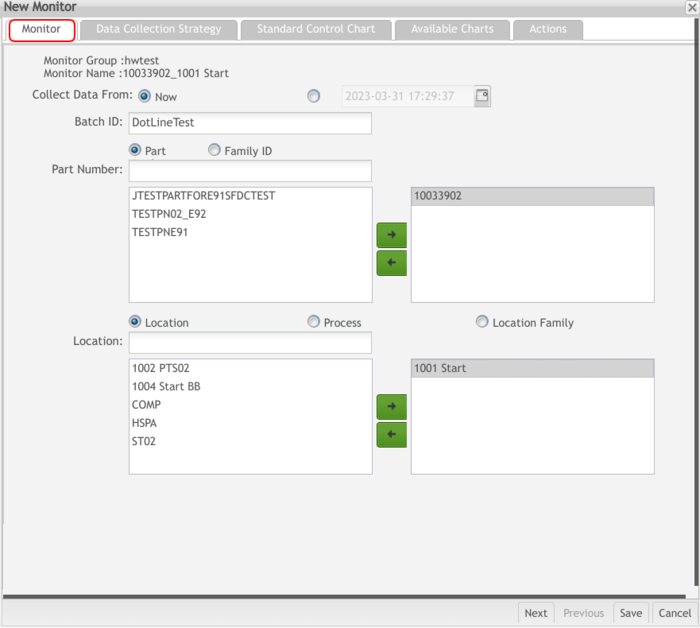
Monitor
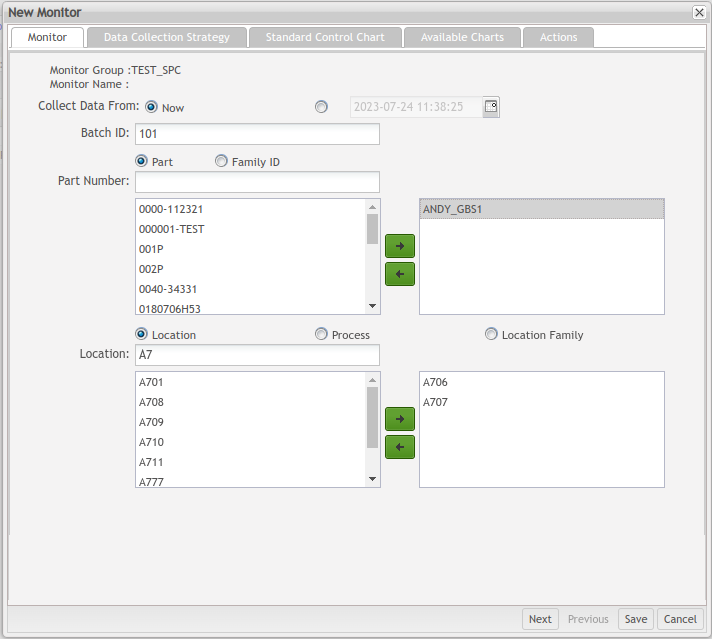
The first section is the Monitor.
Figure 15: Monitor Section
- Collect Data From: Enable SPC to collect data from Now or from a past date.
Note: Historical data that contains exceptions could stop the present production line. If a previous date is selected here and the option Send MFG Hold request to was checked when creating the server, then a user attempting to save the monitor at this point will be prompted by a warning that asks the user to confirm the decision to save.
- Batch ID: The name of the monitor or batch of monitors. This field cannot be edited as it is automatically set after the Part Number, Family ID, and Location, Process, and Location Family. If monitor data is automatically collected from MDS, the monitor name consists of two parts separated by a hyphen: The first part is Part Number / Family ID, and the second part is Location / Process / Location Family. If monitor data is collected manually via SPC UI, the monitor name will also contain the third part: the attribute name.
- Part Number: The part number to be monitored by SPC. The part number is created and configured in MDS before being created in the SPC monitor. The Part Number option is selected by default. Users must enter a specific part number or select one from the associated drop-down box.
![]() TIP: When users enter four characters into the field, the portlet will automatically begin searching and listing any part numbers that match the input. To date, the Part Number, Family ID, Location, Process, and Location Family fields support this search-as-you-type feature.
TIP: When users enter four characters into the field, the portlet will automatically begin searching and listing any part numbers that match the input. To date, the Part Number, Family ID, Location, Process, and Location Family fields support this search-as-you-type feature.
- Family ID: The Family ID is to be monitored by SPC. Family ID is created and configured in MDS before being created in the SPC monitor. Users must select the Family ID option manually and either enter the family ID or select one from the drop-down box.
- Location: The location is to be monitored by SPC. Location is created and configured in MDS before being created in the SPC monitor. The Location option is selected by default. Users must enter or choose a location from the associated drop-down box.
Note: Attribute is associated with part number + location or part number + process. If a monitor is created with part number A + location B and part number A + process B, some attributes will be associated, then the user can create Continuous control charts. The associated attributes can be viewed in the Data Collection Strategy tab.
- Process: The process to be monitored by SPC. The process is created and configured in MDS before being created in the SPC monitor. Users must select the Process option manually and then enter or choose a process from the drop-down box.
Note: If the "Route by Process" option is enabled in SFDC when a new monitor is being created, the user may select either Part Number and Location or Part Number and Process. However, if the Mfg Hold submodule is to be used to perform a hold on a serial number for a certain part number, the respective monitor should be created by selecting Part Number and Process, not Part Number and Location.
- Location Family: The location family is to be monitored by SPC. Location Family is created and configured in MDS before being created in the SPC monitor. Users must select the Location Family option manually, and then enter by choosing a location family from the drop-down box.
Note: Some plans have more part number records but don’t have a relation with the route. The system will create a monitor with Part Numbers that should be relative to shop orders. Part Number/Family ID needs to set up a relation with the shop order whose status is Release.
Data Collection Strategy
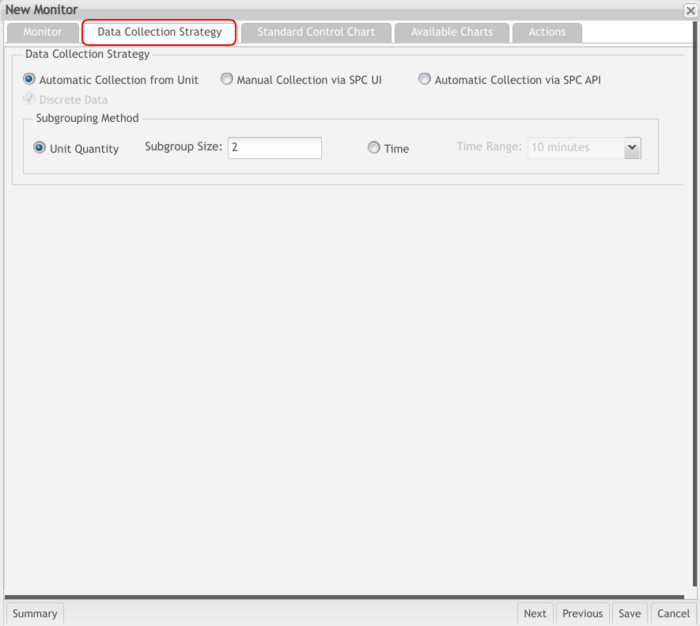
The second section is the Data collection strategy. According to the data chosen (Part Number and Location) at the Monitor tab, the user can create continuous control charts.
Figure 16: Data Collection Strategy
- Automatic Collection from Unit: Allows SPC monitor to automatically collect data from MDS service. This option is selected by default.
- Manual collection via SPC UI: Allow end users to manualy collection continuous data vis SPC ui(Input feature in SPC).
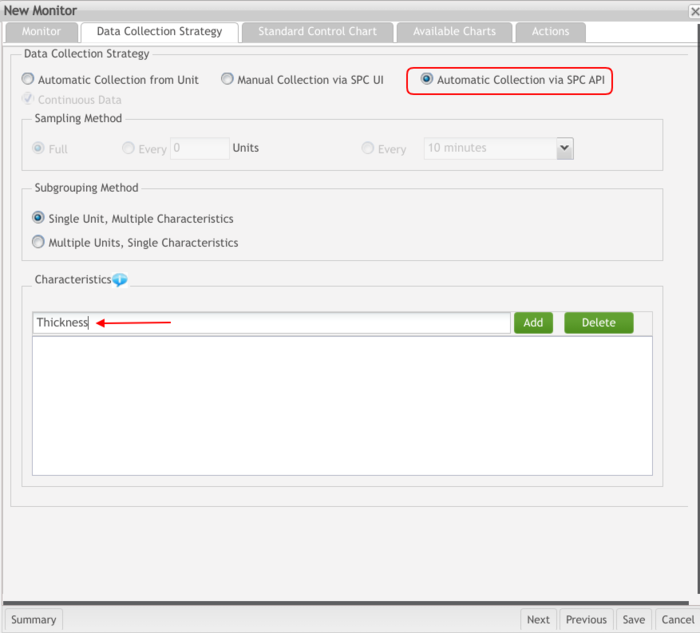
- Automatic Collection via SPC API: With this option the users can create a monitor with Automatic Collection Via SPC API type and clients (such as PWB), which can push the data to SPC via its monitor API as long as the characteristics in the parameters of the API endpoint exist and match this monitor, the continuous data control charts (such as X bar-R chart, I-MR chart, and CPK/PPK report) will plot.
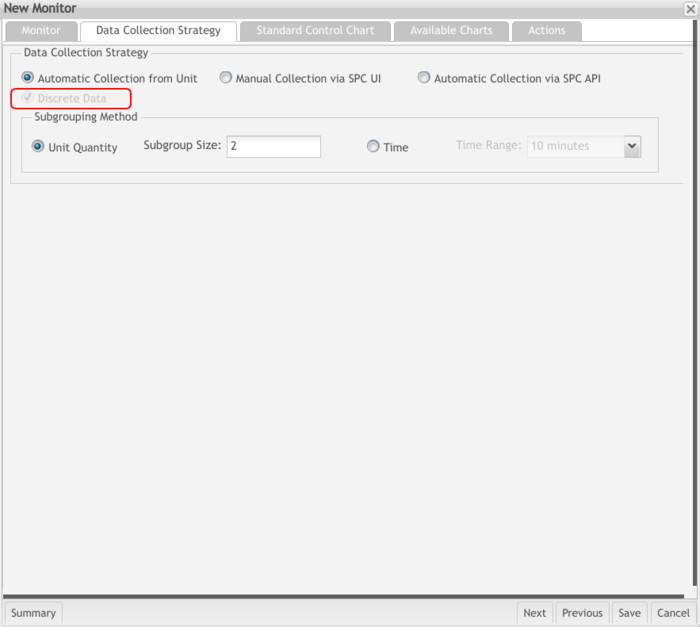
- Subgrouping Method: This field defines the rules of how data should be organized to form a series of points plotted on control charts. It consists of the following components: Unit Quantity, Time, Subgroup Size textbox (if Unit Quantity is selected), and Time Range drop-down box (if Time is selected).
- Unit Quantity: The data will be grouped by quantity. The quantity is defined in the Sample Size textbox. For example, if a data source contains 100 data items and the sample size value is 2, then this data source will be divided into 50 groups (100 / 2 = 50). This radio button is chosen by default.
- Time: The data will be grouped by time range. For example, if a sampling period is 60 minutes and the time range is 10 minutes, then this sample period will contain 6 groups of data (60 / 10 = 6). Users must manually select the By Time option.
The sampling rules are customized by the user. The sampling method is divided into by time period sampling and by quantity sampling. The time and quantity can be set in SPC (The default sampling is the first serial number).
Note: If there is no data in this sampling range, no new points will be created in X bar - R chart).
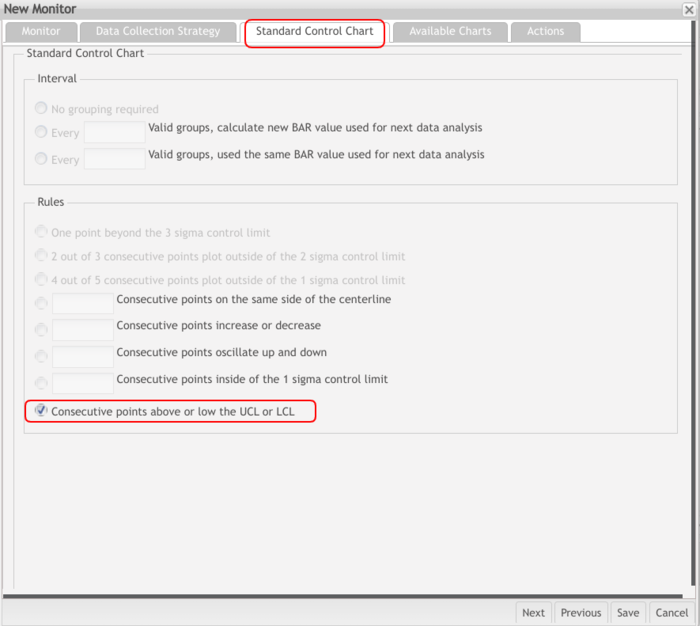
Note 2: It is not allowed to update the Data Collection Strategy if the DotLine source type is selected because the Dot Line chart is not a control chart, so these rules cannot be applied to the Dot line chart. To achieve the feature of sending an alert email or changing the background color to red, a rule must be set.
A new rule according to the characteristics of the Dot line chart was added: Consecutive points above or lower than UCL or LCL.
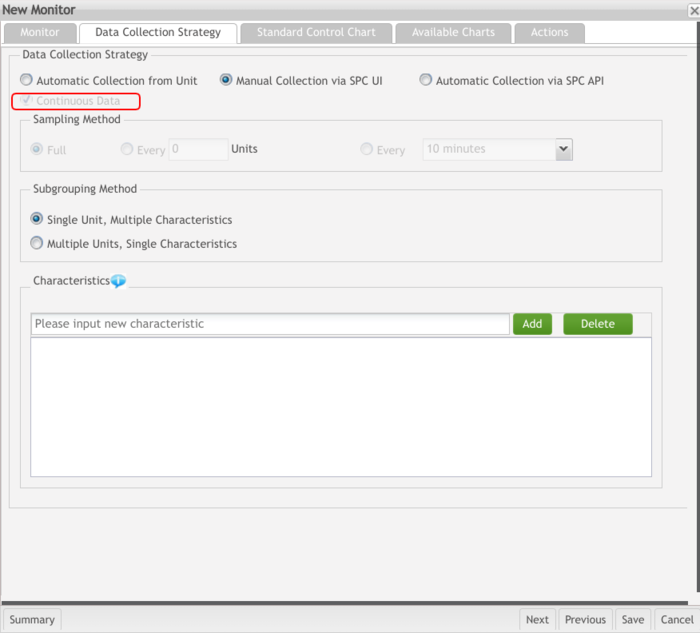
SPC supports Continuous data and Discrete data control charts in one monitor. Users can choose one of them or the two control charts.
Figure 17: Data Collection Strategy - Continuous Data
Figure 18: Data Collection Strategy for Discrete Control Charts - Discrete Data
Sampling Method
The sampling method belongs only to continuous charts. This field defines the rules on how data should be organized to form a series of points plotted on control charts. It consists of the following components:
- Full (Full Inspection).
- Every X Units: Users can input the numbers of units. For example, 5, means the system will select one unit from every 5 units.
- Every X Time: Users can select the time from the drop-down list. Options: 10 minutes, 15 minutes, 20 minutes, 30 minutes, 1 hour, 2 hours, 3 hours, 4 hours, 6 hours,8 hours, 12 hours, 24 hours.
The original system defaulted to a FULL inspection, without configuration. For every Unit and Every time sampling, the system defaults to extract the first serial number of this time period/quantity for statistics.
Now with Attribute Maintenance Configuration, it is possible to check whether the attribute is in the same group.
The current SPC has an attribute grouping control logic. Only the same type of attribute can be monitored in a monitor, otherwise, it will prompt a warning message. To turn the SPC attribute grouping logic consistent with the actual SFDC attribute grouping rules, new rules were created for the attributes. According to the Attribute Maintenance Configuration, it is possible to check whether the attribute is in the same group.
Note: Only the attributes in the same attribute group can be monitored together in one monitor.
Standard Control Chart
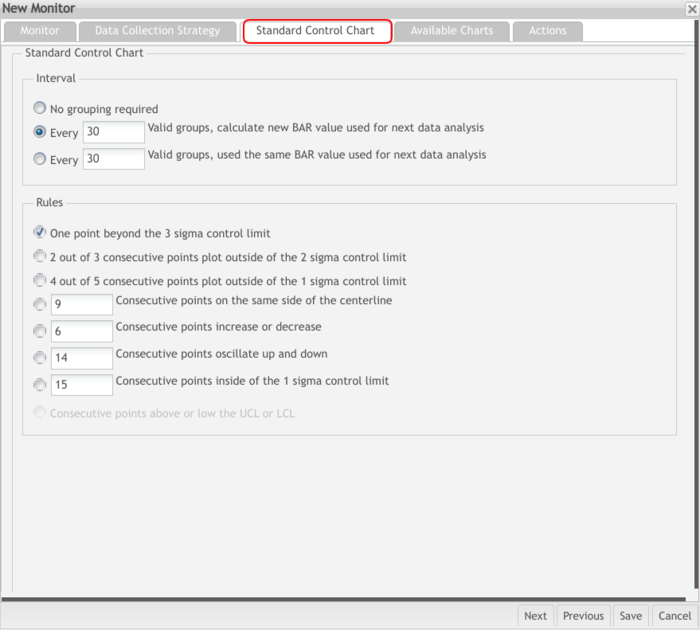
The following section is the Standard Control Chart, which contains two sub-sections: Interval and Rules.
Figure 19: Standard Control Chart
Interval
This subsection defines the frequency at that SPC recalculates the center line value of a control chart. Here valid groups are used as the frequency unit. It is allowed to use a new monitor with different grouping methods:
Figure 20: Interval Section
- No grouping and without recalculating bar values
- Allow the user to set the number of groups, and calculate the new BAR value used for the next data analysis
- Allow user to set the number of groups, use the same BAR value used for the next data analysis
See below a sample of the chart:
Figure 21: Chart Sample for Valid Group
Rules
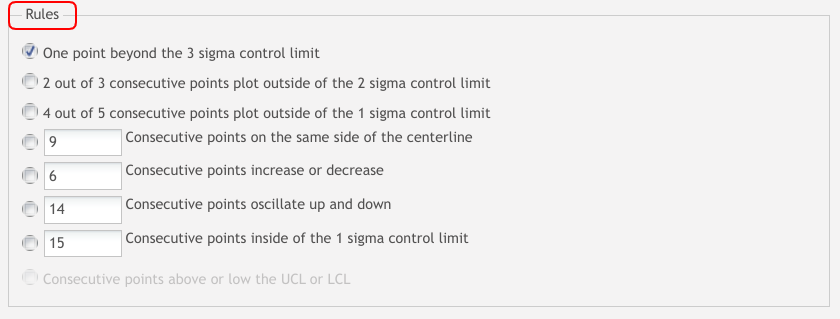
This sub-section lists all seven rules which are considered to be out-of-control exceptions. Users can select one or more rules in this checkbox group.
Figure 22: Rules Section
Consecutive Points above or lower than UCL or LCL option will be available if the selected data source is DotLine Source.
Figure 23: New Monitor DotLine Chart Standard Control Chart Tab
Available charts
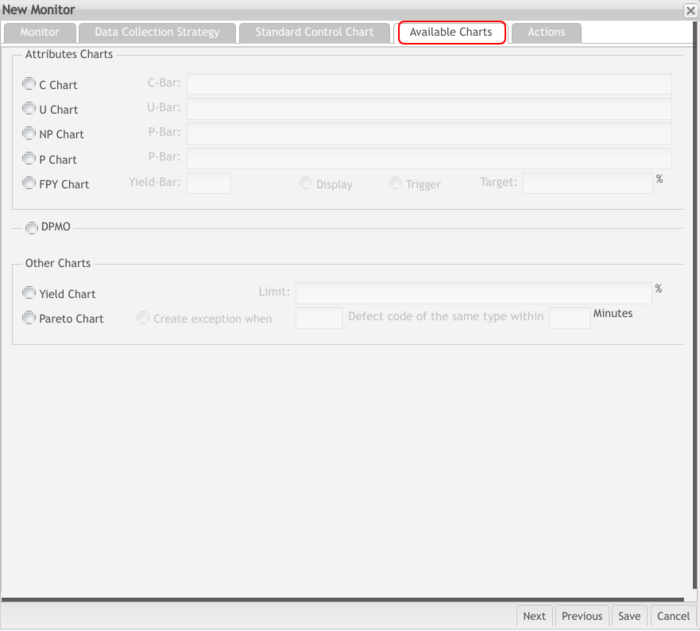
This tab displays all available control charts, DPMO, and Other Charts in the current context. The SPC Control Chart is generated based on the data source that is configured in the Monitor section so that different configurations in the Monitor section may have different available charts. Users can choose one or more control charts in this checkbox group.
Figure 24: Available Charts (non Continuous control charts)
The textbox on the right of the chart name is used for defining the centerline value of the control chart. For example, if a user chooses the C Chart checkbox, the C-Bar textbox becomes available. Users can then manually enter a number in the textbox, which becomes the centerline value of the chart.
Figure 25: C-Chart Field
Note: Be careful with the values entered in the textbox for control charts if the line stoppage function is enabled. If the Send MFG Hold Request to MDS checkbox was selected when creating an SPC server, SPC may stop the production line if a user defines unreasonable values for the control chart based on the rules selected.
For FPY Chart, selecting the Display checkbox enables SPC to display the FPY chart on the monitor. The Trigger checkbox enables an out-of-control warning.
Note: The Current SPC allows users to choose a specific version to display FPY charts.
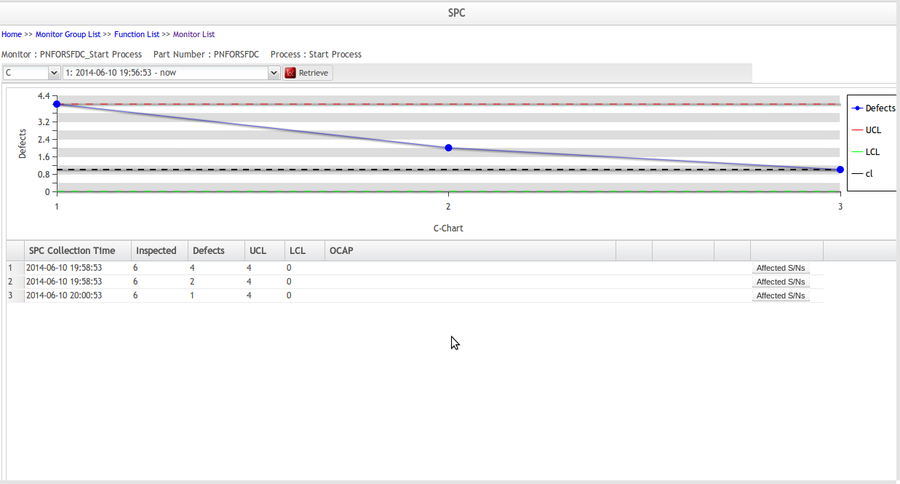
C-Chart
C-chart is an attribute control chart used with data collected in subgroups that are the same size.
It shows how the process, measured by the number of nonconformities per item or group of items, changes over time. Nonconformities are defects or occurrences found in the sampled subgroup.
Figure 26: C Chart
U-Chart
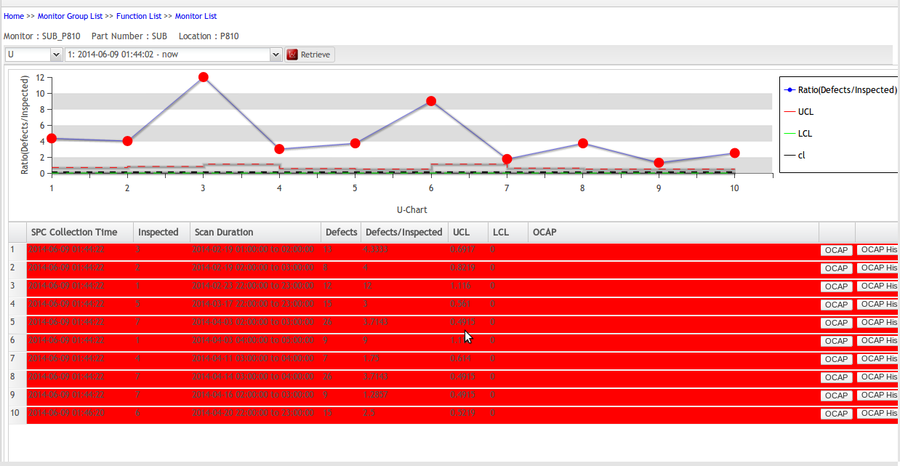
U-chart is an attribute control chart used with data collected in subgroups of varying sizes. U-charts show how the process, measured by the number of nonconformities per item or group of items, changes over time.
Figure 27: U Chart
NP-Chart
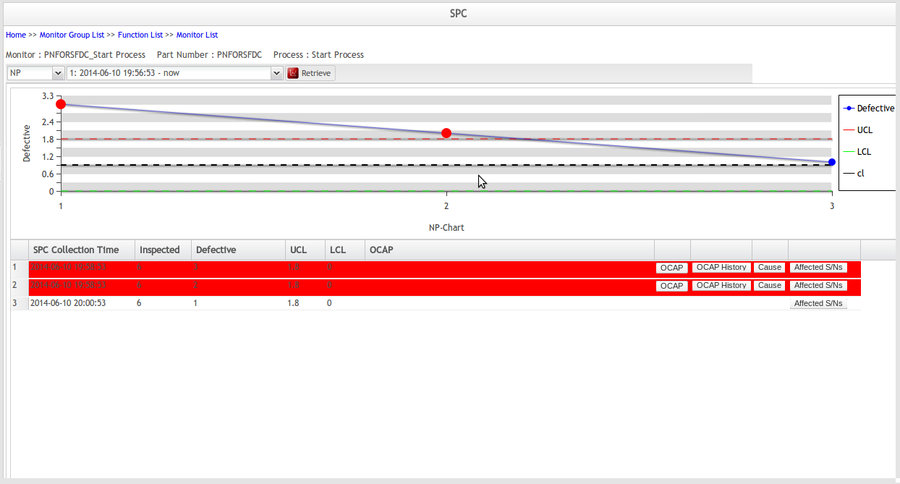
NP-chart is an attribute control chart used with data collected in subgroups that are the same size. NP-charts show how the process, measured by the number of nonconforming items it produces, changes over time.
Figure 28: NP Chart
P-Chart
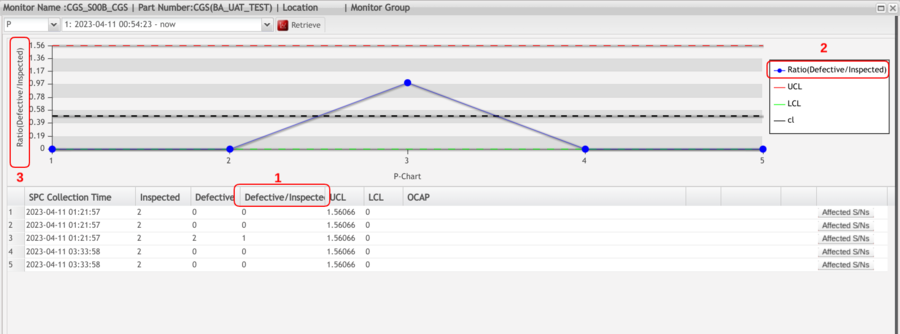
P-chart is an attribute control chart used with data collected in subgroups of varying sizes. Because the subgroup size can vary, it shows a proportion on nonconforming items rather than the actual count. P-charts show how the process changes over time.
Figure 29: P Chart
FPY-Chart
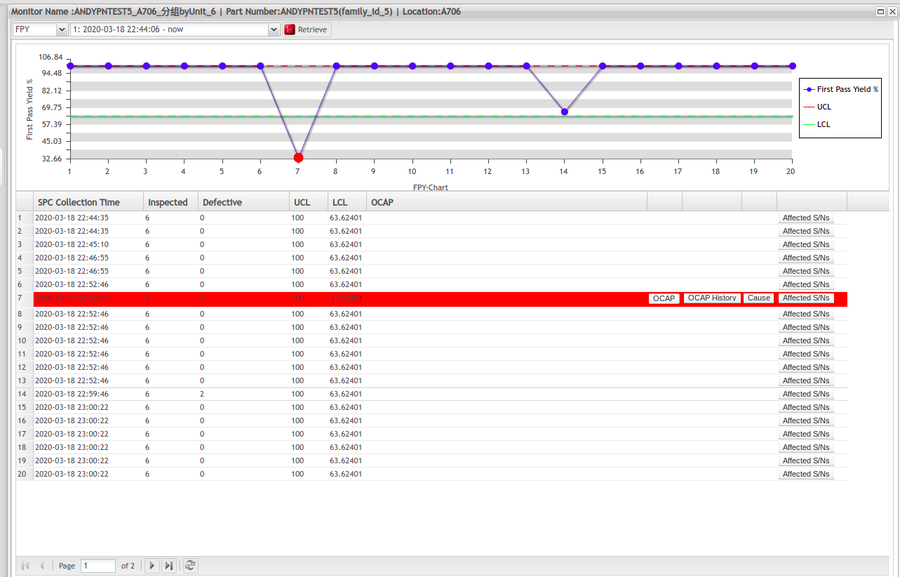
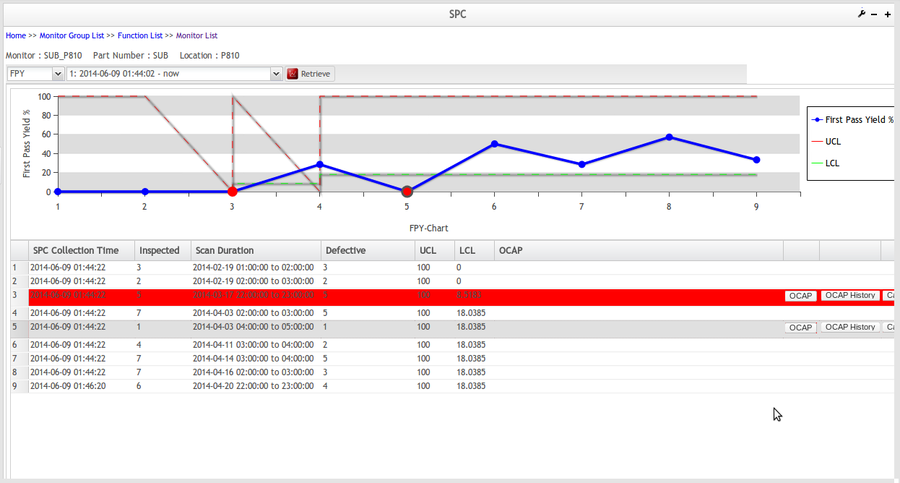
FPY is a First Pass Yield:
- Capable of plotting the First Pass Yield of a product at a particular process step over a period of time or number of boards.
- Capable of manual configuration the upper control limit and lower control limit.
- Can displays the target (Goal) line.
- Capable to use the 7 Rule alarms for triggering.
- Capable to trigger the alarm when FPY falls below the Target Line.
Figure 30: FPY Chart
DPMO
Figure 31: DPMO Chart Types
- DPMO Chart: This enables SPC to monitor a manufacturing line with a DPMO chart. Defect opportunity and UCL represent the two parameters used for defining DPMO charts.
Note: The other 4 charts are custom made by the company according to the specific defect code. For example:
- DPMO-Placement Chart: Placement is a defect code name. The chart is only for this defect code. The other 3 charts are the same
- DPMO-Termination Chart: Termination is a defect code type. The chart is only for this defect code
- DPMO-Assembly Chart: Assembly is a defect code type. The chart is only for this defect code
- DPMO-Component Chart: Component is a defect code type. The chart is only for this defect code
Other Charts
The Other Control Chart section, has the following components:
Figure 32: Other Chart
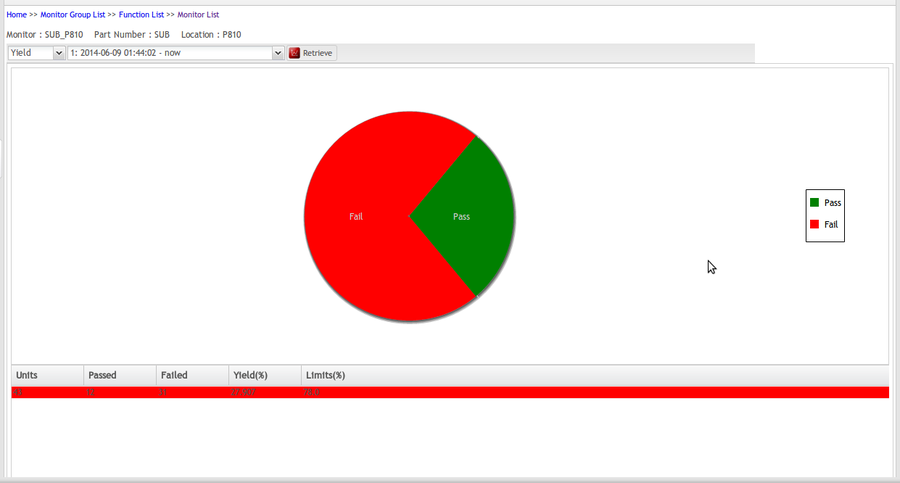
Yield -Chart
Enables SPC to monitor the manufacturing line with the Yield chart. The limit is a parameter used for defining the Yield chart.This chart shows the Yield value for a selected or retrieved process, one at a time, and a list of the N last products passed on this process.
Figure 33: Yield Chart
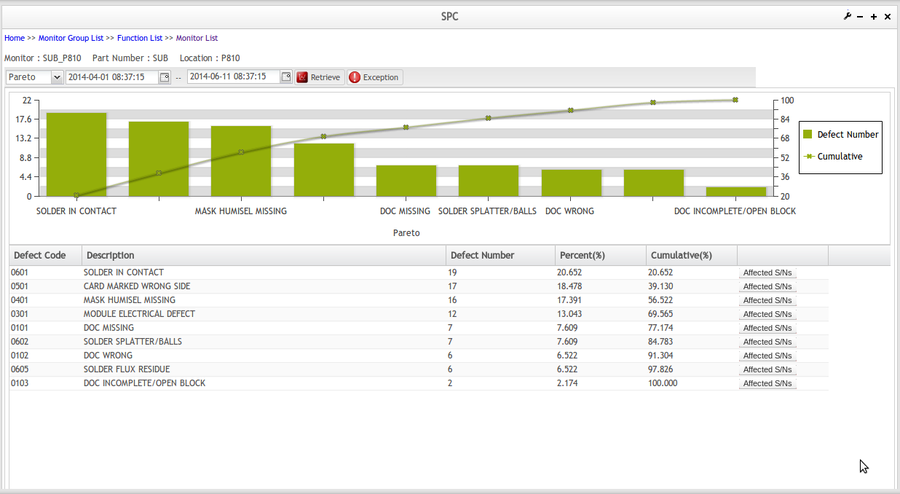
Pareto Chart
Enables SPC to monitor the manufacturing line with a Pareto chart. Users can define a Pareto chart exception rule by selecting the Create exception when checkbox and entering, for example, 3 Defect codes of the same type within 10 Minutes.
The Pareto chart indicates which problem to tackle first by showing the proportion of the total problem that each of the
smaller problems comprises. It is a type of chart that contains both bars and a line graph, where individual values
are represented in descending order by bars, and the cumulative total is represented by the line.
Figure 34: Pareto Chart
For continuous control charts, users have to select Manual Collection and Multiple Units, Single Characteristics at the (Data collection strategy ) tab, then go to Available Charts, will get to see these options.
Figure 35: Available Control Charts for Continuous Control Charts
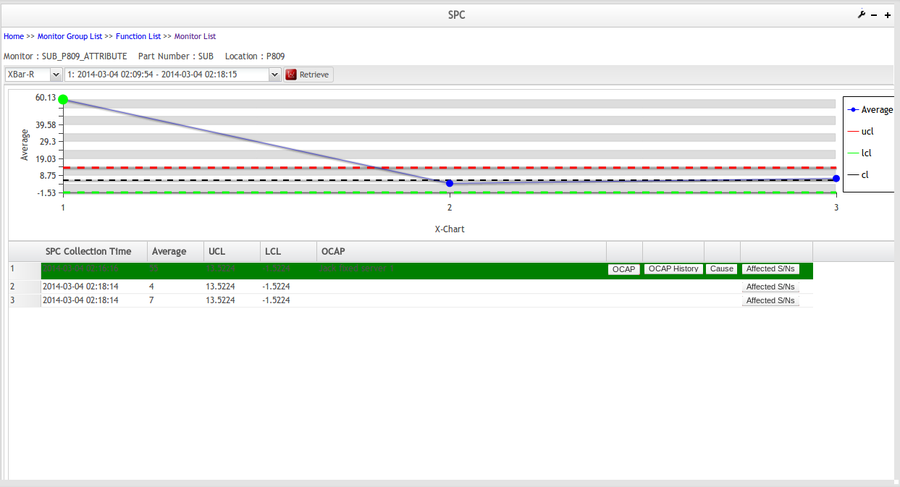
XBar-Chart
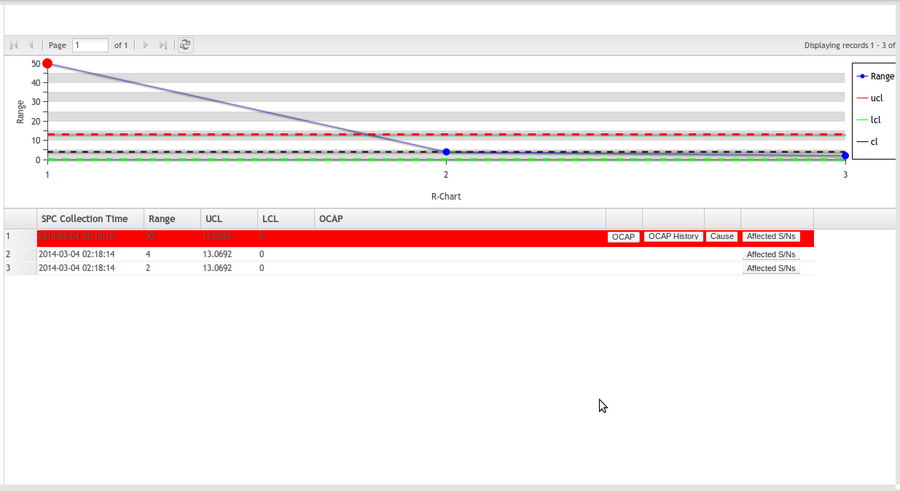
X-bar and R (range) chart is a pair of control charts used with processes that have a subgroup size of two or more.
The standard chart for variables data, X-bar, and R charts help determine if a process is stable and predictable. The X-bar chart shows how the mean or average changes over time and the R chart shows how the range of the subgroups changes over time.
Figure 36: XBar Chart
R-Chart
The X-bar chart shows how the mean or average changes over time and the R chart shows how the range of the subgroups changes over time.
Note: LCL can’t be negative. Both S (Standard Deviation) and R (Range) can't be negative, due to their nature. All the points that the user scans are displayed on the chart and when expanding chart details, all the information in the chart page is collected such as SPC Collection time, Average, LCL, UCL, OCAP, attributes, etc. There are no negative numbers on the Y-axis.
Figure 37: R Chart
- I-MR Chart I-MR chart is a combination of two charts (Individual and Moving Range) is to track the process variability based on the samples taken from a process over the period of time. An Individual moving range (I-MR ) chart is used when data is continuous and not collected in subgroups.
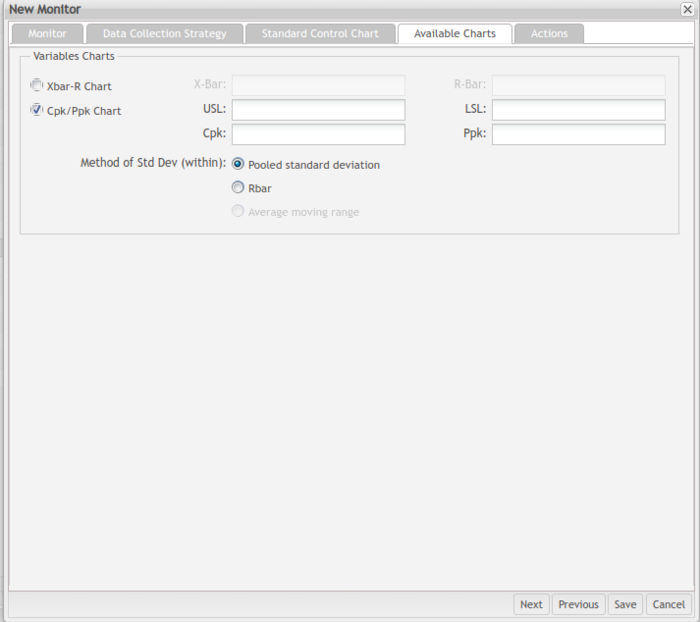
CPK/PPK-Chart
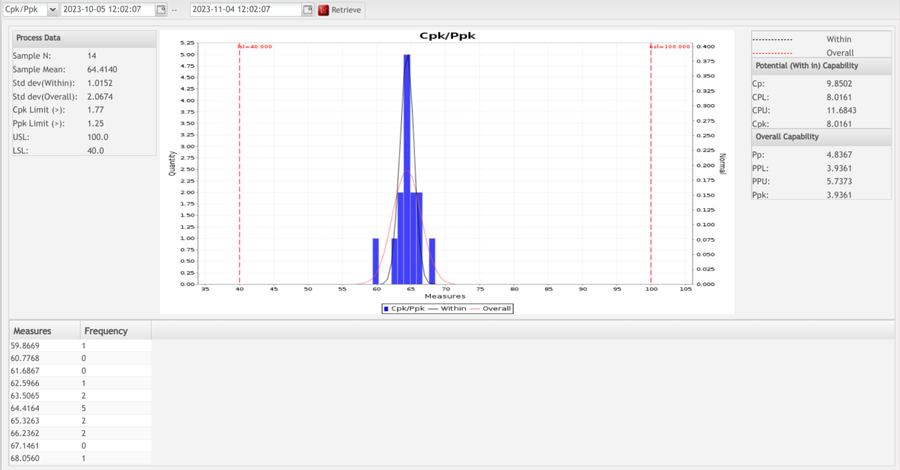
Cpk is the potential of a process to meet a specification (short term) while Ppk is how the process actually did (long term).
The Method of Std Dev(within) in the cpk/ppk chart has three available options:
- Pool standard deviation
- R Bar
- Average moving range.
The method used to Std Dev(within) depends on the subgroup size.
When subgroup size > 1, SPC estimates Std Dev(within) using one of the following two methods: Pooled standard deviation and an average of subgroup ranges (Rbar), SPC selects Pooled standard deviation method by default.
Whensubgroup size = 1, SPC estimates Std Dev(within) using the Average moving range method.
See below the description and samples of the main available charts at SPC:
CPK/PPK shows if the real process capability meets the specification
Definitions
- Cp= Process Capability. A simple and straightforward indicator of process capability.
- Cpk= Process Capability Index. Adjustment of Cp for the effect of non-centered distribution.
- Pp= Process Performance. A simple and straightforward indicator of process performance.
- Ppk= Process Performance Index. Adjustment of Pp for the effect of non-centered distribution.
- Cpk is for the short term, and Ppk is for the long term.
Cp and Cpk
It is common to express process capability in terms of:
- How well can we meet the customer’s specifications?
- Voice of Customer / Voice of the process
- It is a potential capability index - Cp is defined as:
Cp = USL – LSL/6σst
The minimum acceptable value for Cp is normally considered to be 1
Cpk = Min (USL- x, x – LSL)/3σst
When there is no shift or drift, Cpk and Cp are equal. As the process drifts, Cpk gets smaller.
Pp and Ppk Chart
Over time, the drift in the process will have the effect of ‘flattening out’ the distribution, and the standard deviation of the process will increase. To reflect this effect properly, we define two long term capability indices, Pp and Ppk.
These indices have the same formulas as their short term counterparts, but use the long term standard deviation in their denominators, σlt
Pp = USL – LSL/ 6σlt Ppk = Min (USL- x, x – LSL)/3σlt
Figure 38: CPK/PPK Chart
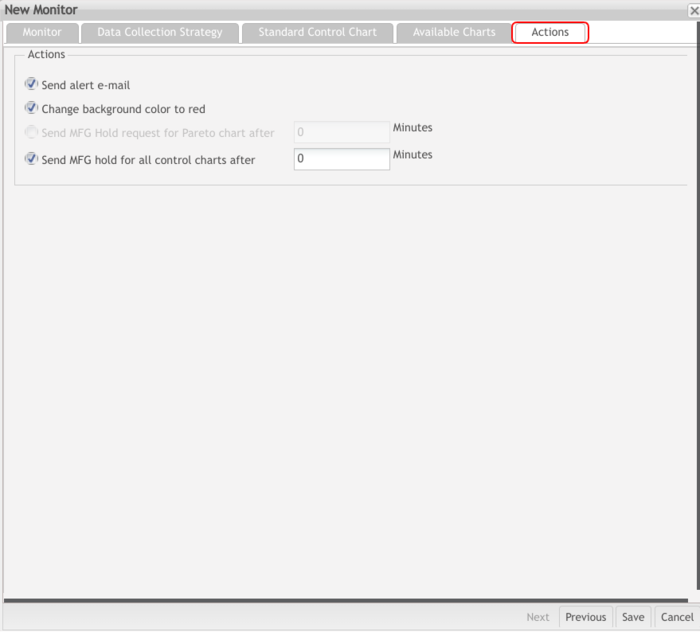
Actions
The fifth section is the Actions. This section defines what actions should be taken after the out-of-control exception is triggered.
Figure 39: Actions
- Send alert e-mail: This action sends an alert email to a specific person. Users can specify who would receive these alert emails in the Email Maintenance module.
- Change the background color to red: If the exception was triggered, the background of the associated data record in this monitor will turn red.
- Send MFG hold request after n minutes: This action is an SPC line stopper function. To enable this action, the following options must first be enabled:
- Send MFG Hold request to MDS checkbox in Add/Edit Monitor group page.
- Pareto Chart checkBox in Other Control Charts section.
- Create an Exception when n1 defect code of the same type within n2 minutes checkbox in the Other Control Charts section.
If Send MFG hold request after n minutes checkbox is enabled and if n1 defect code of the same type is scanned via NetDC within n2 minutes, SPC will send an MFG hold request to SFDC / MDS after n minutes. If the input minutes is 0, SPC will send the MFG hold immediately.
Note: This checkbox is not selected by default. Line stopper in SPC supports hold by part number + Location/process based on monitor selection.
Lastly, remember to click ![]() to save all the configurations before you leave the page, or click
to save all the configurations before you leave the page, or click ![]() button if you want to give up the configuration and return to the Monitor List page.
button if you want to give up the configuration and return to the Monitor List page.
Search Monitor
The Search Monitor portlet makes it very convenient to find a specific monitor from the monitor's list. You can find this function in the toolbar on the Monitor List page.
Figure 40: Search Monitor
Users can search monitor by' Monitor Name, Location, Process, Location By Family, Part Number Family ID, Batch ID, and Monitor' Status.
Once search criteria have been selected and entered, select Search to execute the search action.
Hide Inactive Monitors
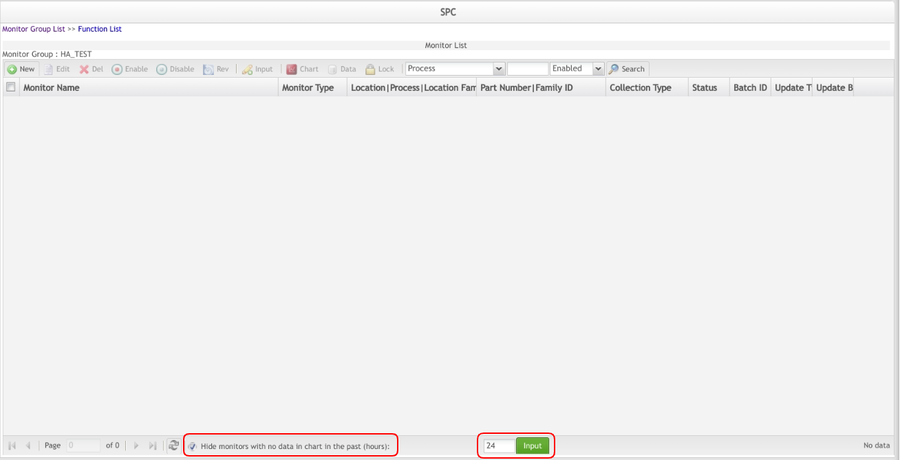
It allows the user to filter out those monitors that have no new data coming in during the past settable hours. The user can define the settable hours in the SPC System Parameter Maintenance module, and view active monitors on the Monitor List page.
It can turn off the filtering inactive monitors function. This option is at the bottom of the screen.
View Active Monitors by Default Hours
In the Monitor List page, the checkbox Hide monitors with no data in chart in the past(hours) are selected by default along with a textbox displaying the hours defined in the SPC System Parameter Maintenance module. The SPC system filters out those inactive monitors that meet the condition.
Figure 41: Hide monitors with no data
Note: Users can Edit Settable Hours and also Disable Hide Inactive Monitors Function.
- Edit the hour’s textbox value and select Input to view corresponding monitors. The value allowed in this textbox is a positive integer between 1 to 168. Modification of the value here does not affect the value defined in the SPC System Parameter Maintenance module.
- Unchecking theHide monitors with no data in the chart in the past(hours) box deactivates the monitor filtering function so that the SPC system shows all existing monitors.
Edit Monitor (Edit Monitor in Batch)
SPC allows users to modify the parameters of an existing monitor according to their needs. Users can modify sections including Interval, Rules, Available charts, Other control charts, and Actions. To edit monitors, they must be stopped.
- Select a monitor in the same batch from the monitor list on the ‘Monitor List’ page, then hit the Edit icon in the toolbar.
Figure 42: Monitor List - Edit a Single Monitor
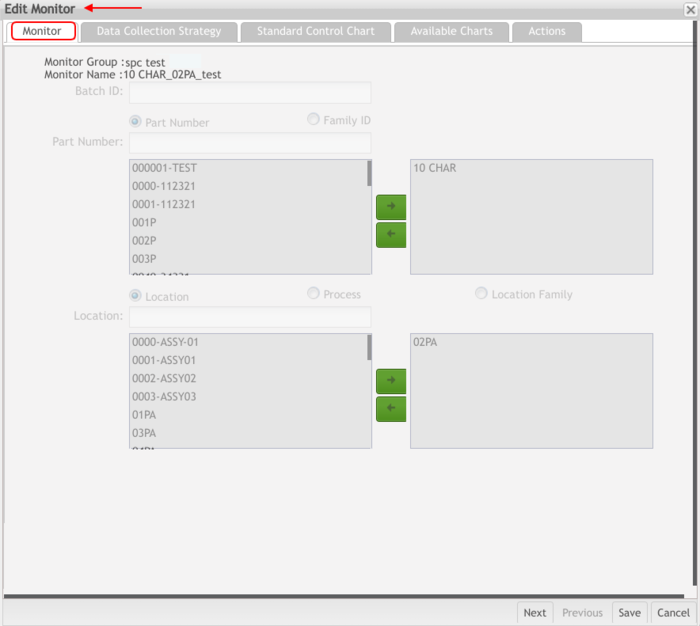
- Modify the preferred available information.
Note that the Monitor tab is not allowed to be modified. Update the other tabs information accordingly.
Figure 43: Edit Monitor Page
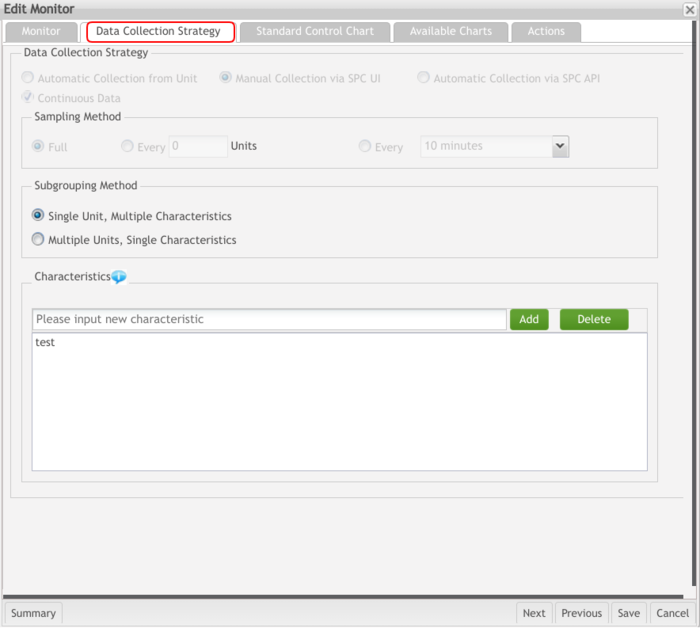
Data Collection Strategy can also be edited.
Figure 44: Edit Monitor Page - Data Collection Strategy
- Select Save to save all modifications before leaving the page.
Note: If the Data Collection Strategy selected is Manual Collection via SPC UI, the user can also modify the Attributes values.
Edit Monitor (Edit Monitor in Batch)
In the main menu, the user must choose Batch ID from the search engine and select the monitors in the batch to edit, and then click the Edit icon in the toolbar.
Figure 42: Monitor List - Edit Monitors in Batch
Figure 43: Edit Monitor Page
- Modify the preferred available information. Note that the Monitor tab is not allowed to be modified. Update the other tabs information accordingly.
Note: If the Data Collection Strategy selected is Manual Collection via SPC UI, the user can also modify the Attributes values.
Delete Monitor / Delete Monitor in Batch
If users no longer need a monitor or monitor in batch and want to remove it, the monitor can be deleted.
Note that once a monitor is deleted from SPC, it cannot be restored, and this is permanent.
To delete a monitor:
- Check the box of the monitor to be deleted, and select Disable to disable the monitor first.
- Once the monitor is disabled, locate the monitor in the disabled monitor list and check the box of the monitor to select it.
- Click the DEL icon in the toolbar.
Figure 47: Function List - Delete
4. Choose Yes in the pop-up window.
To delete a monitor in batch:
- Search for the Batch ID and select the monitors in the batch to be deleted.
- Check the box of the monitors to be deleted and select Disable to disable the monitors first.
- Once the monitors are disabled, check the box of the monitors to select them.
- Click the DEL icon in the toolbar.
- Then choose Yes in the pop-up window
Disable, Enable, Delete Monitor
SPC supports automatic start monitors to simplify the application use process, this will greatly reduce maintenance costs
Engineers only need to create monitors when they have a new product or disable/delete monitors after the product has been EOL. Even keeping a large number of Enabled monitors will not affect SPC performance.
Figure 48: Scenarios
Enable monitor
To enable a disabled monitor
- Find the disabled monitor in the list and check the box for that monitor.
- Click the Enable icon in the toolbar.
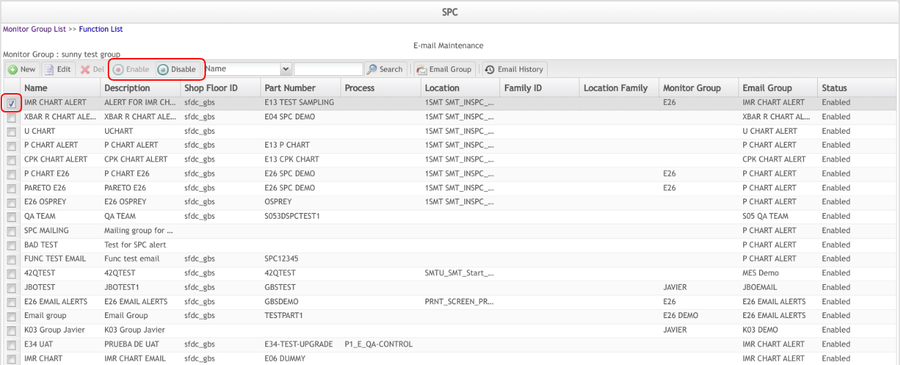
Figure 49: Function List - Enable
Users can search enabled monitors using the search function by selecting Enabled from the monitor status drop-down list and clicking the Search icon.
Disable Monitor
After a new monitor is created, its status is Started by default. The monitor's data is automatically collected from MDS.
If a user does not need a monitor to operate, the user can disable the monitor.
- To disable a monitor, check the box of the monitor.
- Select the Disable icon to disable the monitor.
Figure 50: Function List - Disable
Users can search for disabled monitors using the search function by selecting Disabled from the monitor status drop-down box and clicking theSearch icon.
View Monitor History
To view the modification history of a monitor:
- Go to the Monitor List page, select a monitor, and click the REV icon.
Figure 51: Monitor List - Rev Icon
Manually Input Data to Monitor
To date, the SPC monitor supports three data collection strategies: Automic Collection From Unit Attributes, Manual Collection via SPC UI, and Automic Collection via SPC API, which can be configured in the Data Collection Strategy section. If ‘manual collection via SPC UI’ is selected as a data collection strategy, data must be manually entered after the monitor is created.
Input Data for Only One Monitor
To enter data for one monitor: From the Monitor List screen, select the monitor that needs to manually input data (the ‘Collection Type’ value of this monitor is ‘Manual’), and then click the Input icon.
Figure 52: Monitor List - Input
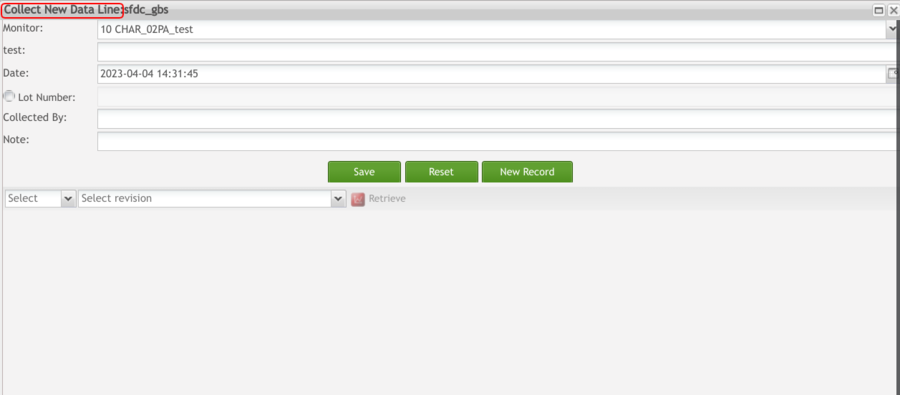
In the Collect New Data page, input attributes data to correspondent fields.
Figure 53: Input - Collect New Data
Input Data for Multiple Monitors At Once
Users can select and input data to multiple monitors at once, as long as all of the selected monitors' Collection Type is Manual.
Figure 54: Monitor List - Collection Type Column
Note: If users have selected monitors that contain at least one monitor whose Data Collection Type is not Manual, and click Input, users will be prompted by an alert window saying 'You have selected at least one monitor that is not for manual data collecting. Please check and try again.' Close the alert window by clicking Ok.
Input Attributes for the Current Monitor
On the Collect New Data page, users can enter attributes for multiple monitors at once. The Monitor drop-down list will display the currently selected monitor to input data. Users can view the Line, Monitor Name, and Location of the current monitor in the top left corner. Note that the allowed input of attributes is number only.
Note 1: If users have input values in at least one of the fields and select Reset, an alert window will display with the warning message, 'You are about to reset all values. This action will delete all values of the current monitor. Are you sure you want to proceed?' Selecting Yes resets all entries for the current monitor to the default value.
Note 2: If users have input values set to at least one of the fields, and select another monitor from the Monitor drop-down list, an alert window will display with the warning message, 'The data for the current monitor has not been saved yet. Are you sure you want to go to another monitor?' Selecting Yes will redirect the user to another monitor without the current monitor's data stored in the SPC system.
Note 3: If users have input values to at least one of the fields and select the New Record button, an alert window displays with a warning message, 'You are about to cancel the attribute data entering. The current monitor will have no attributes recorded. Are you sure you want to proceed?' Selecting Yes will move a user to the Monitor List page without the current monitor's data stored in the SPC system.
Save the current monitor's attributes data
In the Collect New Data page, if a user has finished inputting data to the current monitor, and selects Save, all the current monitor fields turn grey except the Monitor drop-down list and the user cannot edit any data. The current monitor name in the Monitor drop-down box changes to 'monitor_name (Saved)' where monitor_name is the name of the current monitor. Now the user can switch to another monitor to input attribute data to that monitor.
Switch to Another Monitor
To switch to another monitor to input attributes, click the Monitor drop-down box and select another monitor from the list.
Automatic Collection via SPC API
TheAutomatic Collection via SPC API method allows the users to create a monitor with Automatic Collection Via SPC API type, the clients (such as PWB) or other third-party applications to push the data to SPC via its monitor API as long as the characteristics in the parameters of the API endpoint exist and match this monitor, the continuous data control charts (such as X bar-R chart, I-MR chart, and CPK/PPK report) will plot with SPC.
Scenario
One plant needs to measure the thickness of its products multiple times during a process that can take days. They measure the thickness every 1/2 to 1 hour. They need to collect the thickness using Production Workbench as this is the interface the Operators use for the entire manufacturing process. Every thickness measurement collected via Production Workbench should be displayed on the SPC chart in near real time not only when the unit (non-serialized batch) moves from the location via terminator command.
SPC shall display all records collected via PWB attributes in “near real time”. This shall occur upon submission without regard to if we are in the middle of the process or at the end of the process moving to the next location.
The customer does not desire to use another user interface (SPC, Measurement, custom, etc) to collect the data. The operators will be working in PWB only at the terminal. (Thin terminals are to be used.) The following will take the Production Workbench sending attribute values to SPC via SPC API as an example to explain the work process step by step.
Work process Step by step
To transmit data through the API, the SPC Token, Key, the Generic attribute needs to be set.
- Step 1: Define the SPC Server information at the Server information.
Navigate to: Administration > Server Information; add one SPC server information.
Note: Please select the SPC for the Program field.
- Step 2: Define the generic attribute form at the Generic Attribute Maintenance(MDS) module that allows the production workbench to call the SPC API to send attribute data to SPC.
Navigate to: Administration > Generic Attribute Maintenance(MDS); add one Generic Attribute information.
Note: Please select spc_service_host for the Attribute Name field and Project for the Table field. And the Value is the SPC Host: SPC AppServer Port (The SPC Server defined at the server information).
- Step 3: Create a Monitor, select theAutomatic Collection via SPC API at the Data Collection Strategy tab.
And add the attributes to the Characteristics list.
Note: The Characteristics must be the same as the attributes used/scanned at Production Workbench.
Figure 55: Create a Monitor Automatic Collection via SPC API
- Step 4: Input/Scan the Serial number at the Production Workbench application.
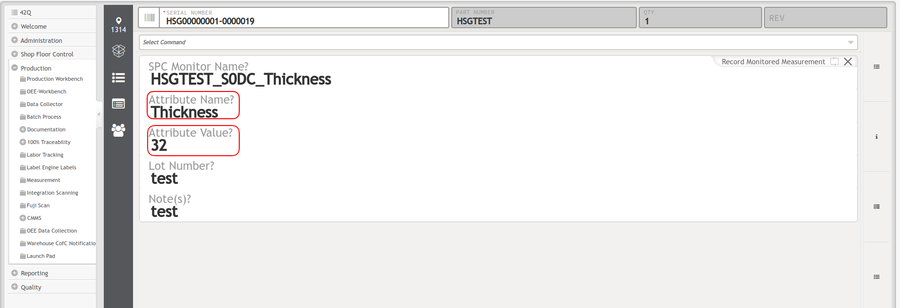
To transmit the values of the attributes to SPC via the SPC API, the users select the command. e.g. Record Monitored Measurement.
After inputting the command, some fields will show:
SPC Monitor Name?: Input the SPC monitor name. The Monitor Name must be the monitor that is created in step 3.
Attribute Name?: Input the Attribute name. The Attribute Name must be the Characteristics that are defined in the Data Collection Strategy tab.
Attribute Value?: Input the attribute value. The value will be transmitted to SPC via SPC API even if the user doesn’t input the terminator/end command. The user can view the chat on the monitor in real-time. e.g. The input value 99 will show on the monitor chart.
Figure 56: Production Workbench
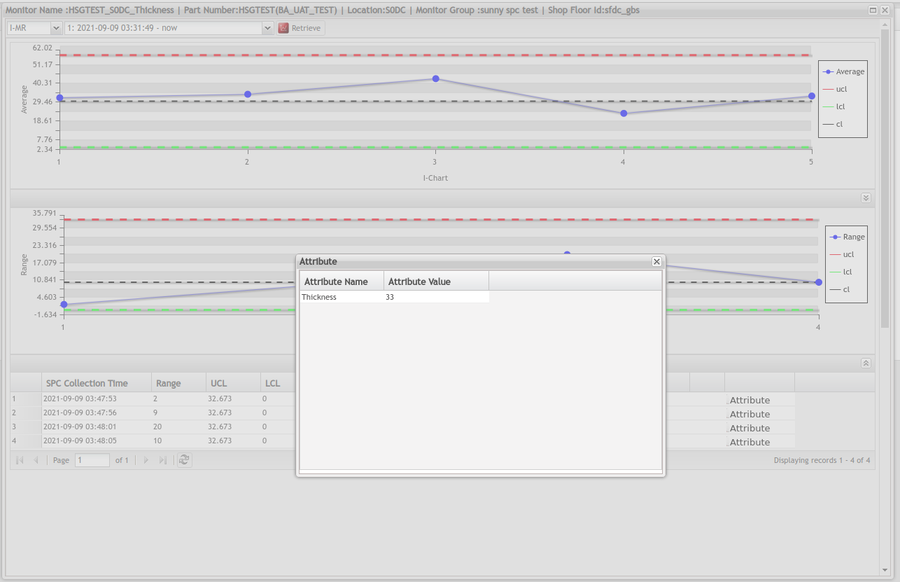
- Step 5: The users can view the charts (attribute values) at the monitor charts.
Select the monitor, then select the Chart to view the chart.
Figure 57: Monitor Chart menu.
Figure 58: Attribute value on the Chart
View Control Chart, Data & Write OCAP
Control Chart is a very important tool for SPC to monitor the manufacturing line. Through the analysis of control charts, users can learn whether a manufacturing line or process is under control and determine the reasons for an out-of-control exception, so that they can take appropriate measures. To date, our SPC system supports 6 control charts: C chart, U chart, P chart, NP chart, X Bar-R chart, I-MR chart, and also supports 5 other charts: DPMO chart, FPY chart, Yield chart, Pareto chart, and Cpk / Ppk chart.
The SPC development team applies Ext JS technology, other than the old Jfreechart technology to all of the 11 charts. The Ext JS technology enables SPC to represent more interactions with the user from the UI perspective. For instance, a user can view more information about a chart point by hovering their cursor over the point. Also, users can view both SPC charts and data on the same page without having to open them on different pages.
View Control Chart
Here take the C chart as an example to demonstrate how to view the control chart with the Ext JS technology enhancement. The operation of other control charts is similar to the C chart below.
- To SPC view the control chart, from the Monitor List page, select a monitor and click the
 icon in the toolbar. This displays the chart page.
Figure 59: Function List - Chart

Note: On the top of the page users will see a few brief pieces of information on the control chart, such as monitor name, part number, and location. The family ID can also be displayed here if the Display Family ID is checked in the SPC Portal System Parameter module.
To view any chart, users have to choose it from the available chart listed on the drop-down list at the top of the page, and then select a revision, click Retrieve and SPC will generate the chart according to the parameters used.
Figure 60: Chart Retrieve
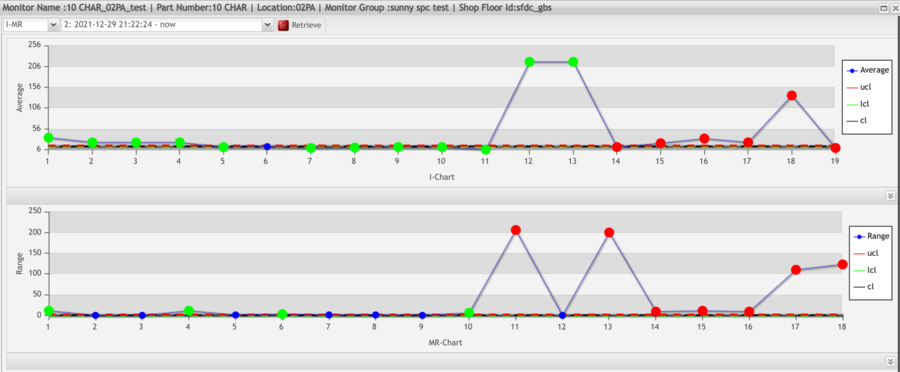
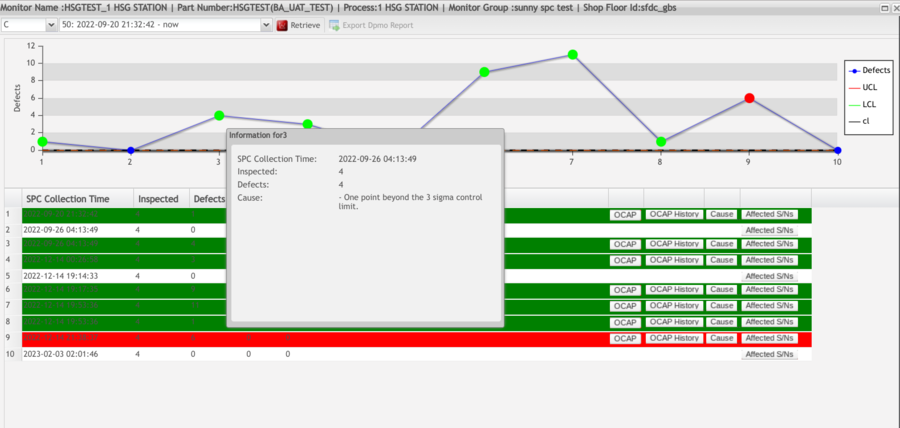
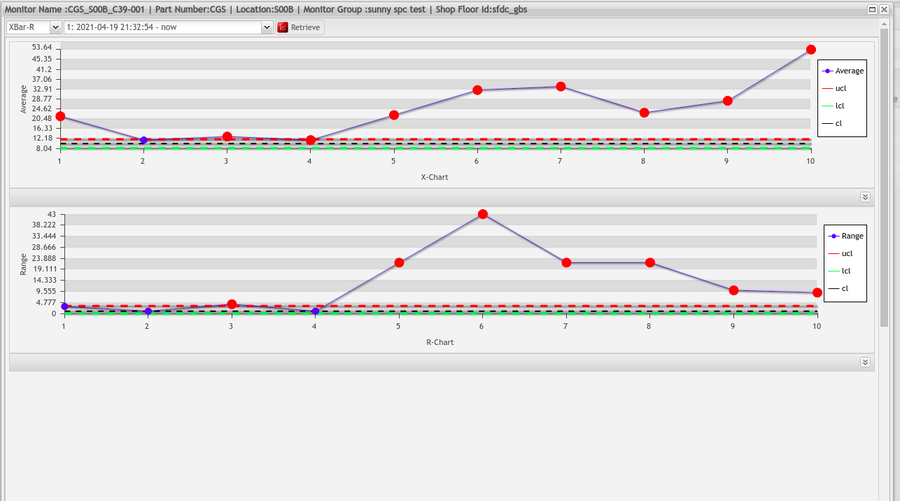
- On the Chart, blue points are normal points, red points are exception points, green points are exception points that have been written OCAP.
- If you move the cursor over a point in the chart, a pop-up window will be prompted showing more information about the selected point, including SPC Collection Time, Inspected, Defects and Cause. Note that control charts vary in more information about a selected point.
- If you click a point on the chart, the corresponding data line in the data list will be highlighted; if you select a data line from a data list, the corresponding point on the chart will be highlighted as well.
- The red background of a data line means that this data item has violated the rules you defined in the Rules section, and the OCAP of this data record has not been processed yet; the green background of a data line indicates that OCAP of this data record has been processed.
- This data list table structure consists of 9 columns: SPC Collection Time, Inspected, Defects, UCL, LCL, OCAP, OCAP History, Cause and Affected S/Ns.
Figure 61: C-Chart Information Points
Write OCAP
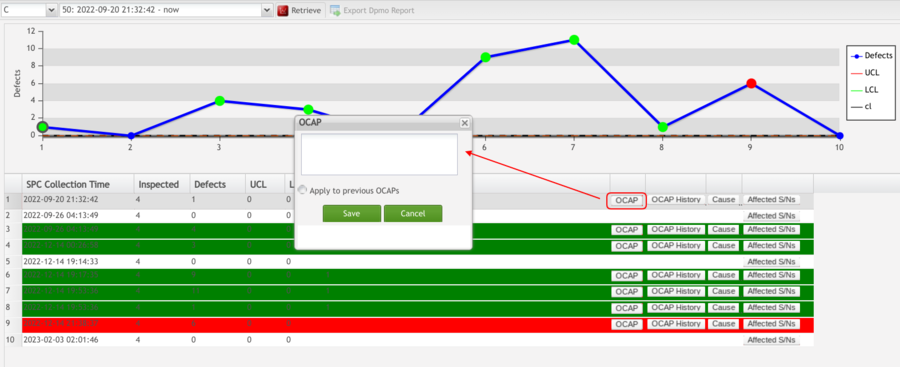
To write OCAP, means to write something about the fix to the exception. To do this:
- Select the
 icon, then input the description of this OCAP in the pop-up OCAP windows.
 - Select
 to save the change to SPC.
Figure 62: OCAP Window
If there are more than one unprocessed OCAPs after entering a description of the current OCAP, enable the Apply to previous OCAPs checkbox to apply the change to all the unprocessed OCAPs.
After the OCAP is processed, the background of the associated data record will turn green.
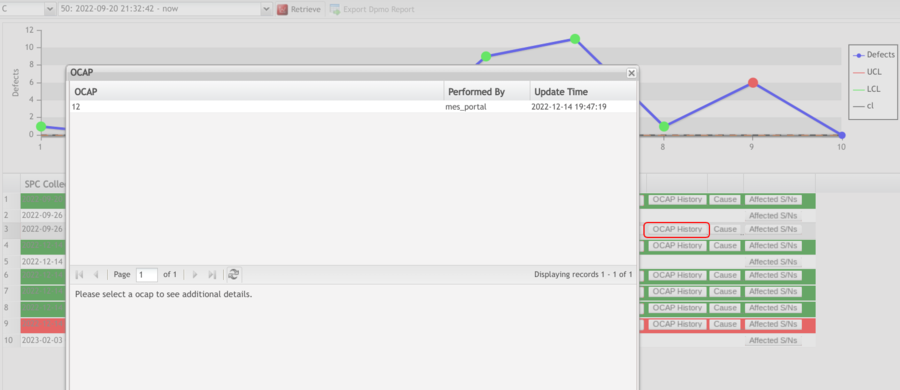
View OCAP History
Select ![]() to view the OCAP history of a data record in the pop-up OCAP history window.
to view the OCAP history of a data record in the pop-up OCAP history window.
Figure 63: OCAP History
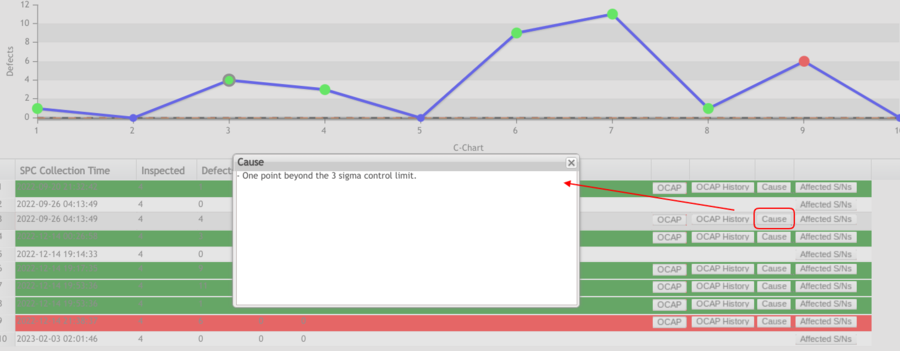
View Cause
Select ![]() to view the rules that the current point has violated.
to view the rules that the current point has violated.
Figure 64: Cause
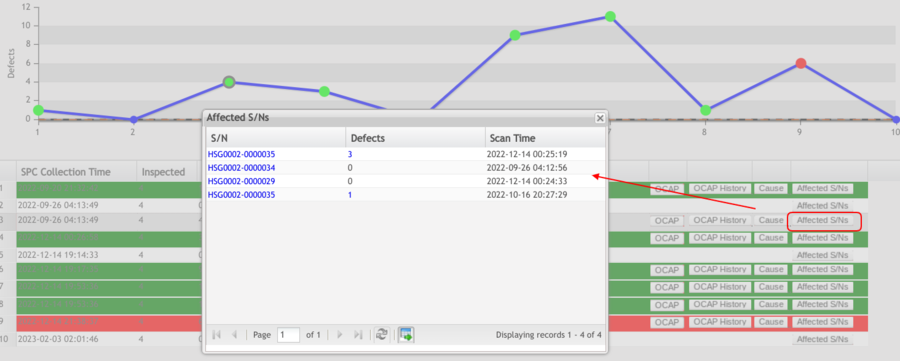
View Affected S/Ns
Users can view the affected serial numbers and export them to an CSV file.
Figure 65: Affected Serial Numbers
- To export the affected S/Ns to an CSV file, click the
 icon at the bottom of the Affected S/Ns window.
 - Select the first option to export only one monitor, else, select the second option to export all monitors.
- Select the Export button.
Figure 66: Selecting The Monitors To Export
- Select Yes in the pop-up window to confirm the action.
Figure 67: Confirm Export Alert
- Choose whether to open the XLS file or save it to the hard drive.
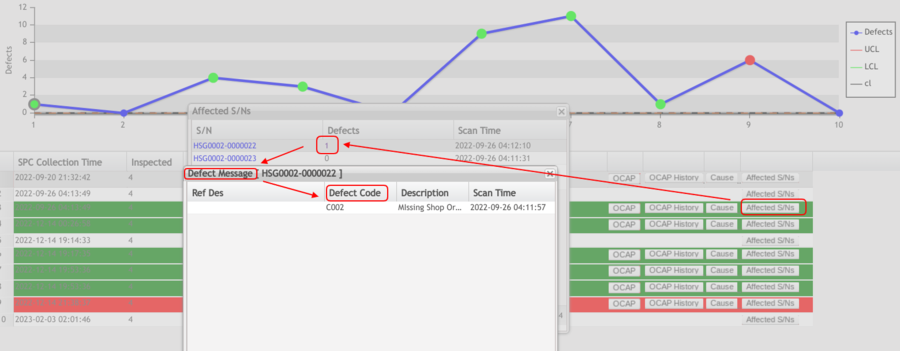
There is a reference link at the Defects, that will show the Defect Code.
Figure 68: Defect Message
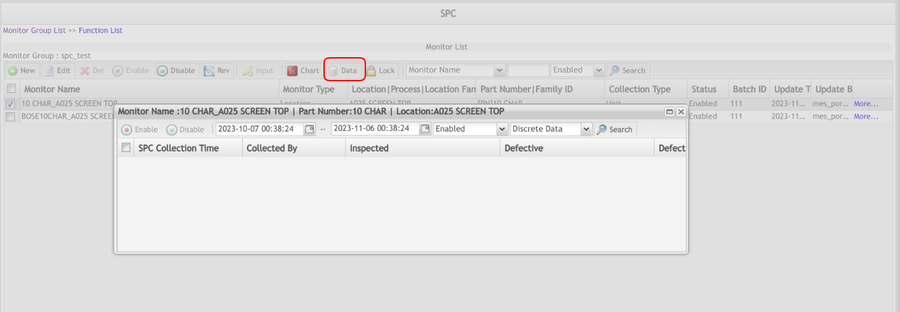
View And Edit Data
Users can view detailed data of a monitor. To do this:
On the ‘Data List’ page, set the time frame for the search by selecting the beginning date and ending date in the toolbar.
Select a status from the data status drop-down list and click the ![]() icon to view the matching data.
icon to view the matching data.
Figure 69: Data List - Automatically Collected Records
Note: The user can click the Export icon to export the records to an CSV file.
The data can also be Enabled, Disabled, and Edited.
Enabling Data restores a data record from disabled status. To do this:
A data record in the data list stands for a single point in a control chart. Disabling a data record will remove the associated point from the control chart. To disable a data item:
Users can search disabled data records by setting the time frame for the data record by selecting the beginning date and ending date, and selecting Disabled from the data status drop-down box. Then click the Search icon to execute the search action.
Edit Data function is limited to the monitor whose data is manually collected by SPC UI. To edit data record:
- From the Monitor List page, select a monitor whose Collection Type value is Manual, and click the
 icon.
icon. - In the Data List page which lists the enabled data, go to the last page of the list, select the last line and click
 in the toolbar (only the last data record is allowed to be modified). The user will be redirected to the Edit Data page where any data fields may be edited.
 - Select Save to complete the changes.
Figure 70: Data List - Edit
Maintain Lock
SPC offers a full set of functions to manage MFG hold. When creating a new monitor, users can define the minutes of delay before MFG hold was sent. Users may view lock records and unlock existing locks as well.
View Lock
- To view lock, from the Monitor List, select a monitor and click the
 icon in the toolbar. The Lock List page displays.
Figure 71: Monitor List - Lock

The Pareto Chart, C chart, U chart, NP chart, P chart, FPY chart, Xbar-R chart, and I-MR chart can send an MFG hold request to MDS. Users can view locks in different statuses as long as different values are selected in the lock status drop-down list. For example, if a user wants to find locked locks, select LOCKED from the lock status drop-down list, and click the ![]() icon in the toolbar.
icon in the toolbar.
Figure 72: Lock Search Drop-down
Users can search lock data by control chart type and lock status.
There are four statuses for locks: WAITING, LOCKED, UNLOCKED, andCANCELED. The CANCELED
- WAITING: the lock that is waiting to be sent to MDS. When an out-of-control case is detected, SPC will wait some minutes before sending the MFG hold to MDS until it reaches the number of minutes defined by Send MFG hold request after * minutes field in the Actions section. During this period, the lock is in WAITING status.
- LOCKED: MFG hold has been sent, associated location or process has been locked and OCAP has not been processed.
- UNLOCKED: User input OCAPs to unhold the associated location or process, then the locked lock becomes UNLOCKED.
- CANCELED: This lock status is a new status as of SPC 3.2. For a better understanding of this status, consider the following scenario: A SPC monitor was created for Pareto Chart that 3 defect codes of the same type within 10 minutes will trigger the exception, and MFG hold will be sent to MDS 5 minutes later. A few minutes later, a first MFG hold will be triggered, if a second MFG hold is triggered during the first hold’s delayed sending time in the new lock mechanism, the second hold will not be sent to MDS, and the status of the second MFG hold is CANCELED.
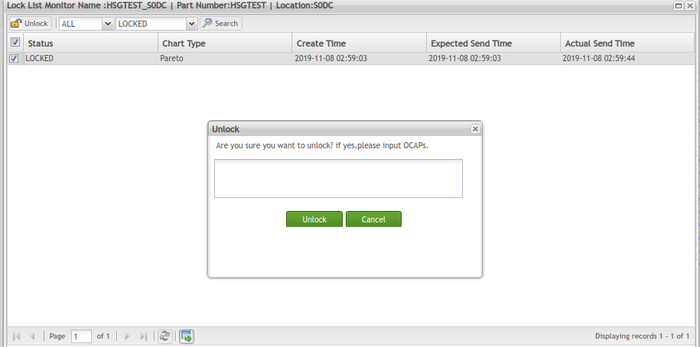
To unlock a lock:
Figure 73: Unlock Icon
Users can export the lock list to an CSV file:
- On the Lock List page, click the
 icon at the bottom of the list.
 - Select Yes in the pop-up window to confirm the action.
View Monitor Details
To learn detailed information about a monitor:
- Go to the Monitor List page, select a monitor, and click the
 text link at the right side of the line.
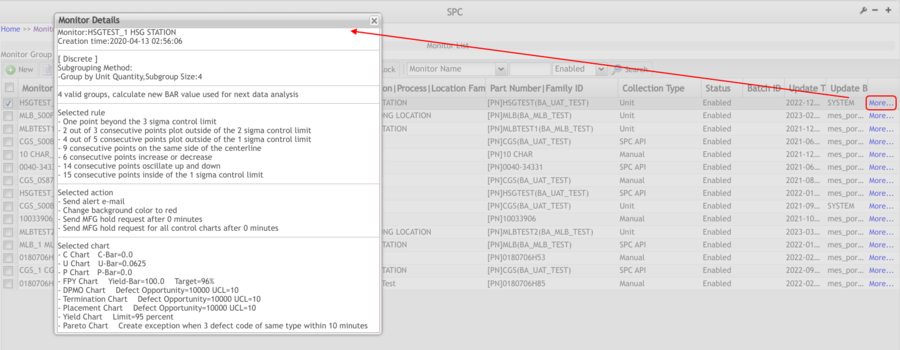
Figure 74: Function List - More
- In the pop-up Monitor, the details window provides multiple items of information including monitor name, data collection strategy, interval, rules, selected charts, and actions.
Email Maintenance 
Email notification is an important way for SPC to monitor the manufacturing line in real-time. When exceptions are found, SPC will send an email alert to the associated employee or supervisor so that they can analyze the exception according to the alert email and other SPC tools, and take appropriate measures, such as checking the production line, writing OCAPs, and stopping the line.
To access the Email Maintenance Page:
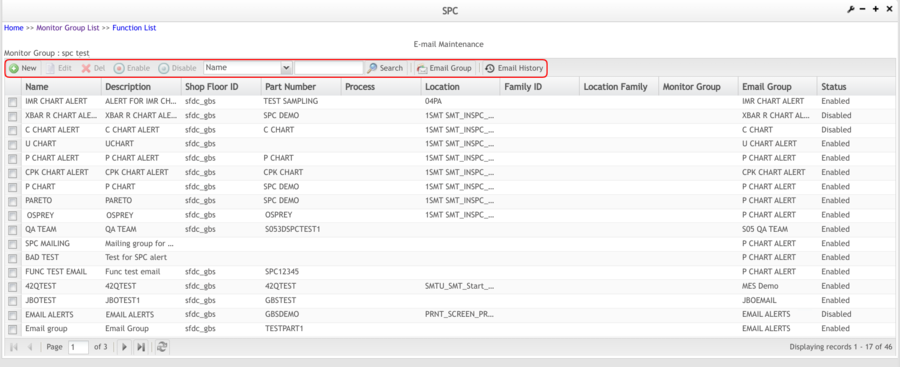
From the Email Maintenance page, the users are able to access the following functionalities:
- Email Group
- Add Monitor Receive Email Rules
- Edit Monitor Receive Email Rules
- Enable
- Disable
- Search
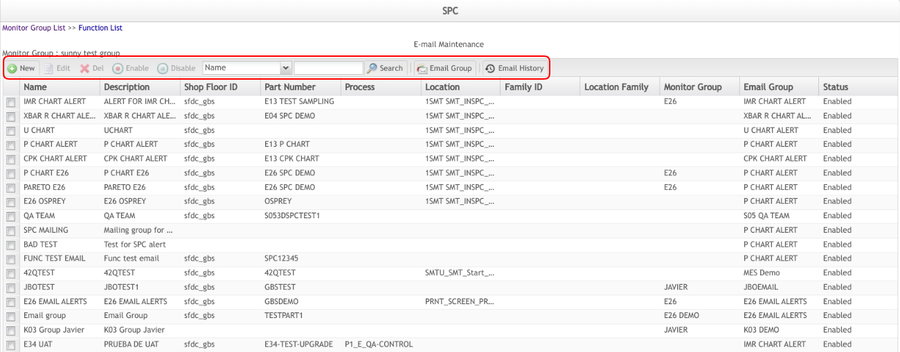
Figure 75: Email Maintenance
Email Group
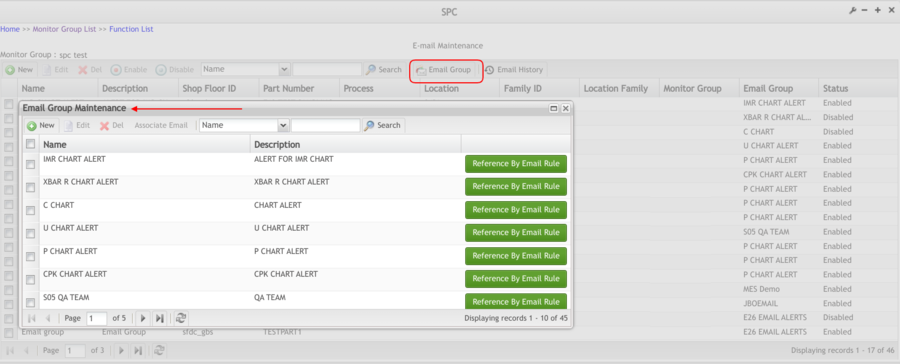
The Email Group Maintenance submodule allows users to add, edit, delete, and search email groups and also, associate emails to groups.
Figure 76: Email Group Maintenance
Add Email Group
The first thing that the user needs to do is create a User Group with a name and description to create the Receive Emails Rules.
- Select on the New button to create an email group.
Figure 77: Email Group Maintenance - New
- Enter the Name and Description (mandatory fields) for the new email group; Select the
 to keep the configuration to SPC.
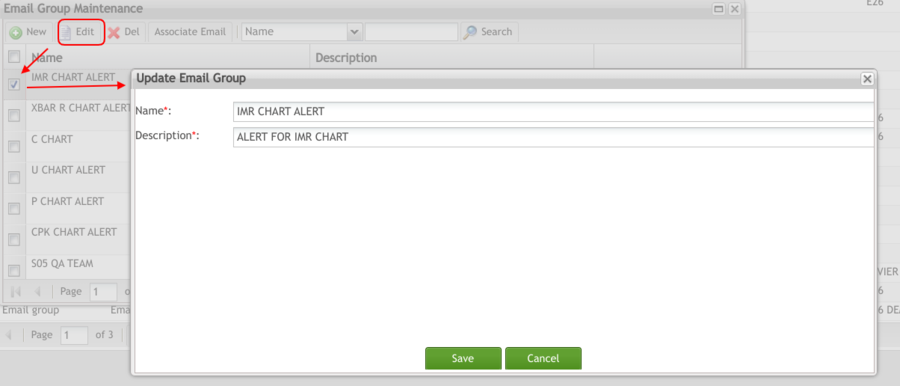
Edit Email Group
To update the email group information:
- Select the Edit button to update the email group information.
Figure 78: Email Group Maintenance - Edit
Update Name or Description fields as needed. Select the ![]() to keep the updates.
to keep the updates.
Associate Email
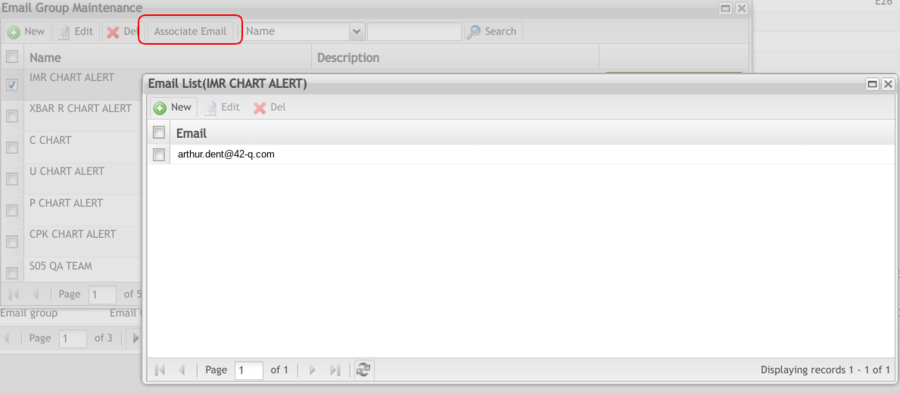
After creating an email group, the user is able to associate as many as emails is needed.
- To associate emails to the group, select a group in the list and click on Associate Email.
Figure 79: Email Group Maintenance - Associate Email
The email list page will display, and the user can add, edit, or delete emails.
Add, Edit, and Delete Emails to Group
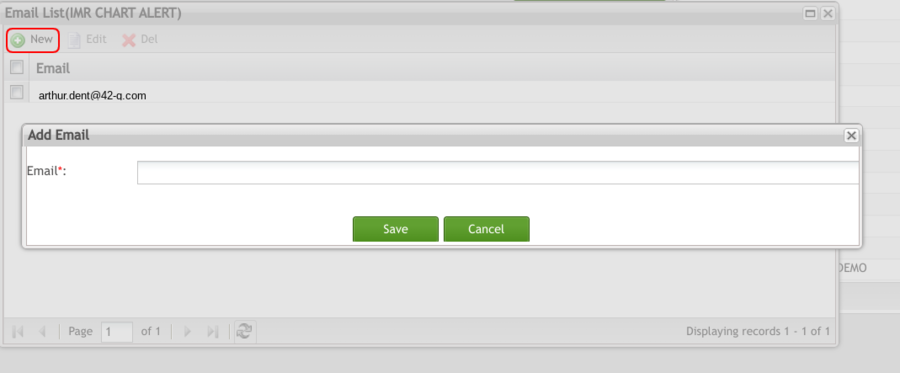
To add an email to the group:
- From the Email List page, click on the New button:
Figure 80: Add New Email to Group
- Insert the email in the Email field (mandatory) and select Save to keep the email in the group. In the same way, users can Edit and Delete by clicking the icons in the toolbar.
Search Email Group
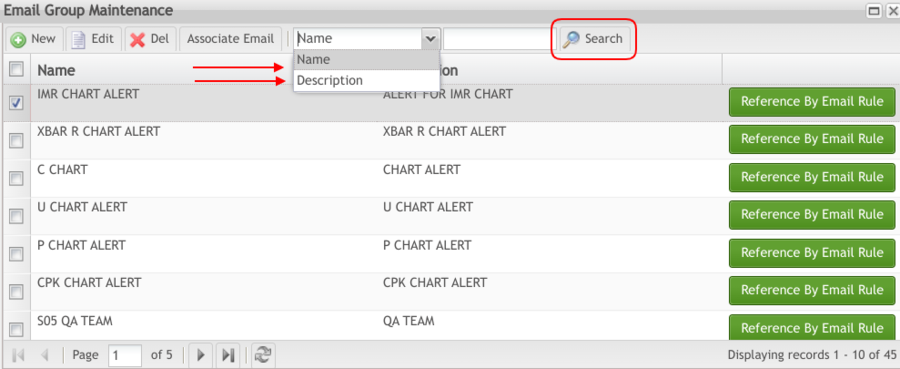
Users can search existing email groups by keyword:
- Select the kind of keyword in the keyword category drop-down list (Name or Description).
- Enter the keyword in the keyword textbox, and click the Search icon to search.
Figure 81: Email Group Maintenance - Search Email
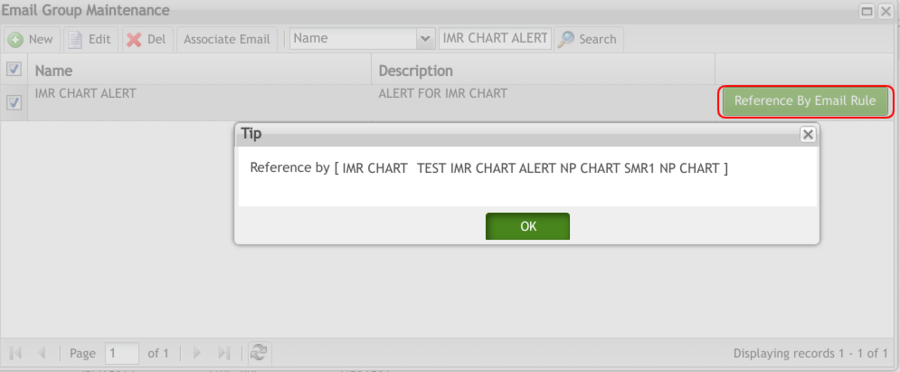
Users can also Edit and delete email groups. The Reference by Email Rule will show a Tip.
Figure 82: Email Group Maintenance - Tip
New Email Rule
This functionality allows users to create email rules as needed.
To create a new email Rule, in the Email Maintenance Page, select the New button.
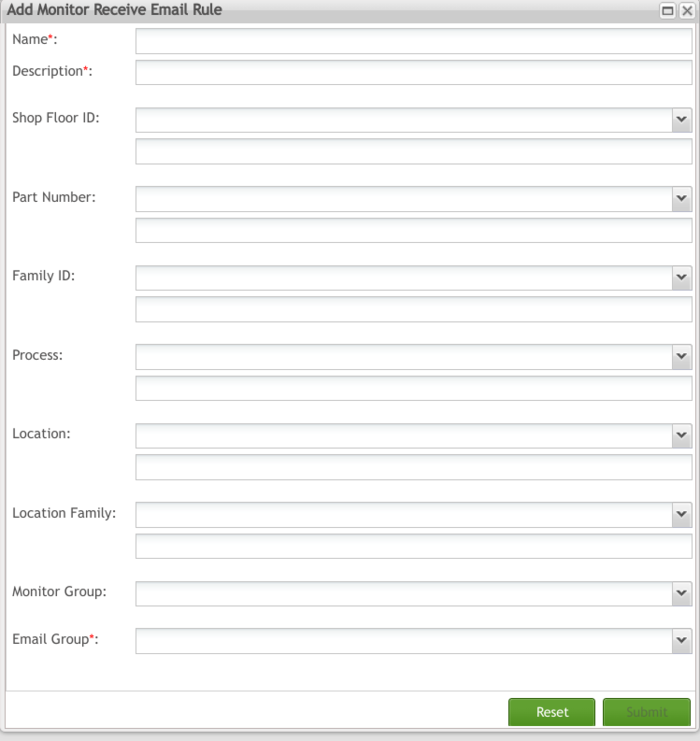
Figure 83: Email Maintenance - New Email Rule
From this page, the user needs to enter the Name, Description, and associate an Email Group (mandatory fields), created in the Email Group functionality.
After this, the rules can be created as needed by: Shop Floor ID, Part Number, Family ID, Process, Location, Family ID, and Monitor Group.
To Edit and or Delete the Email Rule, the user must use the corresponding icons on the toolbar.
This functionality allows users to edit the email rules as needed, when Delete is selected Select Yes in the pop-up window to confirm the action.
Enable / Delete Email Rule
To Enable or Disable an Email Rule record from their status:
- Select the email rule record from the enabled/disabled data list, then click the enable icon in the toolbar.
Figure 84: Enable / Disable Email Rule
When Delete is selected, click Yes in the pop-up confirms window.
Alert Email
Alert emails from SPC will contain titles like Alert message from SPC application that will contain seven information fields: Line, Monitor, Part Number, Location, Chart, Date, and Description.
When the users click the link in the mail, the system will access the charts which were generated by the alert email.
Figure 85: View the Chart from the Email Link
Lock Maintenance 
This functionality allows the user to unlock hold, search lock records by time range, and export hold records on one page.
Maintain SPC Lock Maintenance
Users may access SPC Lock Maintenance by selecting the ![]() icon on the Function List page. Users may view lock records and unlock existing locks as well.
icon on the Function List page. Users may view lock records and unlock existing locks as well.
View Lock
1. To view the lock, from the Monitor List, select a monitor and click the ![]() in the toolbar.
in the toolbar.
Users will be able to perform searches by Monitor, Chart, Status, and also Export.
Figure 86: Lock Maintenance - Lock List
The lock mechanism has been modified so only the Pareto chart can send an MFG hold request to MDS. Users can view locks in different statuses if different values are selected in the lock status drop-down list. For example, if a user wants to find locked locks, select LOCKED from the lock status drop-down list, and click the Search icon in the toolbar.
- WAITING: the lock waiting to be sent to MDS / SFDC. When the out-of-control case is detected, SPC will wait some minutes before sending the MFG hold to MDS until it reaches the number of minutes defined by Send MFG to hold requests after * minutes field in the Actions section. During this period, the lock is in WAITING status.
- LOCKED: MFG hold has been sent, the associated location or process has been locked and OCAP has not been processed.
- WAITING UNLOCKED: When users operate unlock in the lock page, first the "waiting for unlock" status, is followed by the "unlocked" status.
- UNLOCKED: The user input OCAPs to the on-hold associated location or process, then the locked lock becomes UNLOCKED.
- CANCELED: This lock status is a new status as of SPC 3.2. For a better understanding of this status, consider the following scenario: A SPC monitor was created for the Pareto Chart that 3 defect codes of the same type within 10 minutes will trigger the exception, and an MFG hold will be sent to MDS 5 minutes later. A few minutes later, a first MFG hold will be triggered, if a second MFG hold is triggered during the first hold’s delayed sending time in the new lock mechanism, the second hold will not be sent to MDS, and the status of the second MFG hold is CANCELED.
Location Family Maintenance 
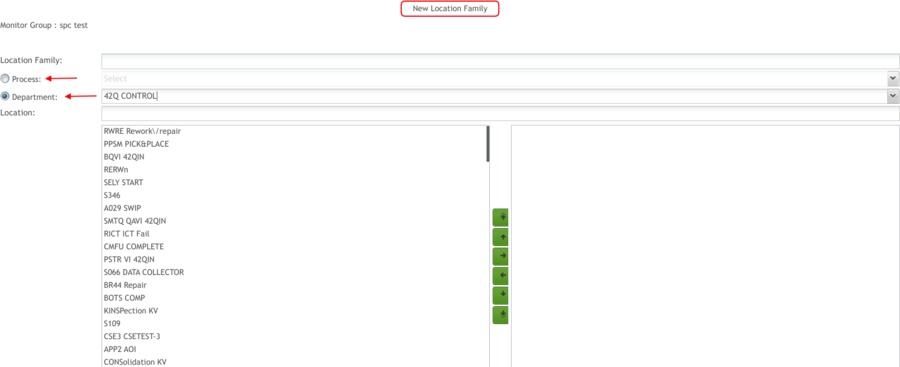
The location family is a collection of locations. One location family consists of one or more locations, which can be derived from different processes and departments. The authorized user can create, search, edit, disable, delete, and enable location family.
Create Location Family
To create a new location family:
- Select the
 icon on the Function List page.
 - On-Location Family List page, click
 button in the toolbar.
 - Select Process, or Department.
Figure 88: Location Family List Page - New Icon
- Enter values in the Location textbox to filter locations. If a user changes the values of the Location textbox, its instant search function activates, and the SPC system automatically searches matching locations from the locations that belong to the selected department, displaying matching locations in the Location selection box.
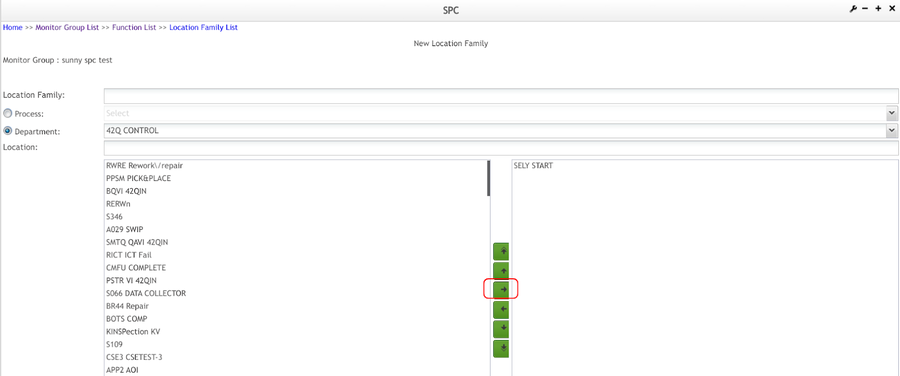
- Select a location and click the
 button to add locations from the left panel to the right panel. More than one location can be selected at a time.
Figure 89: Add Location
- Lastly, click the Save button to Save your data to SPC.
Edit and Delete Location Family
To edit a location family:
- Select a location family from the list, then click the Edit icon in the toolbar. The Edit Location Family page will display.
Figure 90: Location Family Edit
- In the Edit Location Family page, edit any field you want, and save the changes.
To delete a location family, the user has to Disable the location first.
- Select the location family and click Disable.
- Search the disabled location family list for the disabled location family, select the location family, and click Delete.
Figure 91: Location Family List - Delete
- Select Yes to confirm the action.
Enable / Disable Location family
To enable a location family:
- Select a location family and click the Enable icon in the toolbar.
Figure 92: Location Family List - Enable
- Choose Yes in the pop-up window.
DeleteTo disable a location family:
Select a location family and click the Disable icon in the toolbar.
Figure 93: Location Family List - Disable
Choose Yes in the pop-up confirms window.
Search Location Family
SPC enables users to search for location families by keyword and status. To search for a location family:
- Go to the Location Family List page
- Select a keyword category, and input a keyword in the text input box
- Select a status
- Select the Search icon
Figure 94: Search Location Family
System Log Maintenance 
Some important system events, such as data modification and stopping a monitor, will be automatically added to SPC system log. System log plays an important role in system security. Users can analyze the system log and decide to take appropriate measures, like data recovery and file backup, to defend the system. In the SPC system, authorized users can search, view, and delete system logs.
Search and View System Log
On the Function List page, users can click the ![]() icon to navigate to the System Log page. On the System Log page, users can search the system log by time frame or by event owner:
icon to navigate to the System Log page. On the System Log page, users can search the system log by time frame or by event owner:
Figure 95: System Log Page
- Input event owner in the Performed by textbox or choose a time frame and click the
 icon in the toolbar.
 - System log list table structure contains three columns - Date, Performed By, and Operation.
- Delete System Log
Every 24 hours, SPC automatically deletes system logs created 3 months before. Authorized users can delete logs manually via SPC UI. Users can delete logs individually or in batches.
SPC System Parameter Maintenance
Authorized users are allowed to set general system parameters according to their local plants, manufacturing lines, or other special needs. This part of system parameters configuration affects the performance of the current SPC server, caution is necessary when defining the parameter values.
Users may access SPC System Parameters Maintenance by selecting the icon on the Function List page.
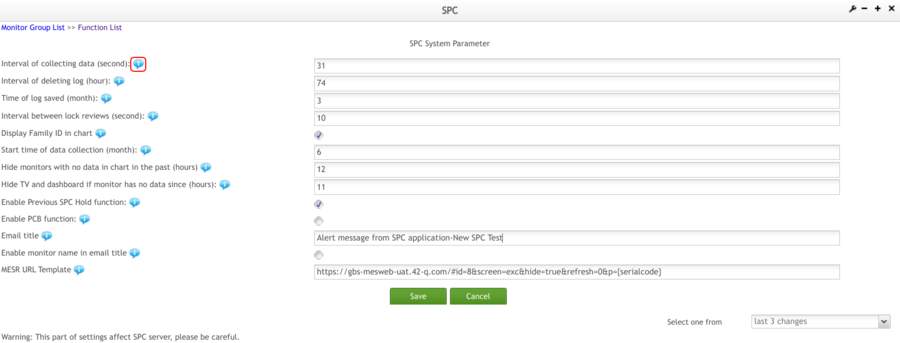
On the SPC System Parameter page, eleven fields are displayed and the user can move their mouse over the ![]() icon to learn more information about the labels.
icon to learn more information about the labels.
See below the fields description:
Figure 96: SPC System Parameter Page
An explanation of the fields from the above screenshot follows:
- Interval of collecting data (second): During real-time monitoring, each monitor will periodically collect data from SFDC archive database or other data source, the setting determines how often each monitor collects data.
- Interval of deleting log (hour): There is one background job (thread) responsible to periodically delete the system log, this setting determines how often the background job deletes some system logs.
- Time of log saved (month): System log will not be saved forever, a too old log will be deleted by background job, this setting determines how long the system log is saved in the database.
- Interval between lock reviews (second): How often the background job review lock (or called MFG hold request to determine if one waiting lock should be sent to the MES.
- Display family ID in chart: By selecting this checkbox, the Family ID will display on the SPC chart.
- Start time of data collection (month): After one monitor is created, this monitor related data can be retrieved from a past time, this setting determines how old data can be when retrieved by monitor. The default value is 3 months.
- Hide monitors with no data in chart in the past (hours): It allows users to filter out those monitors that have no new data coming in during the past settable hours. Users can input a positive number between 1 to 168 in the textbox. The default value for this textbox is 24. To view the effect, you can check the Hide Inactive Monitors feature on the Monitor List page.
- Hide on TV and dashboard if monitors with no data in chart in the past (hours): The SPC will automatically disable those monitors that have no new data during the past settable hours. The hours quantity textbox next to it has a default value of 8 (hours). This textbox allows positive integers from 1 to 24.
Note: All the newly created monitors are enabled by default. Users can define this value, then the system will hide the monitors with no data to avoid there being too many monitors in the list.
- Enable Previous SPC Hold function: Previous Hold function will be invoked in the following scenario: after a part number was put on SPC Hold by SPC for the settable number of consecutive defect codes within a set time limit, will display ‘PREVIOUS SPC HOLD’ in NetDC rather than issuing an immediate SPC holds.
Note: If a monitor is stopped, disabled, or deleted, the Previous Hold function of this monitor will be automatically turned off as well. Users must enable the Send MFG to hold to MDS checkbox in Add Server Information page first, before enabling the Enable Previous SPC Hold function checkbox.
- Enable PCB function: Enable PCB function as global parameters affect one site. Its default value is unselected. PCB plants need to click the checkbox to make PCB function take effect. The PCB checkbox affects monitor creation and data collection.
Enabling the PCB function will enable the following requests from PCB plants when creating an SPC monitor: the ability to see the PN without a route assigned, the ability to display attributes with not defined PN as well as count defect code B.
- Email Title: To set the title of the alarm email.
- Enable monitor name in email title: This checkbox will send an Alert message from SPC application with the monitor name to the user’s email address.
- MESR URL Template: This field is to set a URL link to the MES Web. The URL template is plantcode-mesweb-med.42-q.com or plantcode-mesweb-med-uat.42-q.com. Hence, the original HTTP URL template is not suitable as a fixed URL link.
After all configurations are done, remember to click the ![]() icon. If the save was successful, the user will see the message 'Configurations are successfully saved and will be immediately effective'. If there is a malfunction, users will see the error message 'Configurations are not saved, please try again or contact administrator.'
icon. If the save was successful, the user will see the message 'Configurations are successfully saved and will be immediately effective'. If there is a malfunction, users will see the error message 'Configurations are not saved, please try again or contact administrator.'
